MQL5での取引戦略の自動化(第13回):三尊天井取引アルゴリズムの構築

はじめに
前回の記事(第12回)では、MetaQuotes Language 5 (MQL5) で、Mitigation Order Blocks (MOB)戦略を実装し、機関投資家の価格帯を活用した取引手法を紹介しました。今回の第13回では、焦点を三尊天井取引アルゴリズムの構築に移し、この古典的な反転パターンを自動化することで、精度の高い相場転換の捉え方を目指します。次のトピックについて説明します。
この記事を読み終える頃には、三尊天井パターンに基づいて自動売買をおこなう完全なEAが完成しているはずです。それでは始めましょう。
三尊天井パターンの構造を理解する
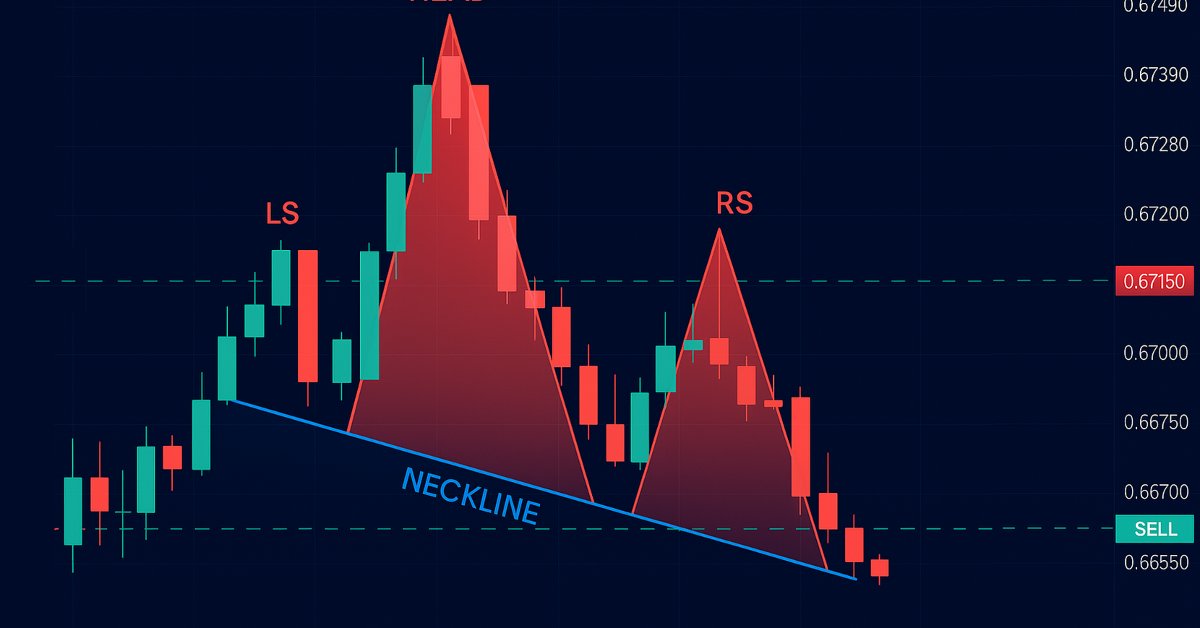
三尊天井パターンは、テクニカル分析において広く知られるトレンド転換のシグナルであり、「三尊天井(弱気)」と「逆三尊(強気)」の2種類が存在します。それぞれ、価格の山(または谷)の特定の並びによって定義されます。本記事で扱う三尊天井パターンでは、上昇トレンドの終盤に3つの山が現れます。最初に現れる左肩は一度目の高値を形成し、次にその高値を大きく上回る頭がトレンドのピークとして出現します。そして三番目に現れる右肩は、頭よりも低いものの、左肩とほぼ同じ水準の高値をつけて形を整えます。これらの山の間には谷があり、その2つの谷を結んだ線が「ネックライン」となります。価格がこのネックラインを下回ってブレイクアウトした時点で、本記事のプログラムでは、売りでエントリーします。ストップロス(損切り)は右肩の上に設定し、ヘッドからネックラインまでの高さを下方向に投影してテイクプロフィット(利確)の目標を設定します。下図のように取引戦略を構築します。

逆三尊パターンパターンでは、下降トレンドの中で3つの谷が形成されます。最初の左肩が安値を示し、頭がそれを大きく下回る深い安値を記録し、右肩は左肩とほぼ同じレベルで形成されます。これらのピークを結んだ線が「ネックライン」となります。価格がこのネックラインを上抜けてブレイクアウトした場合、本稿のプログラムでは買いでエントリーします。ストップロス(損切り)は右肩の下に設定し、ヘッドからネックラインまでの高さを上方向に投影してテイクプロフィット(利確)目標を定めます。この戦略は、ヘッドの際立った深さと、左右の肩のほぼ対称性をルールの基盤として構築されます。これがその視覚化です。

リスク管理に関しては、利益を確保しつつ最大限の利得を狙うために、オプションのトレーリングストップ機能を統合します。それでは、さっそく始めましょう。
MQL5での実装
MQL5でプログラムを作成するには、まずMetaEditorを開き、ナビゲータに移動して、Indicatorsフォルダを見つけ、[新規作成]タブをクリックして、表示される手順に従ってファイルを作成します。ファイルが作成されたら、コーディング環境で、まずプログラム全体で使用するグローバル変数をいくつか宣言する必要があります。
//+------------------------------------------------------------------+
//|                                  Head & Shoulders Pattern EA.mq5 |
//|                           Copyright 2025, Allan Munene Mutiiria. |
//|                                   https://t.me/Forex_Algo_Trader |
//+------------------------------------------------------------------+
#property copyright "Copyright 2025, Allan Munene Mutiiria."
#property link      "https://youtube.com/@ForexAlgo-Trader?"
#property version   "1.00"

#include <Trade\Trade.mqh>                    //--- Include the Trade.mqh library for trading functions
CTrade obj_Trade;                            //--- Trade object for executing and managing trades

// Input Parameters
input int LookbackBars = 50;                   // Number of historical bars to analyze for pattern detection
input double ThresholdPoints = 70.0;           // Minimum price movement in points to identify a reversal
input double ShoulderTolerancePoints = 15.0;   // Maximum allowable price difference between left and right shoulders
input double TroughTolerancePoints = 30.0;     // Maximum allowable price difference between neckline troughs or peaks
input double BufferPoints = 10.0;              // Additional points added to stop-loss for safety buffer
input double LotSize = 0.1;                    // Volume of each trade in lots
input ulong MagicNumber = 123456;              // Unique identifier for trades opened by this EA
input int MaxBarRange = 30;                    // Maximum number of bars allowed between key pattern points
input int MinBarRange = 5;                     // Minimum number of bars required between key pattern points
input double BarRangeMultiplier = 2.0;         // Maximum multiple of the smallest bar range for pattern uniformity
input int ValidationBars = 3;                  // Number of bars after right shoulder to validate breakout
input double PriceTolerance = 5.0;             // Price tolerance in points for matching traded patterns
input double RightShoulderBreakoutMultiplier = 1.5; // Maximum multiple of pattern range for right shoulder to breakout distance
input int MaxTradedPatterns = 20;              // Maximum number of patterns stored in traded history
input bool UseTrailingStop = false;             // Toggle to enable or disable trailing stop functionality
input int MinTrailPoints = 50;                 // Minimum profit in points before trailing stop activates
input int TrailingPoints = 30;                 // Distance in points to maintain behind current price when trailing
ここでは、「#include <Trade\Trade.mqh>」とCTradeオブジェクト「obj_Trade」を使用して、取引管理用の追加の取引ファイルをインクルードします。LookbackBars(デフォルト50)は過去の分析のために、ThresholdPoints(デフォルト70.0)は反転の確認のために、ShoulderTolerancePoints(デフォルト15.0)とTroughTolerancePoints(デフォルト30.0)は左右の対称性を評価するために設定します。それ以外の入力項目は直感的に理解しやすい内容です。理解しやすいように、詳細なコメントも追加しています。次に、パターンの検出と対象となる取引の管理に使用する構造体を定義する必要があります。
// Structure to store peaks and troughs
struct Extremum {
   int bar;           //--- Bar index where extremum occurs
   datetime time;     //--- Timestamp of the bar
   double price;      //--- Price at extremum (high for peak, low for trough)
   bool isPeak;       //--- True if peak (high), false if trough (low)
};

// Structure to store traded patterns
struct TradedPattern {
   datetime leftShoulderTime;  //--- Timestamp of the left shoulder
   double leftShoulderPrice;   //--- Price of the left shoulder
};
三尊天井取引アルゴリズムを実行するために、structを使用して2つの主要な構造体を設定しました。Extremumはパターン構成要素を特定するために、ピークおよびトラフをbar(インデックス)、time(タイムスタンプ)、price(価格)、isPeak(ピークならtrue、谷ならfalse)として記録します。一方、TradedPatternは重複を防ぐために、leftShoulderTime(左肩の時刻)およびleftShoulderPrice(左肩の価格)を用いて実行済みの取引を追跡します。バーごとに 1 回取引し、実行中の取引を追跡できるようにするために、次のように変数と配列を宣言します。
// Global Variables
static datetime lastBarTime = 0;         //--- Tracks the timestamp of the last processed bar to avoid reprocessing
TradedPattern tradedPatterns[];          //--- Array to store details of previously traded patterns
これで準備は整いました。しかし、パターンをチャート上に表示する必要があるため、パターンの要件に適応できるように、チャートの構造とバーの構成要素を取得する必要があります。
int chart_width         = (int)ChartGetInteger(0, CHART_WIDTH_IN_PIXELS);        //--- Width of the chart in pixels for visualization
int chart_height        = (int)ChartGetInteger(0, CHART_HEIGHT_IN_PIXELS);       //--- Height of the chart in pixels for visualization
int chart_scale         = (int)ChartGetInteger(0, CHART_SCALE);                  //--- Zoom level of the chart (0-5)
int chart_first_vis_bar = (int)ChartGetInteger(0, CHART_FIRST_VISIBLE_BAR);      //--- Index of the first visible bar on the chart
int chart_vis_bars      = (int)ChartGetInteger(0, CHART_VISIBLE_BARS);           //--- Number of visible bars on the chart
double chart_prcmin     = ChartGetDouble(0, CHART_PRICE_MIN, 0);                 //--- Minimum price visible on the chart
double chart_prcmax     = ChartGetDouble(0, CHART_PRICE_MAX, 0);                 //--- Maximum price visible on the chart

//+------------------------------------------------------------------+
//| Converts the chart scale property to bar width/spacing           |
//+------------------------------------------------------------------+
int BarWidth(int scale) { return (int)pow(2, scale); }                           //--- Calculates bar width in pixels based on chart scale (zoom level)

//+------------------------------------------------------------------+
//| Converts the bar index (as series) to x in pixels                |
//+------------------------------------------------------------------+
int ShiftToX(int shift) { return (chart_first_vis_bar - shift) * BarWidth(chart_scale) - 1; } //--- Converts bar index to x-coordinate in pixels on the chart

//+------------------------------------------------------------------+
//| Converts the price to y in pixels                                |
//+------------------------------------------------------------------+
int PriceToY(double price) {                                                     //--- Function to convert price to y-coordinate in pixels
   if (chart_prcmax - chart_prcmin == 0.0) return 0;                             //--- Return 0 if price range is zero to avoid division by zero
   return (int)round(chart_height * (chart_prcmax - price) / (chart_prcmax - chart_prcmin) - 1); //--- Calculate y-pixel position based on price and chart dimensions
}
可視化に対応させるため、ChartGetInteger関数を使ってチャートの幅と高さを取得するための変数chart_widthとchart_height、ズームレベルを表すchart_scale、表示中の最初のバーと表示バー数を取得するためのchart_first_vis_barとchart_vis_bars、そして価格範囲を得るためにChartGetDoubleを使ってchart_prcminとchart_prcmaxを定義します。バー間の間隔はchart_scaleをpow関数と共にBarWidth関数で計算し、バーインデックスをx座標に変換するShiftToX関数にはchart_first_vis_barとchart_scaleを使用します。価格をy座標にマッピングするPriceToY関数では、round関数を使いchart_height、chart_prcmax、chart_prcminを基に計算をおこないます。これにより、パターンをチャート上に正確に描画できるようになります。準備はすべて整いました。次に、OnInitイベントハンドラ内でプログラムの初期化処理に進みます。
//+------------------------------------------------------------------+
//| Expert initialization function                                   |
//+------------------------------------------------------------------+
int OnInit() {                                                           //--- Expert Advisor initialization function
   obj_Trade.SetExpertMagicNumber(MagicNumber);                          //--- Set the magic number for trades opened by this EA
   ArrayResize(tradedPatterns, 0);                                       //--- Initialize tradedPatterns array with zero size
   return(INIT_SUCCEEDED);                                               //--- Return success code to indicate successful initialization
}
OnInitでは、obj_Tradeオブジェクトに対してSetExpertMagicNumberメソッドを使用し、MagicNumberをすべてのトレードの一意な識別子として設定します。これにより、プログラムが管理するポジションを他と区別できるようになります。次に、ArrayResize関数を使用してtradedPatterns配列のサイズをゼロに設定し、過去のデータをクリアして新たなスタートを切れるようにします。最後に、INIT_SUCCEEDEDを返すことで初期化が正常に完了したことを示し、パターンの検出と取引に備えてエキスパートアドバイザー(EA)の準備が整います。これで、OnTickイベントハンドラに進み、1バーにつき1回だけ分析が実行されるように実装を進めることができます。
//+------------------------------------------------------------------+
//| Expert tick function                                             |
//+------------------------------------------------------------------+
void OnTick() {                                                          //--- Main tick function executed on each price update
   datetime currentBarTime = iTime(_Symbol, _Period, 0);                 //--- Get the timestamp of the current bar
   if (currentBarTime == lastBarTime) return;                            //--- Exit if the current bar has already been processed

   lastBarTime = currentBarTime;                                         //--- Update the last processed bar time

   // Update chart properties
   chart_width         = (int)ChartGetInteger(0, CHART_WIDTH_IN_PIXELS); //--- Update chart width in pixels
   chart_height        = (int)ChartGetInteger(0, CHART_HEIGHT_IN_PIXELS); //--- Update chart height in pixels
   chart_scale         = (int)ChartGetInteger(0, CHART_SCALE);           //--- Update chart zoom level
   chart_first_vis_bar = (int)ChartGetInteger(0, CHART_FIRST_VISIBLE_BAR); //--- Update index of the first visible bar
   chart_vis_bars      = (int)ChartGetInteger(0, CHART_VISIBLE_BARS);    //--- Update number of visible bars
   chart_prcmin        = ChartGetDouble(0, CHART_PRICE_MIN, 0);          //--- Update minimum visible price on chart
   chart_prcmax        = ChartGetDouble(0, CHART_PRICE_MAX, 0);          //--- Update maximum visible price on chart

   // Skip pattern detection if a position is already open
   if (PositionsTotal() > 0) return;                                     //--- Exit function if there are open positions to avoid multiple trades
}
OnTickイベントハンドラは、価格が更新されるたびに呼び出され、市場の変化を監視・対応する役割を果たします。まず、iTime関数を使って最新バーの時間を取得し、currentBarTimeとして保存します。これをlastBarTimeと比較することで同じバー内での再処理を防ぎ、新しいバーである場合のみlastBarTimeを更新します。次に、ChartGetIntegerを使用してchart_width、chart_height、chart_scale、chart_first_vis_bar、chart_vis_barsを最新のチャート情報で更新し、ChartGetDoubleを使ってchart_prcminとchart_prcmaxの価格レンジも取得します。また、PositionsTotal関数を使用して現在のポジション数を確認し、ポジションが存在する場合は処理を中断して重複ポジションを防ぎます。以上の処理で準備が整ったら、パターン検出と取引に進むため、次に極値、つまり重要なパターンの構成要素を見つける関数を定義します。
//+------------------------------------------------------------------+
//| Find extrema in the last N bars                                  |
//+------------------------------------------------------------------+
void FindExtrema(Extremum &extrema[], int lookback) {                    //--- Function to identify peaks and troughs in price history
   ArrayFree(extrema);                                                   //--- Clear the extrema array to start fresh
   int bars = Bars(_Symbol, _Period);                                    //--- Get total number of bars available
   if (lookback >= bars) lookback = bars - 1;                            //--- Adjust lookback if it exceeds available bars

   double highs[], lows[];                                               //--- Arrays to store high and low prices
   ArraySetAsSeries(highs, true);                                        //--- Set highs array as time series (newest first)
   ArraySetAsSeries(lows, true);                                         //--- Set lows array as time series (newest first)
   CopyHigh(_Symbol, _Period, 0, lookback + 1, highs);                   //--- Copy high prices for lookback period
   CopyLow(_Symbol, _Period, 0, lookback + 1, lows);                     //--- Copy low prices for lookback period

   bool isUpTrend = highs[lookback] < highs[lookback - 1];               //--- Determine initial trend based on first two bars
   double lastHigh = highs[lookback];                                    //--- Initialize last high price
   double lastLow = lows[lookback];                                      //--- Initialize last low price
   int lastExtremumBar = lookback;                                       //--- Initialize last extremum bar index

   for (int i = lookback - 1; i >= 0; i--) {                             //--- Loop through bars from oldest to newest
      if (isUpTrend) {                                                   //--- If currently in an uptrend
         if (highs[i] > lastHigh) {                                      //--- Check if current high exceeds last high
            lastHigh = highs[i];                                         //--- Update last high price
            lastExtremumBar = i;                                         //--- Update last extremum bar index
         } else if (lows[i] < lastHigh - ThresholdPoints * _Point) {     //--- Check if current low indicates a reversal (trough)
            int size = ArraySize(extrema);                               //--- Get current size of extrema array
            ArrayResize(extrema, size + 1);                              //--- Resize array to add new extremum
            extrema[size].bar = lastExtremumBar;                         //--- Store bar index of the peak
            extrema[size].time = iTime(_Symbol, _Period, lastExtremumBar); //--- Store timestamp of the peak
            extrema[size].price = lastHigh;                              //--- Store price of the peak
            extrema[size].isPeak = true;                                 //--- Mark as a peak
            //Print("Extrema added: Bar ", lastExtremumBar, ", Time ", TimeToString(extrema[size].time), ", Price ", DoubleToString(lastHigh, _Digits), ", IsPeak true"); //--- Log new peak
            isUpTrend = false;                                           //--- Switch trend to downtrend
            lastLow = lows[i];                                           //--- Update last low price
            lastExtremumBar = i;                                         //--- Update last extremum bar index
         }
      } else {                                                        //--- If currently in a downtrend
         if (lows[i] < lastLow) {                                     //--- Check if current low is below last low
            lastLow = lows[i];                                        //--- Update last low price
            lastExtremumBar = i;                                      //--- Update last extremum bar index
         } else if (highs[i] > lastLow + ThresholdPoints * _Point) {  //--- Check if current high indicates a reversal (peak)
            int size = ArraySize(extrema);                            //--- Get current size of extrema array
            ArrayResize(extrema, size + 1);                           //--- Resize array to add new extremum
            extrema[size].bar = lastExtremumBar;                      //--- Store bar index of the trough
            extrema[size].time = iTime(_Symbol, _Period, lastExtremumBar); //--- Store timestamp of the trough
            extrema[size].price = lastLow;                            //--- Store price of the trough
            extrema[size].isPeak = false;                             //--- Mark as a trough
            //Print("Extrema added: Bar ", lastExtremumBar, ", Time ", TimeToString(extrema[size].time), ", Price ", DoubleToString(lastLow, _Digits), ", IsPeak false"); //--- Log new trough
            isUpTrend = true;                                         //--- Switch trend to uptrend
            lastHigh = highs[i];                                      //--- Update last high price
            lastExtremumBar = i;                                      //--- Update last extremum bar index
         }
      }
   }
}
ここでは、三尊天井パターンを構成するピークと谷を特定するために、FindExtrema関数を実装し、直近のlookback本のバーを解析して重要な価格ポイントのextrema配列を構築します。まず、ArrayFree関数を使用してextrema配列を初期化し、不要なデータをクリアします。次に、Bars関数を使って利用可能なバーの総数を取得し、lookbackの値がこの上限を超えないように制限することで、チャートのデータ範囲内に収めます。その後、価格データを格納するためのhighs配列とlows配列を準備し、ArraySetAsSeries関数を使って時系列形式(最新が先頭)に設定します。そして、CopyHighおよびCopyLow関数を使用して、lookback + 1本分の高値と安値を抽出・格納します。
次に、最も古いバーから最新バーに向けたループを実行し、初期の価格変動をもとに上昇トレンドかどうかを判定するisUpTrendを決定します。その後、lastHighまたはlastLowとそれに対応するlastExtremumBarを記録し、価格が設定されたThresholdPointsを超えて反転したときに、extrema配列をArrayResize関数で拡張します。さらに、bar、time(iTime関数で取得)、price、isPeak(ピークならtrue、谷ならfalse)といった詳細情報を保存し、トレンド方向を切り替えます。次は、こうして特定された価格レベルを後の処理で利用できるように保存していきます。
Extremum extrema[];                                                   //--- Array to store identified peaks and troughs
FindExtrema(extrema, LookbackBars);                                   //--- Find extrema in the last LookbackBars bars
ここでは、パターンの肩と頭を保持するために、ピークと谷を格納するExtremum型のextrema配列を宣言します。次に、FindExtrema関数を呼び出し、extremaとLookbackBarsを引数として渡すことで、直近LookbackBars本のバーをスキャンし、重要な極値をextrema配列に格納します。これにより、パターン認識とその後の取引判断の基礎が築かれます。ArrayPrint関数を使用してextrema配列の値を出力すると、以下のような構造が表現されます。

これで必要なデータポイントが揃ったことが確認できました。次に、パターンの構成要素を特定する処理に進みます。コードをモジュール化するために、関数を活用して実装していきます。
//+------------------------------------------------------------------+
//| Detect standard Head and Shoulders pattern                       |
//+------------------------------------------------------------------+
bool DetectHeadAndShoulders(Extremum &extrema[], int &leftShoulderIdx, int &headIdx, int &rightShoulderIdx, int &necklineStartIdx, int &necklineEndIdx) { //--- Function to detect standard H&S pattern
   int size = ArraySize(extrema);                                        //--- Get the size of the extrema array
   if (size < 6) return false;                                           //--- Return false if insufficient extrema for pattern (need at least 6 points)

   for (int i = size - 6; i >= 0; i--) {                                 //--- Loop through extrema to find H&S pattern (start at size-6 to ensure enough points)
      if (!extrema[i].isPeak && extrema[i+1].isPeak && !extrema[i+2].isPeak && //--- Check sequence: trough, peak (LS), trough
          extrema[i+3].isPeak && !extrema[i+4].isPeak && extrema[i+5].isPeak) { //--- Check sequence: peak (head), trough, peak (RS)
         double leftShoulder = extrema[i+1].price;                       //--- Get price of left shoulder
         double head = extrema[i+3].price;                               //--- Get price of head
         double rightShoulder = extrema[i+5].price;                      //--- Get price of right shoulder
         double trough1 = extrema[i+2].price;                            //--- Get price of first trough (neckline start)
         double trough2 = extrema[i+4].price;                            //--- Get price of second trough (neckline end)

         bool isHeadHighest = true;                                      //--- Flag to verify head is the highest peak in range
         for (int j = MathMax(0, i - 5); j < MathMin(size, i + 10); j++) { //--- Check surrounding bars (5 before, 10 after) for higher peaks
            if (extrema[j].isPeak && extrema[j].price > head && j != i + 3) { //--- If another peak is higher than head
               isHeadHighest = false;                                    //--- Set flag to false
               break;                                                    //--- Exit loop as head is not highest
            }
         }

         int lsBar = extrema[i+1].bar;                                   //--- Get bar index of left shoulder
         int headBar = extrema[i+3].bar;                                 //--- Get bar index of head
         int rsBar = extrema[i+5].bar;                                   //--- Get bar index of right shoulder
         int lsToHead = lsBar - headBar;                                 //--- Calculate bars from left shoulder to head
         int headToRs = headBar - rsBar;                                 //--- Calculate bars from head to right shoulder

         if (lsToHead < MinBarRange || lsToHead > MaxBarRange || headToRs < MinBarRange || headToRs > MaxBarRange) continue; //--- Skip if bar ranges are out of bounds

         int minRange = MathMin(lsToHead, headToRs);                     //--- Get the smaller of the two ranges for uniformity check
         if (lsToHead > minRange * BarRangeMultiplier || headToRs > minRange * BarRangeMultiplier) continue; //--- Skip if ranges exceed uniformity multiplier

         bool rsValid = false;                                           //--- Flag to validate right shoulder breakout
         int rsBarIndex = extrema[i+5].bar;                              //--- Get bar index of right shoulder for validation
         for (int j = rsBarIndex - 1; j >= MathMax(0, rsBarIndex - ValidationBars); j--) { //--- Check bars after right shoulder for breakout
            if (iLow(_Symbol, _Period, j) < rightShoulder - ThresholdPoints * _Point) { //--- Check if price drops below RS by threshold
               rsValid = true;                                           //--- Set flag to true if breakout confirmed
               break;                                                    //--- Exit loop once breakout is validated
            }
         }
         if (!rsValid) continue;                                         //--- Skip if right shoulder breakout not validated

         if (isHeadHighest && head > leftShoulder && head > rightShoulder && //--- Verify head is highest and above shoulders
             MathAbs(leftShoulder - rightShoulder) < ShoulderTolerancePoints * _Point && //--- Check shoulder price difference within tolerance
             MathAbs(trough1 - trough2) < TroughTolerancePoints * _Point) { //--- Check trough price difference within tolerance
            leftShoulderIdx = i + 1;                                     //--- Set index for left shoulder
            headIdx = i + 3;                                             //--- Set index for head
            rightShoulderIdx = i + 5;                                    //--- Set index for right shoulder
            necklineStartIdx = i + 2;                                    //--- Set index for neckline start (first trough)
            necklineEndIdx = i + 4;                                      //--- Set index for neckline end (second trough)
            Print("Bar Ranges: LS to Head = ", lsToHead, ", Head to RS = ", headToRs); //--- Log bar ranges for debugging
            return true;                                                 //--- Return true to indicate pattern found
         }
      }
   }
   return false;                                                         //--- Return false if no pattern detected
}
ここでは、DetectHeadAndShoulders関数を使って標準的な三尊天井パターンを検出します。この関数はextrema配列を調べ、谷、左肩(ピーク)、谷、頭(ピーク)、谷、右肩(ピーク)の6点の有効なシーケンスを探します。ArraySize関数で少なくとも6エントリーがあることを確認し、extrema配列のサイズをsizeとしたときに、末尾から数えて6つ前(つまり、size - 6)を開始点としてループを降順に回し、谷とピークが交互に並ぶパターンを検証します。次に、左肩、頭、右肩、そしてネックラインを構成する谷(trough1、trough2)の価格を抽出します。ネストしたループでMathMax関数とMathMin関数を用い、頭が指定範囲内で最も高い肩であることを確認します。また、各ポイント間のバーの距離はMinBarRangeとMaxBarRangeで制限し、BarRangeMultiplierで距離の均一性もチェックします。
右肩のブレイクアウトは、iLow関数でValidationBars期間内の価格がThresholdPointsを超えるかどうかで判定し、頭が両肩より高く、ShoulderTolerancePointsやTroughTolerancePointsなどの許容誤差を満たしている場合に、leftShoulderIdx(左肩のインデックス)、headIdx(頭のインデックス)、necklineStartIdx(ネックライン開始のインデックス)を設定します。Print関数でバーの範囲をログに記録し、パターンが検出された場合はtrueを返し、そうでなければfalseを返します。同様のロジックで逆三尊天井パターンも検出します。
//+------------------------------------------------------------------+
//| Detect inverse Head and Shoulders pattern                        |
//+------------------------------------------------------------------+
bool DetectInverseHeadAndShoulders(Extremum &extrema[], int &leftShoulderIdx, int &headIdx, int &rightShoulderIdx, int &necklineStartIdx, int &necklineEndIdx) { //--- Function to detect inverse H&S pattern
   int size = ArraySize(extrema);                                        //--- Get the size of the extrema array
   if (size < 6) return false;                                           //--- Return false if insufficient extrema for pattern (need at least 6 points)

   for (int i = size - 6; i >= 0; i--) {                                 //--- Loop through extrema to find inverse H&S pattern
      if (extrema[i].isPeak && !extrema[i+1].isPeak && extrema[i+2].isPeak && //--- Check sequence: peak, trough (LS), peak
          !extrema[i+3].isPeak && extrema[i+4].isPeak && !extrema[i+5].isPeak) { //--- Check sequence: trough (head), peak, trough (RS)
         double leftShoulder = extrema[i+1].price;                       //--- Get price of left shoulder
         double head = extrema[i+3].price;                               //--- Get price of head
         double rightShoulder = extrema[i+5].price;                      //--- Get price of right shoulder
         double peak1 = extrema[i+2].price;                              //--- Get price of first peak (neckline start)
         double peak2 = extrema[i+4].price;                              //--- Get price of second peak (neckline end)

         bool isHeadLowest = true;                                       //--- Flag to verify head is the lowest trough in range
         int headBar = extrema[i+3].bar;                                 //--- Get bar index of head for range check
         for (int j = MathMax(0, headBar - 5); j <= MathMin(Bars(_Symbol, _Period) - 1, headBar + 5); j++) { //--- Check 5 bars before and after head
            if (iLow(_Symbol, _Period, j) < head) {                      //--- If any low is below head
               isHeadLowest = false;                                     //--- Set flag to false
               break;                                                    //--- Exit loop as head is not lowest
            }
         }

         int lsBar = extrema[i+1].bar;                                   //--- Get bar index of left shoulder
         int rsBar = extrema[i+5].bar;                                   //--- Get bar index of right shoulder
         int lsToHead = lsBar - headBar;                                 //--- Calculate bars from left shoulder to head
         int headToRs = headBar - rsBar;                                 //--- Calculate bars from head to right shoulder

         if (lsToHead < MinBarRange || lsToHead > MaxBarRange || headToRs < MinBarRange || headToRs > MaxBarRange) continue; //--- Skip if bar ranges are out of bounds

         int minRange = MathMin(lsToHead, headToRs);                     //--- Get the smaller of the two ranges for uniformity check
         if (lsToHead > minRange * BarRangeMultiplier || headToRs > minRange * BarRangeMultiplier) continue; //--- Skip if ranges exceed uniformity multiplier

         bool rsValid = false;                                           //--- Flag to validate right shoulder breakout
         int rsBarIndex = extrema[i+5].bar;                              //--- Get bar index of right shoulder for validation
         for (int j = rsBarIndex - 1; j >= MathMax(0, rsBarIndex - ValidationBars); j--) { //--- Check bars after right shoulder for breakout
            if (iHigh(_Symbol, _Period, j) > rightShoulder + ThresholdPoints * _Point) { //--- Check if price rises above RS by threshold
               rsValid = true;                                           //--- Set flag to true if breakout confirmed
               break;                                                    //--- Exit loop once breakout is validated
            }
         }
         if (!rsValid) continue;                                         //--- Skip if right shoulder breakout not validated

         if (isHeadLowest && head < leftShoulder && head < rightShoulder && //--- Verify head is lowest and below shoulders
             MathAbs(leftShoulder - rightShoulder) < ShoulderTolerancePoints * _Point && //--- Check shoulder price difference within tolerance
             MathAbs(peak1 - peak2) < TroughTolerancePoints * _Point) { //--- Check peak price difference within tolerance
            leftShoulderIdx = i + 1;                                     //--- Set index for left shoulder
            headIdx = i + 3;                                             //--- Set index for head
            rightShoulderIdx = i + 5;                                    //--- Set index for right shoulder
            necklineStartIdx = i + 2;                                    //--- Set index for neckline start (first peak)
            necklineEndIdx = i + 4;                                      //--- Set index for neckline end (second peak)
            Print("Bar Ranges: LS to Head = ", lsToHead, ", Head to RS = ", headToRs); //--- Log bar ranges for debugging
            return true;                                                 //--- Return true to indicate pattern found
         }
      }
   }
   return false;                                                         //--- Return false if no pattern detected
}
逆三尊天井パターンを検出するために、DetectInverseHeadAndShoulders関数を定義します。この関数はextrema配列を調べ、ピーク、左肩(谷)、ピーク、頭(谷)、ピーク、右肩(谷)の6点のシーケンスを探します。ArraySize関数で少なくとも6エントリーがあることを確認し、extrema配列のサイズをsizeとしたときに、末尾から数えて6つ前(つまり、size - 6)を開始点としてループを降順に回し、ピークと谷が交互に並ぶパターンを検証します。次に、左肩、頭、右肩、およびネックラインを構成するピーク(peak1、peak2)の価格を抽出します。ネストしたループでMathMax、MathMin、iLow各関数を使い、headBar周辺5バーの範囲内で頭が最も低い谷であることを確認します。また、Bars関数でチャートの範囲内に収まっているかもチェックします。
バー間の距離はMinBarRangeとMaxBarRangeで制限し、MathMin関数とBarRangeMultiplierで距離の均一性も計算します。右肩のブレイクアウトは、iHigh関数を使ってValidationBars期間内に価格がThresholdPointsを超えているかで判定し、頭が両肩より低く、ShoulderTolerancePointsやTroughTolerancePointsの許容範囲を満たす場合に、leftShoulderIdxやnecklineStartIdxなどのインデックスを設定します。バー範囲はログにPrint関数で出力し、パターン検出成功時はtrueを返し、失敗時はfalseを返します。これでこの2つの関数を用いて、以下のようにパターンを検出していくことが可能になります。
int leftShoulderIdx, headIdx, rightShoulderIdx, necklineStartIdx, necklineEndIdx; //--- Indices for pattern components

// Standard Head and Shoulders (Sell)
if (DetectHeadAndShoulders(extrema, leftShoulderIdx, headIdx, rightShoulderIdx, necklineStartIdx, necklineEndIdx)) { //--- Check for standard H&S pattern
   double closePrice = iClose(_Symbol, _Period, 1);                   //--- Get the closing price of the previous bar
   double necklinePrice = extrema[necklineEndIdx].price;              //--- Get the price of the neckline end point

   if (closePrice < necklinePrice) {                                  //--- Check if price has broken below the neckline (sell signal)
      datetime lsTime = extrema[leftShoulderIdx].time;                //--- Get the timestamp of the left shoulder
      double lsPrice = extrema[leftShoulderIdx].price;                //--- Get the price of the left shoulder

      //---
   }
}
ここでは、パターンの構成要素のインデックスを格納するために、leftShoulderIdx、headIdx、rightShoulderIdx、necklineStartIdx、necklineEndIdxという変数を宣言します。その後、DetectHeadAndShoulders関数を使ってextrema配列内に標準的な三尊天井パターンがあるかどうかを確認し、これらのインデックスを参照渡しで受け取ります。パターンが検出された場合は、iClose関数で1つ前のバーの終値をclosePriceとして取得し、extrema[necklineEndIdx].priceからnecklinePriceを取得します。そして、closePriceがnecklinePriceを下回っているかどうかを確認し、トリガーの判定をおこないます。さらに、leftShoulderIdxに対応するextremaの時間と価格をlsTime、lsPriceとして取得し、左肩の位置を元に取引実行の準備をします。この時点で、既に同じパターンが取引されていないかを確認するための関数が必要なため、定義します。
//+------------------------------------------------------------------+
//| Check if pattern has already been traded                         |
//+------------------------------------------------------------------+
bool IsPatternTraded(datetime lsTime, double lsPrice) {                  //--- Function to check if a pattern has already been traded
   int size = ArraySize(tradedPatterns);                                 //--- Get the current size of the tradedPatterns array
   for (int i = 0; i < size; i++) {                                      //--- Loop through all stored traded patterns
      if (tradedPatterns[i].leftShoulderTime == lsTime &&                //--- Check if left shoulder time matches
          MathAbs(tradedPatterns[i].leftShoulderPrice - lsPrice) < PriceTolerance * _Point) { //--- Check if left shoulder price is within tolerance
         Print("Pattern already traded: Left Shoulder Time ", TimeToString(lsTime), ", Price ", DoubleToString(lsPrice, _Digits)); //--- Log that pattern was previously traded
         return true;                                                    //--- Return true to indicate pattern has been traded
      }
   }
   return false;                                                         //--- Return false if no match found
}
ここでは、lsTimeとlsPriceで特定されるパターンがすでにtradedPatterns配列に存在するかを確認するIsPatternTraded関数を実装し、重複取引を防ぎます。まず、ArraySize関数で配列のサイズを取得し、そのサイズ分ループを回して各要素のleftShoulderTimeとlsTime、leftShoulderPriceとlsPriceをMathAbs関数を使ってPriceToleranceの範囲内で比較します。一致するものがあれば、Print関数でTimeToStringやDoubleToStringを用いて読みやすくログ出力し、trueを返して重複を示します。一致がなければfalseを返し、新規取引を許可します。この関数を呼び出してチェックをおこない、重複がなければ処理を続行します。
if (IsPatternTraded(lsTime, lsPrice)) return;                   //--- Exit if this pattern has already been traded

datetime breakoutTime = iTime(_Symbol, _Period, 1);             //--- Get the timestamp of the breakout bar (previous bar)
int lsBar = extrema[leftShoulderIdx].bar;                       //--- Get the bar index of the left shoulder
int headBar = extrema[headIdx].bar;                             //--- Get the bar index of the head
int rsBar = extrema[rightShoulderIdx].bar;                      //--- Get the bar index of the right shoulder
int necklineStartBar = extrema[necklineStartIdx].bar;           //--- Get the bar index of the neckline start
int necklineEndBar = extrema[necklineEndIdx].bar;               //--- Get the bar index of the neckline end
int breakoutBar = 1;                                            //--- Set breakout bar index (previous bar)

int lsToHead = lsBar - headBar;                                 //--- Calculate number of bars from left shoulder to head
int headToRs = headBar - rsBar;                                 //--- Calculate number of bars from head to right shoulder
int rsToBreakout = rsBar - breakoutBar;                         //--- Calculate number of bars from right shoulder to breakout
int lsToNeckStart = lsBar - necklineStartBar;                   //--- Calculate number of bars from left shoulder to neckline start
double avgPatternRange = (lsToHead + headToRs) / 2.0;           //--- Calculate average bar range of the pattern for uniformity check

if (rsToBreakout > avgPatternRange * RightShoulderBreakoutMultiplier) { //--- Check if breakout distance exceeds allowed range
   Print("Pattern rejected: Right Shoulder to Breakout (", rsToBreakout,
         ") exceeds ", RightShoulderBreakoutMultiplier, "x average range (", avgPatternRange, ")"); //--- Log rejection due to excessive breakout range
   return;                                                      //--- Exit function if pattern is invalid
}

double necklineStartPrice = extrema[necklineStartIdx].price;    //--- Get the price of the neckline start point
double necklineEndPrice = extrema[necklineEndIdx].price;        //--- Get the price of the neckline end point
datetime necklineStartTime = extrema[necklineStartIdx].time;    //--- Get the timestamp of the neckline start point
datetime necklineEndTime = extrema[necklineEndIdx].time;        //--- Get the timestamp of the neckline end point
int barDiff = necklineStartBar - necklineEndBar;                //--- Calculate bar difference between neckline points for slope
double slope = (necklineEndPrice - necklineStartPrice) / barDiff; //--- Calculate the slope of the neckline (price change per bar)
double breakoutNecklinePrice = necklineStartPrice + slope * (necklineStartBar - breakoutBar); //--- Calculate neckline price at breakout point

// Extend neckline backwards
int extendedBar = necklineStartBar;                             //--- Initialize extended bar index with neckline start
datetime extendedNecklineStartTime = necklineStartTime;         //--- Initialize extended neckline start time
double extendedNecklineStartPrice = necklineStartPrice;         //--- Initialize extended neckline start price
bool foundCrossing = false;                                     //--- Flag to track if neckline crosses a bar within range

for (int i = necklineStartBar + 1; i < Bars(_Symbol, _Period); i++) { //--- Loop through bars to extend neckline backwards
   double checkPrice = necklineStartPrice - slope * (i - necklineStartBar); //--- Calculate projected neckline price at bar i
   if (NecklineCrossesBar(checkPrice, i)) {                     //--- Check if neckline intersects the bar's high-low range
      int distance = i - necklineStartBar;                      //--- Calculate distance from neckline start to crossing bar
      if (distance <= avgPatternRange * RightShoulderBreakoutMultiplier) { //--- Check if crossing is within uniformity range
         extendedBar = i;                                       //--- Update extended bar index
         extendedNecklineStartTime = iTime(_Symbol, _Period, i); //--- Update extended neckline start time
         extendedNecklineStartPrice = checkPrice;              //--- Update extended neckline start price
         foundCrossing = true;                                  //--- Set flag to indicate crossing found
         Print("Neckline extended to first crossing bar within uniformity: Bar ", extendedBar); //--- Log successful extension
         break;                                                 //--- Exit loop after finding valid crossing
      } else {                                                  //--- If crossing exceeds uniformity range
         Print("Crossing bar ", i, " exceeds uniformity (", distance, " > ", avgPatternRange * RightShoulderBreakoutMultiplier, ")"); //--- Log rejection of crossing
         break;                                                 //--- Exit loop as crossing is too far
      }
   }
}

if (!foundCrossing) {                                           //--- If no valid crossing found within range
   int barsToExtend = 2 * lsToNeckStart;                        //--- Set fallback extension distance as twice LS to neckline start
   extendedBar = necklineStartBar + barsToExtend;               //--- Calculate extended bar index
   if (extendedBar >= Bars(_Symbol, _Period)) extendedBar = Bars(_Symbol, _Period) - 1; //--- Cap extended bar at total bars if exceeded
   extendedNecklineStartTime = iTime(_Symbol, _Period, extendedBar); //--- Update extended neckline start time
   extendedNecklineStartPrice = necklineStartPrice - slope * (extendedBar - necklineStartBar); //--- Update extended neckline start price
   Print("Neckline extended to fallback (2x LS to Neckline Start): Bar ", extendedBar, " (no crossing within uniformity)"); //--- Log fallback extension
}

Print("Standard Head and Shoulders Detected:");                 //--- Log detection of standard H&S pattern
Print("Left Shoulder: Bar ", lsBar, ", Time ", TimeToString(lsTime), ", Price ", DoubleToString(lsPrice, _Digits)); //--- Log left shoulder details
Print("Head: Bar ", headBar, ", Time ", TimeToString(extrema[headIdx].time), ", Price ", DoubleToString(extrema[headIdx].price, _Digits)); //--- Log head details
Print("Right Shoulder: Bar ", rsBar, ", Time ", TimeToString(extrema[rightShoulderIdx].time), ", Price ", DoubleToString(extrema[rightShoulderIdx].price, _Digits)); //--- Log right shoulder details
Print("Neckline Start: Bar ", necklineStartBar, ", Time ", TimeToString(necklineStartTime), ", Price ", DoubleToString(necklineStartPrice, _Digits)); //--- Log neckline start details
Print("Neckline End: Bar ", necklineEndBar, ", Time ", TimeToString(necklineEndTime), ", Price ", DoubleToString(necklineEndPrice, _Digits)); //--- Log neckline end details
Print("Close Price: ", DoubleToString(closePrice, _Digits));    //--- Log closing price at breakout
Print("Breakout Time: ", TimeToString(breakoutTime));           //--- Log breakout timestamp
Print("Neckline Price at Breakout: ", DoubleToString(breakoutNecklinePrice, _Digits)); //--- Log neckline price at breakout
Print("Extended Neckline Start: Bar ", extendedBar, ", Time ", TimeToString(extendedNecklineStartTime), ", Price ", DoubleToString(extendedNecklineStartPrice, _Digits)); //--- Log extended neckline start details
Print("Bar Ranges: LS to Head = ", lsToHead, ", Head to RS = ", headToRs, ", RS to Breakout = ", rsToBreakout, ", LS to Neckline Start = ", lsToNeckStart); //--- Log bar ranges for pattern analysis
ここでは、検出した三尊天井パターンの検証と売りエントリーの準備をおこないます。まず、IsPatternTraded関数を使い、lsTimeとlsPriceがtradedPatterns内の過去の取引と一致するかどうかを確認し、一致する場合は重複を避けるため処理を終了します。次に、iTime関数でbreakoutTimeを一つ前のバーのタイムスタンプとして取得し、extrema配列からlsBar(左肩)、headBar(頭)、rsBar(右肩)、necklineStartBar(ネックライン開始)、necklineEndBar(ネックライン終了)のバー番号を取得します。そして、lsToHead、headToRs、rsToBreakoutといったバー間の距離を計算します。rsToBreakoutがavgPatternRangeにRightShoulderBreakoutMultiplierを掛けた値を超えていた場合、そのパターンは拒否され、Print関数でログに記録されます。
次に、ネックラインの傾きを、necklineStartPriceとnecklineEndPriceの価格差をbarDiffで割って求めます。さらにbreakoutNecklinePriceを計算し、ループを使ってネックラインを過去方向へ延長します。NecklineCrossesBar関数でavgPatternRangeとRightShoulderBreakoutMultiplierの積以内に交差があるかどうかを探し、見つかった場合はextendedBar、extendedNecklineStartTime(iTimeで取得)、extendedNecklineStartPriceを更新します。交差が見つからなかった場合、2倍のlsToNeckStartを使い、Barsの総数を上限として設定します。最後に、バー番号や価格、距離といったすべての詳細をPrint関数やTimeToString、DoubleToString関数でログ出力し、処理を詳細に記録します。以下に、このカスタム関数のコードスニペットを示します。
//+------------------------------------------------------------------+
//| Check if neckline crosses a bar's high-low range                 |
//+------------------------------------------------------------------+
bool NecklineCrossesBar(double necklinePrice, int barIndex) {            //--- Function to check if neckline price intersects a bar's range
   double high = iHigh(_Symbol, _Period, barIndex);                      //--- Get the high price of the specified bar
   double low = iLow(_Symbol, _Period, barIndex);                        //--- Get the low price of the specified bar
   return (necklinePrice >= low && necklinePrice <= high);               //--- Return true if neckline price is within bar's high-low range
}
関数はnecklinePriceがbarIndexで指定されたバーの価格レンジと交差しているかを確認し、ネックラインの正確な延長を保証します。具体的には、iHigh関数でバーの高値を取得し、iLow関数で安値を取得した後、necklinePriceがその安値と高値の間にあればtrueを返し、ネックラインがバーの価格範囲を横切っていることを示してパターン検証に役立てます。パターンの検証が完了したら、チャート上にそれを可視化します。そのために描画やラベル表示用の関数が必要になります。
//+------------------------------------------------------------------+
//| Draw a trend line for visualization                              |
//+------------------------------------------------------------------+
void DrawTrendLine(string name, datetime timeStart, double priceStart, datetime timeEnd, double priceEnd, color lineColor, int width, int style) { //--- Function to draw a trend line on the chart
   if (ObjectCreate(0, name, OBJ_TREND, 0, timeStart, priceStart, timeEnd, priceEnd)) { //--- Create a trend line object if possible
      ObjectSetInteger(0, name, OBJPROP_COLOR, lineColor);               //--- Set the color of the trend line
      ObjectSetInteger(0, name, OBJPROP_STYLE, style);                   //--- Set the style (e.g., solid, dashed) of the trend line
      ObjectSetInteger(0, name, OBJPROP_WIDTH, width);                   //--- Set the width of the trend line
      ObjectSetInteger(0, name, OBJPROP_BACK, true);                     //--- Set the line to draw behind chart elements
      ChartRedraw();                                                     //--- Redraw the chart to display the new line
   } else {                                                              //--- If line creation fails
      Print("Failed to create line: ", name, ". Error: ", GetLastError()); //--- Log the error with the object name and error code
   }
}

//+------------------------------------------------------------------+
//| Draw a filled triangle for visualization                         |
//+------------------------------------------------------------------+
void DrawTriangle(string name, datetime time1, double price1, datetime time2, double price2, datetime time3, double price3, color fillColor) { //--- Function to draw a filled triangle on the chart
   if (ObjectCreate(0, name, OBJ_TRIANGLE, 0, time1, price1, time2, price2, time3, price3)) { //--- Create a triangle object if possible
      ObjectSetInteger(0, name, OBJPROP_COLOR, fillColor);               //--- Set the fill color of the triangle
      ObjectSetInteger(0, name, OBJPROP_STYLE, STYLE_SOLID);             //--- Set the border style to solid
      ObjectSetInteger(0, name, OBJPROP_WIDTH, 1);                       //--- Set the border width to 1 pixel
      ObjectSetInteger(0, name, OBJPROP_FILL, true);                     //--- Enable filling of the triangle
      ObjectSetInteger(0, name, OBJPROP_BACK, true);                     //--- Set the triangle to draw behind chart elements
      ChartRedraw();                                                     //--- Redraw the chart to display the new triangle
   } else {                                                              //--- If triangle creation fails
      Print("Failed to create triangle: ", name, ". Error: ", GetLastError()); //--- Log the error with the object name and error code
   }
}

//+------------------------------------------------------------------+
//| Draw text label for visualization                                |
//+------------------------------------------------------------------+
void DrawText(string name, datetime time, double price, string text, color textColor, bool above, double angle = 0) { //--- Function to draw a text label on the chart
   int chartscale = (int)ChartGetInteger(0, CHART_SCALE);                //--- Get the current chart zoom level
   int dynamicFontSize = 5 + int(chartscale * 1.5);                      //--- Calculate font size based on zoom level for visibility
   double priceOffset = (above ? 10 : -10) * _Point;                     //--- Set price offset above or below the point for readability
   if (ObjectCreate(0, name, OBJ_TEXT, 0, time, price + priceOffset)) {  //--- Create a text object if possible
      ObjectSetString(0, name, OBJPROP_TEXT, text);                      //--- Set the text content of the label
      ObjectSetInteger(0, name, OBJPROP_COLOR, textColor);               //--- Set the color of the text
      ObjectSetInteger(0, name, OBJPROP_FONTSIZE, dynamicFontSize);      //--- Set the font size based on chart scale
      ObjectSetInteger(0, name, OBJPROP_ANCHOR, ANCHOR_CENTER);          //--- Center the text at the specified point
      ObjectSetDouble(0, name, OBJPROP_ANGLE, angle);                    //--- Set the rotation angle of the text in degrees
      ObjectSetInteger(0, name, OBJPROP_BACK, false);                    //--- Set the text to draw in front of chart elements
      ChartRedraw();                                                     //--- Redraw the chart to display the new text
      Print("Text created: ", name, ", Angle: ", DoubleToString(angle, 2)); //--- Log successful creation of the text with its angle
   } else {                                                              //--- If text creation fails
      Print("Failed to create text: ", name, ". Error: ", GetLastError()); //--- Log the error with the object name and error code
   }
}
ここでは、チャート上でパターンを強調表示するために描画機能を充実させます。まず、DrawTrendLine関数を使い、ObjectCreate関数でtimeStart・priceStartからtimeEnd・priceEndまでのラインを描画します。その後、ObjectSetInteger関数でlineColor(線の色)、style(スタイル)、width(幅)などのプロパティを設定し、OBJPROP_BACKを使ってバーの背後に表示させます。さらにChartRedraw関数で描画を更新し、失敗した場合はPrint関数とGetLastError関数でエラー内容をログ出力します。
続いて、DrawTriangle関数を実装し、パターンの構造を塗りつぶして視覚的に強調します。ObjectCreate関数を使って、time1・price1、time2・price2、time3・price3の3点を指定して三角形を作成し、ObjectSetIntegerでfillColor(塗りつぶし色)と実線の境界線を設定します。OBJPROP_FILLを使って塗りつぶしを有効にし、チャートの背後に配置します。最後にChartRedraw関数で表示を更新し、作成に失敗した場合はPrint関数でエラーをログ出力します。
最後に、DrawText関数を追加し、パターンの重要ポイントにラベルを表示できるようにします。ChartGetInteger関数を使用してchartscale(チャートのズームレベル)に応じてdynamicFontSize(動的フォントサイズ)を調整し、ObjectCreate関数でtimeおよびpriceにオフセットを加えた位置にテキストを配置します。ObjectSetString関数で表示するテキストの内容を設定し、ObjectSetIntegerでtextColor(文字色)とFONTSIZE(フォントサイズ)を指定、さらにObjectSetDoubleでangle(角度)を設定してカスタマイズします。描画はチャートの前面におこない、ChartRedraw関数で表示を更新します。作成成功時にはPrint関数とDoubleToString関数で確認ログを出力し、失敗時にはエラーメッセージを記録します。これで描画機能が整ったため、視覚化機能を有効にするための関数呼び出しが可能になりました。最初におこなうのは、以下のようにラインを描画する処理です。
string prefix = "HS_" + TimeToString(extrema[headIdx].time, TIME_MINUTES); //--- Create unique prefix for chart objects based on head time
// Lines
DrawTrendLine(prefix + "_LeftToNeckStart", lsTime, lsPrice, necklineStartTime, necklineStartPrice, clrRed, 3, STYLE_SOLID); //--- Draw line from left shoulder to neckline start
DrawTrendLine(prefix + "_NeckStartToHead", necklineStartTime, necklineStartPrice, extrema[headIdx].time, extrema[headIdx].price, clrRed, 3, STYLE_SOLID); //--- Draw line from neckline start to head
DrawTrendLine(prefix + "_HeadToNeckEnd", extrema[headIdx].time, extrema[headIdx].price, necklineEndTime, necklineEndPrice, clrRed, 3, STYLE_SOLID); //--- Draw line from head to neckline end
DrawTrendLine(prefix + "_NeckEndToRight", necklineEndTime, necklineEndPrice, extrema[rightShoulderIdx].time, extrema[rightShoulderIdx].price, clrRed, 3, STYLE_SOLID); //--- Draw line from neckline end to right shoulder
DrawTrendLine(prefix + "_Neckline", extendedNecklineStartTime, extendedNecklineStartPrice, breakoutTime, breakoutNecklinePrice, clrBlue, 2, STYLE_SOLID); //--- Draw neckline from extended start to breakout
DrawTrendLine(prefix + "_RightToBreakout", extrema[rightShoulderIdx].time, extrema[rightShoulderIdx].price, breakoutTime, breakoutNecklinePrice, clrRed, 3, STYLE_SOLID); //--- Draw line from right shoulder to breakout
DrawTrendLine(prefix + "_ExtendedToLeftShoulder", extendedNecklineStartTime, extendedNecklineStartPrice, lsTime, lsPrice, clrRed, 3, STYLE_SOLID); //--- Draw line from extended neckline to left shoulder
ここでは、三尊天井パターンを視覚的にマッピングします。まず、headのタイムスタンプをTimeToString関数で文字列に変換し、それをもとにユニークなprefix(接頭辞)を作成します。次に、DrawTrendLine関数を使用して、左肩からネックラインの始点、ネックラインの始点から頭、頭からネックラインの終点、ネックラインの終点から右肩を、それぞれ赤色、幅3で描画します。さらに、ネックラインの延長開始点からブレイクアウトまでを青色、幅2で描画し、右肩からブレイクアウトへのライン、延長ネックラインの始点から左肩への戻りラインも赤色、幅3で描きます。すべてのラインは実線スタイルで、チャート上にパターン全体の構造を明確に表示します。コンパイルすると、次の結果が得られます。

三角形を追加するには、DrawTriangle関数を使用します。技術的には、この三角形は肩と頭の内部に構成されます。
// Triangles
DrawTriangle(prefix + "_LeftShoulderTriangle", lsTime, lsPrice, necklineStartTime, necklineStartPrice, extendedNecklineStartTime, extendedNecklineStartPrice, clrLightCoral); //--- Draw triangle for left shoulder area
DrawTriangle(prefix + "_HeadTriangle", extrema[headIdx].time, extrema[headIdx].price, necklineStartTime, necklineStartPrice, necklineEndTime, necklineEndPrice, clrLightCoral); //--- Draw triangle for head area
DrawTriangle(prefix + "_RightShoulderTriangle", extrema[rightShoulderIdx].time, extrema[rightShoulderIdx].price, necklineEndTime, necklineEndPrice, breakoutTime, breakoutNecklinePrice, clrLightCoral); //--- Draw triangle for right shoulder area
ここでは、DrawTriangle関数を使って視覚表現を強化し、重要な領域をライトコーラルで塗りつぶしてパターン構造を明確に示します。左肩の三角形は、左肩のポイントからネックラインの始点、そして延長されたネックラインの始点へと構成され、頭の三角形は、頭からネックラインの始点と終点に向けて構成されます。さらに、右肩の三角形は、右肩のポイントからネックラインの終点、そしてブレイクアウトポイントへと構成されます。これらの三角形によって、チャート上に三尊天井パターンの構造が視覚的に強調され、識別しやすくなります。コンパイルすると、次の結果が得られます。

最後に、パターンにラベルを追加することで、視覚的にわかりやすく、自己説明的な表示を完成させます。
// Text Labels
DrawText(prefix + "_LS_Label", lsTime, lsPrice, "LS", clrRed, true); //--- Draw "LS" label above left shoulder
DrawText(prefix + "_Head_Label", extrema[headIdx].time, extrema[headIdx].price, "HEAD", clrRed, true); //--- Draw "HEAD" label above head
DrawText(prefix + "_RS_Label", extrema[rightShoulderIdx].time, extrema[rightShoulderIdx].price, "RS", clrRed, true); //--- Draw "RS" label above right shoulder
datetime necklineMidTime = extendedNecklineStartTime + (breakoutTime - extendedNecklineStartTime) / 2; //--- Calculate midpoint time of the neckline
double necklineMidPrice = extendedNecklineStartPrice + slope * (iBarShift(_Symbol, _Period, extendedNecklineStartTime) - iBarShift(_Symbol, _Period, necklineMidTime)); //--- Calculate midpoint price of the neckline
// Calculate angle in pixel space
int x1 = ShiftToX(iBarShift(_Symbol, _Period, extendedNecklineStartTime)); //--- Convert extended neckline start to x-pixel coordinate
int y1 = PriceToY(extendedNecklineStartPrice);                          //--- Convert extended neckline start price to y-pixel coordinate
int x2 = ShiftToX(iBarShift(_Symbol, _Period, breakoutTime));           //--- Convert breakout time to x-pixel coordinate
int y2 = PriceToY(breakoutNecklinePrice);                               //--- Convert breakout price to y-pixel coordinate
double pixelSlope = (y2 - y1) / (double)(x2 - x1);                     //--- Calculate slope in pixel space (rise over run)
double necklineAngle = -atan(pixelSlope) * 180 / M_PI;                  //--- Calculate neckline angle in degrees, negated for visual alignment
Print("Pixel X1: ", x1, ", Y1: ", y1, ", X2: ", x2, ", Y2: ", y2, ", Pixel Slope: ", DoubleToString(pixelSlope, 4), ", Neckline Angle: ", DoubleToString(necklineAngle, 2)); //--- Log pixel coordinates and angle
DrawText(prefix + "_Neckline_Label", necklineMidTime, necklineMidPrice, "NECKLINE", clrBlue, false, necklineAngle); //--- Draw "NECKLINE" label at midpoint with calculated angle
最後に、DrawText関数を使用してパターンに注釈を加えます。具体的には、左肩、頭、右肩の各ポイントに対応する時刻と価格に、赤色の「LS」「HEAD」「RS」というラベルをそれぞれ上方に配置し、チャートの視認性を向上させます。次に、ネックラインの中央位置を決定するために、extendedNecklineStartTimeとbreakoutTimeの平均を取り、necklineMidTimeを算出します。また、iBarShift関数を使ってこれらの時刻間のバー数を取得し、slopeを掛けてextendedNecklineStartPriceに加算し、necklineMidPriceを求めます。このラベルをネックラインの傾きに沿わせるため、ShiftToX関数でextendedNecklineStartTimeとbreakoutTimeをxピクセルに、PriceToY関数でそれぞれの価格をyピクセルに変換し、pixelSlopeを算出します。さらに、atan関数とM_PIを使って傾きをnecklineAngle(角度)に変換し、DoubleToString関数でPrint出力し、計算結果を確認します。
最後に、DrawText関数でblueの「NECKLINE」ラベルをnecklineMidTime・necklineMidPriceに表示し、位置は下方に配置しつつ、necklineAngleで回転させることで、ネックラインの傾きに沿った自然な表示を実現します。以下はその結果です。

画像から、パターンが完全に可視化されていることがわかります。次にブレイクアウトを検出する必要があります。つまり、延長されたラインを基準にして、売りポジションを建て、そのブレイクアウトバーに合わせて延長範囲を修正します。簡単です。次のロジックを通じてそれを実現します。
double entryPrice = 0;                                                  //--- Set entry price to 0 for market order (uses current price)
double sl = extrema[rightShoulderIdx].price + BufferPoints * _Point;    //--- Calculate stop-loss above right shoulder with buffer
double patternHeight = extrema[headIdx].price - necklinePrice;          //--- Calculate pattern height from head to neckline
double tp = closePrice - patternHeight;                                 //--- Calculate take-profit below close by pattern height
if (sl > closePrice && tp < closePrice) {                               //--- Validate trade direction (SL above, TP below for sell)
   if (obj_Trade.Sell(LotSize, _Symbol, entryPrice, sl, tp, "Head and Shoulders")) { //--- Attempt to open a sell trade
      AddTradedPattern(lsTime, lsPrice);                                //--- Add pattern to traded list
      Print("Sell Trade Opened: SL ", DoubleToString(sl, _Digits), ", TP ", DoubleToString(tp, _Digits)); //--- Log successful trade opening
   }
}
パターンが確認されたら、entryPriceを0に設定して成行で売り注文を実行します。slは右肩の価格にBufferPointsを加えた位置に設定し、patternHeightはヘッドとネックラインの価格差として計算します。そしてtpはclosePriceからpatternHeightを引いた位置に設定します。
売り方向の成立条件として、slがclosePriceより上、tpが下であることを確認した上で、LotSize、sl、tp、コメントを指定してobj_TradeのSell関数を使って注文を出します。実行が成功した場合、lsTimeとlsPriceを使ってAddTradedPattern関数を呼び出してパターンを記録し、slとtpの詳細をDoubleToStringを使ってPrint関数で出力します。このカスタム関数でパターンを処理済みとしてマークするコードスニペットは以下の通りです。
//+------------------------------------------------------------------+
//| Add pattern to traded list with size management                  |
//+------------------------------------------------------------------+
void AddTradedPattern(datetime lsTime, double lsPrice) {                 //--- Function to add a new traded pattern to the list
   int size = ArraySize(tradedPatterns);                                 //--- Get the current size of the tradedPatterns array
   if (size >= MaxTradedPatterns) {                                      //--- Check if array size exceeds maximum allowed
      for (int i = 0; i < size - 1; i++) {                               //--- Shift all elements left to remove the oldest
         tradedPatterns[i] = tradedPatterns[i + 1];                      //--- Copy next element to current position
      }
      ArrayResize(tradedPatterns, size - 1);                            //--- Reduce array size by 1
      size--;                                                           //--- Decrement size variable
      Print("Removed oldest traded pattern to maintain max size of ", MaxTradedPatterns); //--- Log removal of oldest pattern
   }
   ArrayResize(tradedPatterns, size + 1);                                //--- Increase array size to add new pattern
   tradedPatterns[size].leftShoulderTime = lsTime;                       //--- Store the left shoulder time of the new pattern
   tradedPatterns[size].leftShoulderPrice = lsPrice;                     //--- Store the left shoulder price of the new pattern
   Print("Added traded pattern: Left Shoulder Time ", TimeToString(lsTime), ", Price ", DoubleToString(lsPrice, _Digits)); //--- Log addition of new pattern
}
AddTradedPattern関数は、エントリー済みのパターンを記録するために定義されています。この関数では、左肩の情報が再描画されない特性を利用し、lsTimeとlsPriceを使って左肩の時刻と価格を記録します。まず、ArraySize関数でtradedPatternsのサイズを確認します。サイズがMaxTradedPatternsに達している場合は、配列を左にシフトして最も古い要素を削除します。その後、ArrayResize関数を使って配列を縮小し、この操作をログに出力します。次に、新しい要素を追加するためにArrayResize関数で配列を再度拡張します。leftShoulderTimeにはlsTimeを、leftShoulderPriceにはlsPriceを設定します。この追加処理も、Print関数、 TimeToString関数、DoubleToString関数を使ってログに出力します。コンパイルすると、次の結果が得られます。

画像からわかるように、パターンを視覚化するだけでなく、それに基づいた売買も実行しています。逆三尊パターンの認識、表示、そして売買の操作は、通常の三尊パターンと同じロジックを逆方向に適用することで実現されています。以下がそのロジックです。
// Inverse Head and Shoulders (Buy)
if (DetectInverseHeadAndShoulders(extrema, leftShoulderIdx, headIdx, rightShoulderIdx, necklineStartIdx, necklineEndIdx)) { //--- Check for inverse H&S pattern
   double closePrice = iClose(_Symbol, _Period, 1);                   //--- Get the closing price of the previous bar
   double necklinePrice = extrema[necklineEndIdx].price;              //--- Get the price of the neckline end point

   if (closePrice > necklinePrice) {                                  //--- Check if price has broken above the neckline (buy signal)
      datetime lsTime = extrema[leftShoulderIdx].time;                //--- Get the timestamp of the left shoulder
      double lsPrice = extrema[leftShoulderIdx].price;                //--- Get the price of the left shoulder

      if (IsPatternTraded(lsTime, lsPrice)) return;                   //--- Exit if this pattern has already been traded

      datetime breakoutTime = iTime(_Symbol, _Period, 1);             //--- Get the timestamp of the breakout bar (previous bar)
      int lsBar = extrema[leftShoulderIdx].bar;                       //--- Get the bar index of the left shoulder
      int headBar = extrema[headIdx].bar;                             //--- Get the bar index of the head
      int rsBar = extrema[rightShoulderIdx].bar;                      //--- Get the bar index of the right shoulder
      int necklineStartBar = extrema[necklineStartIdx].bar;           //--- Get the bar index of the neckline start
      int necklineEndBar = extrema[necklineEndIdx].bar;               //--- Get the bar index of the neckline end
      int breakoutBar = 1;                                            //--- Set breakout bar index (previous bar)

      int lsToHead = lsBar - headBar;                                 //--- Calculate number of bars from left shoulder to head
      int headToRs = headBar - rsBar;                                 //--- Calculate number of bars from head to right shoulder
      int rsToBreakout = rsBar - breakoutBar;                         //--- Calculate number of bars from right shoulder to breakout
      int lsToNeckStart = lsBar - necklineStartBar;                   //--- Calculate number of bars from left shoulder to neckline start
      double avgPatternRange = (lsToHead + headToRs) / 2.0;           //--- Calculate average bar range of the pattern for uniformity check

      if (rsToBreakout > avgPatternRange * RightShoulderBreakoutMultiplier) { //--- Check if breakout distance exceeds allowed range
         Print("Pattern rejected: Right Shoulder to Breakout (", rsToBreakout,
               ") exceeds ", RightShoulderBreakoutMultiplier, "x average range (", avgPatternRange, ")"); //--- Log rejection due to excessive breakout range
         return;                                                      //--- Exit function if pattern is invalid
      }

      double necklineStartPrice = extrema[necklineStartIdx].price;    //--- Get the price of the neckline start point
      double necklineEndPrice = extrema[necklineEndIdx].price;        //--- Get the price of the neckline end point
      datetime necklineStartTime = extrema[necklineStartIdx].time;    //--- Get the timestamp of the neckline start point
      datetime necklineEndTime = extrema[necklineEndIdx].time;        //--- Get the timestamp of the neckline end point
      int barDiff = necklineStartBar - necklineEndBar;                //--- Calculate bar difference between neckline points for slope
      double slope = (necklineEndPrice - necklineStartPrice) / barDiff; //--- Calculate the slope of the neckline (price change per bar)
      double breakoutNecklinePrice = necklineStartPrice + slope * (necklineStartBar - breakoutBar); //--- Calculate neckline price at breakout point

      // Extend neckline backwards
      int extendedBar = necklineStartBar;                             //--- Initialize extended bar index with neckline start
      datetime extendedNecklineStartTime = necklineStartTime;         //--- Initialize extended neckline start time
      double extendedNecklineStartPrice = necklineStartPrice;         //--- Initialize extended neckline start price
      bool foundCrossing = false;                                     //--- Flag to track if neckline crosses a bar within range

      for (int i = necklineStartBar + 1; i < Bars(_Symbol, _Period); i++) { //--- Loop through bars to extend neckline backwards
         double checkPrice = necklineStartPrice - slope * (i - necklineStartBar); //--- Calculate projected neckline price at bar i
         if (NecklineCrossesBar(checkPrice, i)) {                     //--- Check if neckline intersects the bar's high-low range
            int distance = i - necklineStartBar;                      //--- Calculate distance from neckline start to crossing bar
            if (distance <= avgPatternRange * RightShoulderBreakoutMultiplier) { //--- Check if crossing is within uniformity range
               extendedBar = i;                                       //--- Update extended bar index
               extendedNecklineStartTime = iTime(_Symbol, _Period, i); //--- Update extended neckline start time
               extendedNecklineStartPrice = checkPrice;              //--- Update extended neckline start price
               foundCrossing = true;                                  //--- Set flag to indicate crossing found
               Print("Neckline extended to first crossing bar within uniformity: Bar ", extendedBar); //--- Log successful extension
               break;                                                 //--- Exit loop after finding valid crossing
            } else {                                                  //--- If crossing exceeds uniformity range
               Print("Crossing bar ", i, " exceeds uniformity (", distance, " > ", avgPatternRange * RightShoulderBreakoutMultiplier, ")"); //--- Log rejection of crossing
               break;                                                 //--- Exit loop as crossing is too far
            }
         }
      }

      if (!foundCrossing) {                                           //--- If no valid crossing found within range
         int barsToExtend = 2 * lsToNeckStart;                        //--- Set fallback extension distance as twice LS to neckline start
         extendedBar = necklineStartBar + barsToExtend;               //--- Calculate extended bar index
         if (extendedBar >= Bars(_Symbol, _Period)) extendedBar = Bars(_Symbol, _Period) - 1; //--- Cap extended bar at total bars if exceeded
         extendedNecklineStartTime = iTime(_Symbol, _Period, extendedBar); //--- Update extended neckline start time
         extendedNecklineStartPrice = necklineStartPrice - slope * (extendedBar - necklineStartBar); //--- Update extended neckline start price
         Print("Neckline extended to fallback (2x LS to Neckline Start): Bar ", extendedBar, " (no crossing within uniformity)"); //--- Log fallback extension
      }

      Print("Inverse Head and Shoulders Detected:");                  //--- Log detection of inverse H&S pattern
      Print("Left Shoulder: Bar ", lsBar, ", Time ", TimeToString(lsTime), ", Price ", DoubleToString(lsPrice, _Digits)); //--- Log left shoulder details
      Print("Head: Bar ", headBar, ", Time ", TimeToString(extrema[headIdx].time), ", Price ", DoubleToString(extrema[headIdx].price, _Digits)); //--- Log head details
      Print("Right Shoulder: Bar ", rsBar, ", Time ", TimeToString(extrema[rightShoulderIdx].time), ", Price ", DoubleToString(extrema[rightShoulderIdx].price, _Digits)); //--- Log right shoulder details
      Print("Neckline Start: Bar ", necklineStartBar, ", Time ", TimeToString(necklineStartTime), ", Price ", DoubleToString(necklineStartPrice, _Digits)); //--- Log neckline start details
      Print("Neckline End: Bar ", necklineEndBar, ", Time ", TimeToString(necklineEndTime), ", Price ", DoubleToString(necklineEndPrice, _Digits)); //--- Log neckline end details
      Print("Close Price: ", DoubleToString(closePrice, _Digits));    //--- Log closing price at breakout
      Print("Breakout Time: ", TimeToString(breakoutTime));           //--- Log breakout timestamp
      Print("Neckline Price at Breakout: ", DoubleToString(breakoutNecklinePrice, _Digits)); //--- Log neckline price at breakout
      Print("Extended Neckline Start: Bar ", extendedBar, ", Time ", TimeToString(extendedNecklineStartTime), ", Price ", DoubleToString(extendedNecklineStartPrice, _Digits)); //--- Log extended neckline start details
      Print("Bar Ranges: LS to Head = ", lsToHead, ", Head to RS = ", headToRs, ", RS to Breakout = ", rsToBreakout, ", LS to Neckline Start = ", lsToNeckStart); //--- Log bar ranges for pattern analysis

      string prefix = "IHS_" + TimeToString(extrema[headIdx].time, TIME_MINUTES); //--- Create unique prefix for chart objects based on head time
      // Lines
      DrawTrendLine(prefix + "_LeftToNeckStart", lsTime, lsPrice, necklineStartTime, necklineStartPrice, clrGreen, 2, STYLE_SOLID); //--- Draw line from left shoulder to neckline start
      DrawTrendLine(prefix + "_NeckStartToHead", necklineStartTime, necklineStartPrice, extrema[headIdx].time, extrema[headIdx].price, clrGreen, 2, STYLE_SOLID); //--- Draw line from neckline start to head
      DrawTrendLine(prefix + "_HeadToNeckEnd", extrema[headIdx].time, extrema[headIdx].price, necklineEndTime, necklineEndPrice, clrGreen, 2, STYLE_SOLID); //--- Draw line from head to neckline end
      DrawTrendLine(prefix + "_NeckEndToRight", necklineEndTime, necklineEndPrice, extrema[rightShoulderIdx].time, extrema[rightShoulderIdx].price, clrGreen, 2, STYLE_SOLID); //--- Draw line from neckline end to right shoulder
      DrawTrendLine(prefix + "_Neckline", extendedNecklineStartTime, extendedNecklineStartPrice, breakoutTime, breakoutNecklinePrice, clrBlue, 2, STYLE_SOLID); //--- Draw neckline from extended start to breakout
      DrawTrendLine(prefix + "_RightToBreakout", extrema[rightShoulderIdx].time, extrema[rightShoulderIdx].price, breakoutTime, breakoutNecklinePrice, clrGreen, 2, STYLE_SOLID); //--- Draw line from right shoulder to breakout
      DrawTrendLine(prefix + "_ExtendedToLeftShoulder", extendedNecklineStartTime, extendedNecklineStartPrice, lsTime, lsPrice, clrGreen, 2, STYLE_SOLID); //--- Draw line from extended neckline to left shoulder
      // Triangles
      DrawTriangle(prefix + "_LeftShoulderTriangle", lsTime, lsPrice, necklineStartTime, necklineStartPrice, extendedNecklineStartTime, extendedNecklineStartPrice, clrLightGreen); //--- Draw triangle for left shoulder area
      DrawTriangle(prefix + "_HeadTriangle", extrema[headIdx].time, extrema[headIdx].price, necklineStartTime, necklineStartPrice, necklineEndTime, necklineEndPrice, clrLightGreen); //--- Draw triangle for head area
      DrawTriangle(prefix + "_RightShoulderTriangle", extrema[rightShoulderIdx].time, extrema[rightShoulderIdx].price, necklineEndTime, necklineEndPrice, breakoutTime, breakoutNecklinePrice, clrLightGreen); //--- Draw triangle for right shoulder area
      // Text Labels
      DrawText(prefix + "_LS_Label", lsTime, lsPrice, "LS", clrGreen, false); //--- Draw "LS" label below left shoulder
      DrawText(prefix + "_Head_Label", extrema[headIdx].time, extrema[headIdx].price, "HEAD", clrGreen, false); //--- Draw "HEAD" label below head
      DrawText(prefix + "_RS_Label", extrema[rightShoulderIdx].time, extrema[rightShoulderIdx].price, "RS", clrGreen, false); //--- Draw "RS" label below right shoulder
      datetime necklineMidTime = extendedNecklineStartTime + (breakoutTime - extendedNecklineStartTime) / 2; //--- Calculate midpoint time of the neckline
      double necklineMidPrice = extendedNecklineStartPrice + slope * (iBarShift(_Symbol, _Period, extendedNecklineStartTime) - iBarShift(_Symbol, _Period, necklineMidTime)); //--- Calculate midpoint price of the neckline
      // Calculate angle in pixel space
      int x1 = ShiftToX(iBarShift(_Symbol, _Period, extendedNecklineStartTime)); //--- Convert extended neckline start to x-pixel coordinate
      int y1 = PriceToY(extendedNecklineStartPrice);                          //--- Convert extended neckline start price to y-pixel coordinate
      int x2 = ShiftToX(iBarShift(_Symbol, _Period, breakoutTime));           //--- Convert breakout time to x-pixel coordinate
      int y2 = PriceToY(breakoutNecklinePrice);                               //--- Convert breakout price to y-pixel coordinate
      double pixelSlope = (y2 - y1) / (double)(x2 - x1);                     //--- Calculate slope in pixel space (rise over run)
      double necklineAngle = -atan(pixelSlope) * 180 / M_PI;                  //--- Calculate neckline angle in degrees, negated for visual alignment
      Print("Pixel X1: ", x1, ", Y1: ", y1, ", X2: ", x2, ", Y2: ", y2, ", Pixel Slope: ", DoubleToString(pixelSlope, 4), ", Neckline Angle: ", DoubleToString(necklineAngle, 2)); //--- Log pixel coordinates and angle
      DrawText(prefix + "_Neckline_Label", necklineMidTime, necklineMidPrice, "NECKLINE", clrBlue, true, necklineAngle); //--- Draw "NECKLINE" label at midpoint with calculated angle

      double entryPrice = 0;                                                  //--- Set entry price to 0 for market order (uses current price)
      double sl = extrema[rightShoulderIdx].price - BufferPoints * _Point;    //--- Calculate stop-loss below right shoulder with buffer
      double patternHeight = necklinePrice - extrema[headIdx].price;          //--- Calculate pattern height from neckline to head
      double tp = closePrice + patternHeight;                                 //--- Calculate take-profit above close by pattern height
      if (sl < closePrice && tp > closePrice) {                               //--- Validate trade direction (SL below, TP above for buy)
         if (obj_Trade.Buy(LotSize, _Symbol, entryPrice, sl, tp, "Inverse Head and Shoulders")) { //--- Attempt to open a buy trade
            AddTradedPattern(lsTime, lsPrice);                                //--- Add pattern to traded list
            Print("Buy Trade Opened: SL ", DoubleToString(sl, _Digits), ", TP ", DoubleToString(tp, _Digits)); //--- Log successful trade opening
         }
      }
   }
}
あとは、利益を最大化するために、開かれたポジションに対してトレーリングストップのロジックを適用して管理する処理が残っています。そのためのトレーリングロジックを扱う関数を以下のように作成します。
//+------------------------------------------------------------------+
//| Apply trailing stop with minimum profit threshold                |
//+------------------------------------------------------------------+
void ApplyTrailingStop(int minTrailPoints, int trailingPoints, CTrade &trade_object, ulong magicNo = 0) { //--- Function to apply trailing stop to open positions
   double bid = SymbolInfoDouble(_Symbol, SYMBOL_BID);                           //--- Get current bid price
   double ask = SymbolInfoDouble(_Symbol, SYMBOL_ASK);                           //--- Get current ask price

   for (int i = PositionsTotal() - 1; i >= 0; i--) {                             //--- Loop through all open positions from last to first
      ulong ticket = PositionGetTicket(i);                                       //--- Retrieve position ticket number
      if (ticket > 0 && PositionSelectByTicket(ticket)) {                        //--- Check if ticket is valid and select the position
         if (PositionGetString(POSITION_SYMBOL) == _Symbol &&                    //--- Verify position is for the current symbol
             (magicNo == 0 || PositionGetInteger(POSITION_MAGIC) == magicNo)) {  //--- Check if magic number matches or no magic filter applied
            double openPrice = PositionGetDouble(POSITION_PRICE_OPEN);           //--- Get position opening price
            double currentSL = PositionGetDouble(POSITION_SL);                   //--- Get current stop-loss price
            double currentProfit = PositionGetDouble(POSITION_PROFIT) / (LotSize * SymbolInfoDouble(_Symbol, SYMBOL_TRADE_TICK_VALUE)); //--- Calculate profit in points

            if (PositionGetInteger(POSITION_TYPE) == POSITION_TYPE_BUY) {         //--- Check if position is a Buy
               double profitPoints = (bid - openPrice) / _Point;                 //--- Calculate profit in points for Buy position
               if (profitPoints >= minTrailPoints + trailingPoints) {            //--- Check if profit exceeds minimum threshold for trailing
                  double newSL = NormalizeDouble(bid - trailingPoints * _Point, _Digits); //--- Calculate new stop-loss price
                  if (newSL > openPrice && (newSL > currentSL || currentSL == 0)) { //--- Ensure new SL is above open price and better than current SL
                     if (trade_object.PositionModify(ticket, newSL, PositionGetDouble(POSITION_TP))) { //--- Attempt to modify position with new SL
                        Print("Trailing Stop Updated: Ticket ", ticket, ", New SL: ", DoubleToString(newSL, _Digits)); //--- Log successful SL update
                     }
                  }
               }
            } else if (PositionGetInteger(POSITION_TYPE) == POSITION_TYPE_SELL) { //--- Check if position is a Sell
               double profitPoints = (openPrice - ask) / _Point;                 //--- Calculate profit in points for Sell position
               if (profitPoints >= minTrailPoints + trailingPoints) {            //--- Check if profit exceeds minimum threshold for trailing
                  double newSL = NormalizeDouble(ask + trailingPoints * _Point, _Digits); //--- Calculate new stop-loss price
                  if (newSL < openPrice && (newSL < currentSL || currentSL == 0)) { //--- Ensure new SL is below open price and better than current SL
                     if (trade_object.PositionModify(ticket, newSL, PositionGetDouble(POSITION_TP))) { //--- Attempt to modify position with new SL
                        Print("Trailing Stop Updated: Ticket ", ticket, ", New SL: ", DoubleToString(newSL, _Digits)); //--- Log successful SL update
                     }
                  }
               }
            }
         }
      }
   }
}
ここでは、ApplyTrailingStop関数を使ってトレーリングストップ機能を追加します。この関数は、minTrailPointsおよびtrailingPointsを使って、保有中のポジションのストップロスを調整します。まず、SymbolInfoDouble関数を使ってbidおよびask価格を取得します。次に、PositionsTotal関数でポジション数を取得し、ループで処理していきます。各ポジションについて、 PositionGetTicket関数でticketを取得し、PositionSelectByTicket関数で選択します。その後、PositionGetStringおよびPositionGetInteger関数を使ってシンボルとmagicNoを確認します。さらに、PositionGetDouble関数を使用して、openPrice、currentSL、currentProfitを取得します。
買いの場合は、bidを使って利益を計算し、その値がminTrailPointsとtrailingPointsの合計を超えている場合、NormalizeDouble関数で計算されたnewSLを設定し、trade_objectオブジェクトのPositionModifyメソッドを使って更新します。売りの場合はaskを使い、逆方向でnewSLを下側に設定します。価格の更新が成功した場合は、その情報をログに記録します。この関数はOnTickイベントハンドラ内で呼び出すことができます。
// Apply trailing stop if enabled and positions exist
if (UseTrailingStop && PositionsTotal() > 0) {                        //--- Check if trailing stop is enabled and there are open positions
   ApplyTrailingStop(MinTrailPoints, TrailingPoints, obj_Trade, MagicNumber); //--- Apply trailing stop to positions with specified parameters
}
トレーリングストップを有効にするには、入力パラメータを使って関数を呼び出すだけで十分です。あとは、プログラムの使用が終了した際に、使用した配列のメモリを解放し、表示用に作成したオブジェクトを削除する処理が残っています。これらはOnDeinitイベントハンドラ内で処理します。
//+------------------------------------------------------------------+
//| Expert deinitialization function                                 |
//+------------------------------------------------------------------+
void OnDeinit(const int reason) {                                        //--- Expert Advisor deinitialization function
   ArrayFree(tradedPatterns);                                            //--- Free memory used by tradedPatterns array
   ObjectsDeleteAll(0, "HS_");                                           //--- Delete all chart objects with "HS_" prefix (standard H&S)
   ObjectsDeleteAll(0, "IHS_");                                          //--- Delete all chart objects with "IHS_" prefix (inverse H&S)
   ChartRedraw();                                                        //--- Redraw the chart to remove deleted objects
}
EAが終了する際に実行されるOnDeinitイベントハンドラでは、プログラムおよび接続されたチャートの後処理をおこないます。まず、ArrayFree関数を使用して、tradedPatterns配列のメモリを解放します。次に、チャート上のオブジェクトをすべて削除します。ObjectsDeleteAll関数を使って、三尊天井用に作成された「HS_」というプレフィックスを持つオブジェクトを削除し、逆三尊用に作成された「IHS_」プレフィックスのオブジェクトも同様に削除します。最後に、チャートを更新し、ChartRedraw関数を使用してこれらの変更を表示に反映させてから完全に終了します。コンパイルすると、次の結果が得られます。

画像からわかるように、売買したパターンに対してトレーリングストップを適用しており、これによって目的を達成しています。残る課題はプログラムのバックテストであり、それについては次のセクションで扱います。
バックテスト
徹底的なバックテストの結果、次の結果が得られました。
バックテストグラフ

バックテストレポート

結論
結論として、MQL5 で三尊天井取引アルゴリズムを構築することに成功しました。このアルゴリズムは、正確なパターン検出、詳細な視覚化、そしてクラシックな反転シグナルに基づく自動売買機能を備えています。検証ルール、ネックラインの描画、トレーリングストップを活用することで、EAは市場の変動に効果的に対応します。ここで示したイラストや手法は、パラメータ調整や高度なリスク管理などの追加機能を実装するための足がかりとして活用できます。また、このパターンは出現頻度が低いことにも留意してください。
免責条項:本記事は教育目的のみを意図したものです。取引には大きな財務リスクが伴い、市場の状況は予測できない場合があります。実際の運用前には十分なバックテストとリスク管理が不可欠です。
この基盤をもとに、取引スキルを磨きながらアルゴリズムの改良を進めていけます。継続的にテストと最適化を重ねて、成功を目指しましょう。ご健闘をお祈りします。
MetaQuotes Ltdにより英語から翻訳されました。
元の記事: https://www.mql5.com/en/articles/17618
警告: これらの資料についてのすべての権利はMetaQuotes Ltd.が保有しています。これらの資料の全部または一部の複製や再プリントは禁じられています。
この記事はサイトのユーザーによって執筆されたものであり、著者の個人的な見解を反映しています。MetaQuotes Ltdは、提示された情報の正確性や、記載されているソリューション、戦略、または推奨事項の使用によって生じたいかなる結果についても責任を負いません。

- 無料取引アプリ
- 8千を超えるシグナルをコピー
- 金融ニュースで金融マーケットを探索