Automatización de estrategias de trading en MQL5 (Parte 13): Algoritmo de trading para patrón Hombro-Cabeza-Hombro

Introducción
En nuestro artículo anterior (Parte 12), implementamos la estrategia Mitigation Order Blocks (MOB) en MetaQuotes Language 5 (MQL5) para aprovechar las zonas de precios institucionales para operar. Ahora, en la parte 13, centramos nuestra atención en crear un algoritmo de trading «Hombro-Cabeza-Hombro», automatizando un patrón de reversión clásico para capturar los giros del mercado con precisión. Abordaremos los siguientes temas:
- Comprender la arquitectura del patrón Hombro-Cabeza-Hombro
- Implementación en MQL5
- Prueba retrospectiva
- Conclusión
Al finalizar este artículo tendrás un Asesor Experto totalmente funcional listo para operar el patrón Hombro-Cabeza-Hombro. Vamos a ello.
Comprender la arquitectura del patrón Hombro-Cabeza-Hombro
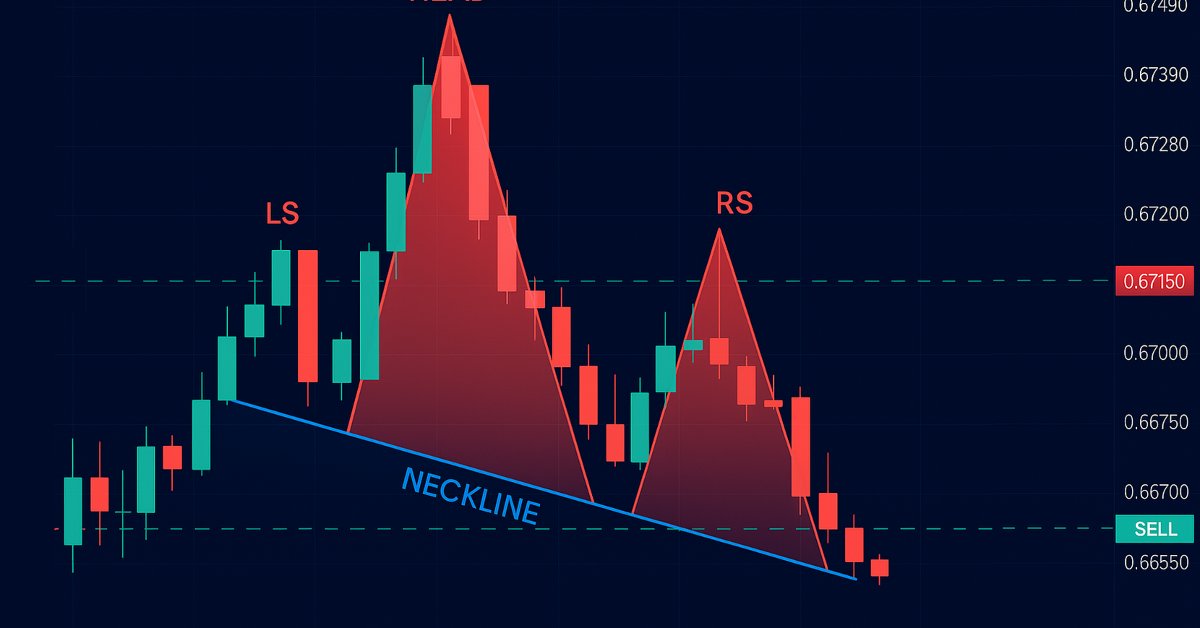
El patrón Hombro-Cabeza-Hombro es una formación clásica del análisis técnico usada para anticipar cambios de tendencia. Puede ser estándar (bajista) o invertido (alcista), según la secuencia de picos o valles que dibuja el precio. En el patrón estándar, en nuestro programa, una tendencia alcista dará paso a tres picos: el hombro izquierdo establecerá un máximo, la cabeza se elevará claramente más alto como clímax de la tendencia (superando significativamente a ambos hombros), y el hombro derecho se formará por debajo de la cabeza, pero con una altura cercana a la del izquierdo, todo ello unido por una línea de cuello que conecta los dos valles. Una vez que el precio rompa por debajo de esta línea, entraremos en una operación bajista en la ruptura, estableceremos un stop-loss por encima del hombro derecho y fijaremos un objetivo de take-profit proyectando la altura de la cabeza a la línea de cuello hacia abajo, como se ilustra a continuación.

Para el patrón inverso, una tendencia bajista producirá tres mínimos: el hombro izquierdo marcará un mínimo, la cabeza caerá notablemente más (por debajo de ambos hombros) y el hombro derecho se alineará cerca del nivel del izquierdo, con una línea de cuello que atraviesa los picos; si el precio la supera, se activará una entrada alcista, con un stop-loss por debajo del hombro derecho y un take-profit que se extenderá hacia arriba por la distancia entre la línea de cuello y la cabeza, todo ello basado en la altura destacada de la cabeza y la casi simetría de los hombros como reglas orientativas. Aquí está su visualización.

En cuanto a la gestión de riesgos, integraremos una función opcional de trailing stop para asegurar las ganancias y maximizar los beneficios. Allá vamos.
Implementación en MQL5
Para crear el programa en MQL5, abra el MetaEditor, vaya al Navegador, localice la carpeta Indicadores, haga clic en la pestaña «Nuevo» y siga las instrucciones para crear el archivo. Una vez creado, en el entorno de programación, tendremos que declarar algunas variables globales que utilizaremos a lo largo del programa.
//+------------------------------------------------------------------+
//|                                  Head & Shoulders Pattern EA.mq5 |
//|                           Copyright 2025, Allan Munene Mutiiria. |
//|                                   https://t.me/Forex_Algo_Trader |
//+------------------------------------------------------------------+
#property copyright "Copyright 2025, Allan Munene Mutiiria."
#property link      "https://youtube.com/@ForexAlgo-Trader?"
#property version   "1.00"

#include <Trade\Trade.mqh>                    //--- Include the Trade.mqh library for trading functions
CTrade obj_Trade;                            //--- Trade object for executing and managing trades

// Input Parameters
input int LookbackBars = 50;                   // Number of historical bars to analyze for pattern detection
input double ThresholdPoints = 70.0;           // Minimum price movement in points to identify a reversal
input double ShoulderTolerancePoints = 15.0;   // Maximum allowable price difference between left and right shoulders
input double TroughTolerancePoints = 30.0;     // Maximum allowable price difference between neckline troughs or peaks
input double BufferPoints = 10.0;              // Additional points added to stop-loss for safety buffer
input double LotSize = 0.1;                    // Volume of each trade in lots
input ulong MagicNumber = 123456;              // Unique identifier for trades opened by this EA
input int MaxBarRange = 30;                    // Maximum number of bars allowed between key pattern points
input int MinBarRange = 5;                     // Minimum number of bars required between key pattern points
input double BarRangeMultiplier = 2.0;         // Maximum multiple of the smallest bar range for pattern uniformity
input int ValidationBars = 3;                  // Number of bars after right shoulder to validate breakout
input double PriceTolerance = 5.0;             // Price tolerance in points for matching traded patterns
input double RightShoulderBreakoutMultiplier = 1.5; // Maximum multiple of pattern range for right shoulder to breakout distance
input int MaxTradedPatterns = 20;              // Maximum number of patterns stored in traded history
input bool UseTrailingStop = false;             // Toggle to enable or disable trailing stop functionality
input int MinTrailPoints = 50;                 // Minimum profit in points before trailing stop activates
input int TrailingPoints = 30;                 // Distance in points to maintain behind current price when trailing
Aquí, comenzamos con «#include <Trade\Trade.mqh>» y un objeto «CTrade», «obj_Trade», para incluir archivos de negociación adicionales para la gestión de operaciones. Establecemos entradas como «LookbackBars» (por defecto 50) para el análisis histórico, «ThresholdPoints» (por defecto 70,0) para la confirmación de la reversión, y «ShoulderTolerancePoints» (por defecto 15,0) y «TroughTolerancePoints» (por defecto 30,0) para la simetría. El resto de entradas se explican por sí mismas. Hemos añadido comentarios detallados para facilitar la comprensión. A continuación, debemos definir algunas estructuras que utilizaremos para encontrar los patrones y gestionar las operaciones consideradas.
// Structure to store peaks and troughs
struct Extremum {
   int bar;           //--- Bar index where extremum occurs
   datetime time;     //--- Timestamp of the bar
   double price;      //--- Price at extremum (high for peak, low for trough)
   bool isPeak;       //--- True if peak (high), false if trough (low)
};

// Structure to store traded patterns
struct TradedPattern {
   datetime leftShoulderTime;  //--- Timestamp of the left shoulder
   double leftShoulderPrice;   //--- Price of the left shoulder
};
Definimos dos estructuras clave con la palabra clave struct para impulsar nuestro algoritmo de Hombro-Cabeza-Hombro: "Extremum" guardará picos y valles con "bar" (index), "time" (marca temporal), "price" (valor) y "isPeak" (true para picos, false para valles) para identificar los componentes del patrón; mientras que "TradedPattern" registrará las operaciones ejecutadas usando "leftShoulderTime" y "leftShoulderPrice" para evitar duplicados. Para asegurarnos de que operamos una vez por barra y hacemos un seguimiento de las operaciones en curso, declaramos una variable y una matriz (array) como se indica a continuación.
// Global Variables
static datetime lastBarTime = 0;         //--- Tracks the timestamp of the last processed bar to avoid reprocessing
TradedPattern tradedPatterns[];          //--- Array to store details of previously traded patterns
Con esto, ya estamos listos. Sin embargo, dado que tendremos que mostrar el patrón en el gráfico, necesitaremos obtener la arquitectura del gráfico y los componentes de las barras para asegurarnos de que se adapta a los requisitos del patrón.
int chart_width         = (int)ChartGetInteger(0, CHART_WIDTH_IN_PIXELS);        //--- Width of the chart in pixels for visualization
int chart_height        = (int)ChartGetInteger(0, CHART_HEIGHT_IN_PIXELS);       //--- Height of the chart in pixels for visualization
int chart_scale         = (int)ChartGetInteger(0, CHART_SCALE);                  //--- Zoom level of the chart (0-5)
int chart_first_vis_bar = (int)ChartGetInteger(0, CHART_FIRST_VISIBLE_BAR);      //--- Index of the first visible bar on the chart
int chart_vis_bars      = (int)ChartGetInteger(0, CHART_VISIBLE_BARS);           //--- Number of visible bars on the chart
double chart_prcmin     = ChartGetDouble(0, CHART_PRICE_MIN, 0);                 //--- Minimum price visible on the chart
double chart_prcmax     = ChartGetDouble(0, CHART_PRICE_MAX, 0);                 //--- Maximum price visible on the chart

//+------------------------------------------------------------------+
//| Converts the chart scale property to bar width/spacing           |
//+------------------------------------------------------------------+
int BarWidth(int scale) { return (int)pow(2, scale); }                           //--- Calculates bar width in pixels based on chart scale (zoom level)

//+------------------------------------------------------------------+
//| Converts the bar index (as series) to x in pixels                |
//+------------------------------------------------------------------+
int ShiftToX(int shift) { return (chart_first_vis_bar - shift) * BarWidth(chart_scale) - 1; } //--- Converts bar index to x-coordinate in pixels on the chart

//+------------------------------------------------------------------+
//| Converts the price to y in pixels                                |
//+------------------------------------------------------------------+
int PriceToY(double price) {                                                     //--- Function to convert price to y-coordinate in pixels
   if (chart_prcmax - chart_prcmin == 0.0) return 0;                             //--- Return 0 if price range is zero to avoid division by zero
   return (int)round(chart_height * (chart_prcmax - price) / (chart_prcmax - chart_prcmin) - 1); //--- Calculate y-pixel position based on price and chart dimensions
}
Preparamos y equipamos el programa con visualización definiendo variables como «chart_width» y «chart_height» utilizando la función ChartGetInteger para las dimensiones del gráfico, «chart_scale» para el zoom, «chart_first_vis_bar» y «chart_vis_bars» para los detalles de las barras, y «chart_prcmin» y «chart_prcmax» mediante ChartGetDouble para el rango de precios. Utilizamos la función «BarWidth» con pow para calcular el espaciado entre barras a partir de «chart_scale», la función «ShiftToX» para convertir los índices de las barras en coordenadas x utilizando «chart_first_vis_bar» y «chart_scale», y la función «PriceToY» con round para asignar los precios a las coordenadas y basándose en «chart_height», «chart_prcmax» y «chart_prcmin», lo que permite una visualización precisa de los patrones. Ya estamos listos. Ahora podemos proceder a inicializar el programa en el controlador de eventos OnInit.
//+------------------------------------------------------------------+
//| Expert initialization function                                   |
//+------------------------------------------------------------------+
int OnInit() {                                                           //--- Expert Advisor initialization function
   obj_Trade.SetExpertMagicNumber(MagicNumber);                          //--- Set the magic number for trades opened by this EA
   ArrayResize(tradedPatterns, 0);                                       //--- Initialize tradedPatterns array with zero size
   return(INIT_SUCCEEDED);                                               //--- Return success code to indicate successful initialization
}
En OnInit, utilizamos el método «SetExpertMagicNumber» en el objeto «obj_Trade» para asignar «MagicNumber» como identificador único para todas las operaciones, lo que garantiza que las posiciones de nuestro programa sean distinguibles, y llamamos a la función ArrayResize para establecer el tamaño de la matriz «tradedPatterns» en cero, borrando cualquier dato anterior para empezar de cero. A continuación, concluimos devolviendo INIT_SUCCEEDED para confirmar que la configuración se ha realizado correctamente, preparando el Asesor Experto para detectar y operar con el patrón de forma eficaz. Ahora podemos pasar al controlador de eventos OnTick y asegurarnos de que realizamos el análisis una vez por barra.
//+------------------------------------------------------------------+
//| Expert tick function                                             |
//+------------------------------------------------------------------+
void OnTick() {                                                          //--- Main tick function executed on each price update
   datetime currentBarTime = iTime(_Symbol, _Period, 0);                 //--- Get the timestamp of the current bar
   if (currentBarTime == lastBarTime) return;                            //--- Exit if the current bar has already been processed

   lastBarTime = currentBarTime;                                         //--- Update the last processed bar time

   // Update chart properties
   chart_width         = (int)ChartGetInteger(0, CHART_WIDTH_IN_PIXELS); //--- Update chart width in pixels
   chart_height        = (int)ChartGetInteger(0, CHART_HEIGHT_IN_PIXELS); //--- Update chart height in pixels
   chart_scale         = (int)ChartGetInteger(0, CHART_SCALE);           //--- Update chart zoom level
   chart_first_vis_bar = (int)ChartGetInteger(0, CHART_FIRST_VISIBLE_BAR); //--- Update index of the first visible bar
   chart_vis_bars      = (int)ChartGetInteger(0, CHART_VISIBLE_BARS);    //--- Update number of visible bars
   chart_prcmin        = ChartGetDouble(0, CHART_PRICE_MIN, 0);          //--- Update minimum visible price on chart
   chart_prcmax        = ChartGetDouble(0, CHART_PRICE_MAX, 0);          //--- Update maximum visible price on chart

   // Skip pattern detection if a position is already open
   if (PositionsTotal() > 0) return;                                     //--- Exit function if there are open positions to avoid multiple trades
}
En el controlador de eventos OnTick, que se activa con cada actualización de precios para supervisar y responder a los cambios del mercado, utilizamos la función iTime para obtener «currentBarTime» para la última barra y compararlo con «lastBarTime» para evitar volver a procesar, actualizando «lastBarTime» solo para las nuevas barras; a continuación, actualizamos los gráficos llamando a ChartGetInteger para actualizar «chart_width», «chart_height», «chart_scale», «chart_first_vis_bar» y «chart_vis_bars», y a ChartGetDouble para «chart_prcmin» y «chart_prcmax». También utilizamos la función PositionsTotal para comprobar si hay operaciones abiertas y, en caso de que las haya, salir antes de tiempo para evitar la superposición de posiciones, preparando el terreno para la detección de patrones y la negociación. A continuación, podemos definir una función para encontrar los puntos extremos o los puntos clave del patrón.
//+------------------------------------------------------------------+
//| Find extrema in the last N bars                                  |
//+------------------------------------------------------------------+
void FindExtrema(Extremum &extrema[], int lookback) {                    //--- Function to identify peaks and troughs in price history
   ArrayFree(extrema);                                                   //--- Clear the extrema array to start fresh
   int bars = Bars(_Symbol, _Period);                                    //--- Get total number of bars available
   if (lookback >= bars) lookback = bars - 1;                            //--- Adjust lookback if it exceeds available bars

   double highs[], lows[];                                               //--- Arrays to store high and low prices
   ArraySetAsSeries(highs, true);                                        //--- Set highs array as time series (newest first)
   ArraySetAsSeries(lows, true);                                         //--- Set lows array as time series (newest first)
   CopyHigh(_Symbol, _Period, 0, lookback + 1, highs);                   //--- Copy high prices for lookback period
   CopyLow(_Symbol, _Period, 0, lookback + 1, lows);                     //--- Copy low prices for lookback period

   bool isUpTrend = highs[lookback] < highs[lookback - 1];               //--- Determine initial trend based on first two bars
   double lastHigh = highs[lookback];                                    //--- Initialize last high price
   double lastLow = lows[lookback];                                      //--- Initialize last low price
   int lastExtremumBar = lookback;                                       //--- Initialize last extremum bar index

   for (int i = lookback - 1; i >= 0; i--) {                             //--- Loop through bars from oldest to newest
      if (isUpTrend) {                                                   //--- If currently in an uptrend
         if (highs[i] > lastHigh) {                                      //--- Check if current high exceeds last high
            lastHigh = highs[i];                                         //--- Update last high price
            lastExtremumBar = i;                                         //--- Update last extremum bar index
         } else if (lows[i] < lastHigh - ThresholdPoints * _Point) {     //--- Check if current low indicates a reversal (trough)
            int size = ArraySize(extrema);                               //--- Get current size of extrema array
            ArrayResize(extrema, size + 1);                              //--- Resize array to add new extremum
            extrema[size].bar = lastExtremumBar;                         //--- Store bar index of the peak
            extrema[size].time = iTime(_Symbol, _Period, lastExtremumBar); //--- Store timestamp of the peak
            extrema[size].price = lastHigh;                              //--- Store price of the peak
            extrema[size].isPeak = true;                                 //--- Mark as a peak
            //Print("Extrema added: Bar ", lastExtremumBar, ", Time ", TimeToString(extrema[size].time), ", Price ", DoubleToString(lastHigh, _Digits), ", IsPeak true"); //--- Log new peak
            isUpTrend = false;                                           //--- Switch trend to downtrend
            lastLow = lows[i];                                           //--- Update last low price
            lastExtremumBar = i;                                         //--- Update last extremum bar index
         }
      } else {                                                        //--- If currently in a downtrend
         if (lows[i] < lastLow) {                                     //--- Check if current low is below last low
            lastLow = lows[i];                                        //--- Update last low price
            lastExtremumBar = i;                                      //--- Update last extremum bar index
         } else if (highs[i] > lastLow + ThresholdPoints * _Point) {  //--- Check if current high indicates a reversal (peak)
            int size = ArraySize(extrema);                            //--- Get current size of extrema array
            ArrayResize(extrema, size + 1);                           //--- Resize array to add new extremum
            extrema[size].bar = lastExtremumBar;                      //--- Store bar index of the trough
            extrema[size].time = iTime(_Symbol, _Period, lastExtremumBar); //--- Store timestamp of the trough
            extrema[size].price = lastLow;                            //--- Store price of the trough
            extrema[size].isPeak = false;                             //--- Mark as a trough
            //Print("Extrema added: Bar ", lastExtremumBar, ", Time ", TimeToString(extrema[size].time), ", Price ", DoubleToString(lastLow, _Digits), ", IsPeak false"); //--- Log new trough
            isUpTrend = true;                                         //--- Switch trend to uptrend
            lastHigh = highs[i];                                      //--- Update last high price
            lastExtremumBar = i;                                      //--- Update last extremum bar index
         }
      }
   }
}
Aquí, identificamos los picos y valles que definen nuestro patrón de cabeza y hombros mediante la implementación de la función «FindExtrema», que analiza las últimas barras «retrospectivas» para construir una matriz «extrema» de puntos críticos de precios. Comenzamos restableciendo la matriz «extrema» con la función ArrayFree para garantizar un borrado completo, y luego utilizamos la función «Bars» para obtener el total de barras disponibles y limitar el «lookback» si supera este límite, lo que garantiza que nos mantengamos dentro del rango de datos del gráfico. A continuación, preparamos matrices «altas» y «bajas» para almacenar los datos de precios, configurándolas como series temporales con la función ArraySetAsSeries (las más recientes primero), y las rellenamos utilizando CopyHigh y CopyLow para extraer los precios altos y bajos en «lookback + 1» barras.
En un bucle desde la barra más antigua hasta la más reciente, determinamos la tendencia con «isUpTrend» basándonos en el movimiento inicial del precio, luego rastreamos «lastHigh» o «lastLow» y su «lastExtremumBar»; cuando una reversión supera «ThresholdPoints», ampliamos «extrema» con la función ArrayResize, almacenamos detalles como «bar», «time» (a través de «iTime»), «price» e «isPeak» (verdadero para picos, falso para valles) y cambiamos la tendencia, lo que permite una identificación precisa del patrón. Ahora podemos tomar los niveles de precios identificados y almacenarlos para su uso posterior.
Extremum extrema[];                                                   //--- Array to store identified peaks and troughs
FindExtrema(extrema, LookbackBars);                                   //--- Find extrema in the last LookbackBars bars
Aquí, declaramos una «extrema» matriz de tipo «Extremum» para contener los picos y valles identificados, que almacenarán los hombros y la cabeza del patrón. A continuación, llamamos a la función «FindExtrema», pasando «extrema» y «LookbackBars» como argumentos, para escanear las últimas barras «LookbackBars» y rellenar la matriz con los extremos clave, sentando las bases para el reconocimiento de patrones y las decisiones comerciales posteriores. Cuando imprimimos los valores de la matriz utilizando la función ArrayPrint, obtenemos algo que representa la siguiente estructura.

Esto confirma que disponemos de los datos necesarios. Así que podemos proceder a identificar los componentes del patrón. Para modularizar el código, utilizamos funciones.
//+------------------------------------------------------------------+
//| Detect standard Head and Shoulders pattern                       |
//+------------------------------------------------------------------+
bool DetectHeadAndShoulders(Extremum &extrema[], int &leftShoulderIdx, int &headIdx, int &rightShoulderIdx, int &necklineStartIdx, int &necklineEndIdx) { //--- Function to detect standard H&S pattern
   int size = ArraySize(extrema);                                        //--- Get the size of the extrema array
   if (size < 6) return false;                                           //--- Return false if insufficient extrema for pattern (need at least 6 points)

   for (int i = size - 6; i >= 0; i--) {                                 //--- Loop through extrema to find H&S pattern (start at size-6 to ensure enough points)
      if (!extrema[i].isPeak && extrema[i+1].isPeak && !extrema[i+2].isPeak && //--- Check sequence: trough, peak (LS), trough
          extrema[i+3].isPeak && !extrema[i+4].isPeak && extrema[i+5].isPeak) { //--- Check sequence: peak (head), trough, peak (RS)
         double leftShoulder = extrema[i+1].price;                       //--- Get price of left shoulder
         double head = extrema[i+3].price;                               //--- Get price of head
         double rightShoulder = extrema[i+5].price;                      //--- Get price of right shoulder
         double trough1 = extrema[i+2].price;                            //--- Get price of first trough (neckline start)
         double trough2 = extrema[i+4].price;                            //--- Get price of second trough (neckline end)

         bool isHeadHighest = true;                                      //--- Flag to verify head is the highest peak in range
         for (int j = MathMax(0, i - 5); j < MathMin(size, i + 10); j++) { //--- Check surrounding bars (5 before, 10 after) for higher peaks
            if (extrema[j].isPeak && extrema[j].price > head && j != i + 3) { //--- If another peak is higher than head
               isHeadHighest = false;                                    //--- Set flag to false
               break;                                                    //--- Exit loop as head is not highest
            }
         }

         int lsBar = extrema[i+1].bar;                                   //--- Get bar index of left shoulder
         int headBar = extrema[i+3].bar;                                 //--- Get bar index of head
         int rsBar = extrema[i+5].bar;                                   //--- Get bar index of right shoulder
         int lsToHead = lsBar - headBar;                                 //--- Calculate bars from left shoulder to head
         int headToRs = headBar - rsBar;                                 //--- Calculate bars from head to right shoulder

         if (lsToHead < MinBarRange || lsToHead > MaxBarRange || headToRs < MinBarRange || headToRs > MaxBarRange) continue; //--- Skip if bar ranges are out of bounds

         int minRange = MathMin(lsToHead, headToRs);                     //--- Get the smaller of the two ranges for uniformity check
         if (lsToHead > minRange * BarRangeMultiplier || headToRs > minRange * BarRangeMultiplier) continue; //--- Skip if ranges exceed uniformity multiplier

         bool rsValid = false;                                           //--- Flag to validate right shoulder breakout
         int rsBarIndex = extrema[i+5].bar;                              //--- Get bar index of right shoulder for validation
         for (int j = rsBarIndex - 1; j >= MathMax(0, rsBarIndex - ValidationBars); j--) { //--- Check bars after right shoulder for breakout
            if (iLow(_Symbol, _Period, j) < rightShoulder - ThresholdPoints * _Point) { //--- Check if price drops below RS by threshold
               rsValid = true;                                           //--- Set flag to true if breakout confirmed
               break;                                                    //--- Exit loop once breakout is validated
            }
         }
         if (!rsValid) continue;                                         //--- Skip if right shoulder breakout not validated

         if (isHeadHighest && head > leftShoulder && head > rightShoulder && //--- Verify head is highest and above shoulders
             MathAbs(leftShoulder - rightShoulder) < ShoulderTolerancePoints * _Point && //--- Check shoulder price difference within tolerance
             MathAbs(trough1 - trough2) < TroughTolerancePoints * _Point) { //--- Check trough price difference within tolerance
            leftShoulderIdx = i + 1;                                     //--- Set index for left shoulder
            headIdx = i + 3;                                             //--- Set index for head
            rightShoulderIdx = i + 5;                                    //--- Set index for right shoulder
            necklineStartIdx = i + 2;                                    //--- Set index for neckline start (first trough)
            necklineEndIdx = i + 4;                                      //--- Set index for neckline end (second trough)
            Print("Bar Ranges: LS to Head = ", lsToHead, ", Head to RS = ", headToRs); //--- Log bar ranges for debugging
            return true;                                                 //--- Return true to indicate pattern found
         }
      }
   }
   return false;                                                         //--- Return false if no pattern detected
}
Aquí, detectamos el patrón estándar mediante la función «DetectHeadAndShoulders», que examina la matriz «extrema» para encontrar una secuencia válida de seis puntos: un valle, un pico (hombro izquierdo), un valle, un pico (cabeza), un valle y un pico (hombro derecho), lo que requiere al menos seis entradas, tal y como comprueba la función ArraySize. Recorremos "extrema" comenzando en "size - 6", verificando la alternancia "pico–valle" del patrón. Luego extraemos los precios de "leftShoulder", "head", "rightShoulder" y los valles "trough1" y "trough2". Un bucle interno asegura que la cabeza sea el pico más alto del tramo usando "MathMax" y "MathMin". Además, las distancias en barras entre puntos se limitan con "MinBarRange" y "MaxBarRange", y la uniformidad con "BarRangeMultiplier".
Confirmamos la ruptura del hombro derecho comprobando la función iLow con respecto a «ThresholdPoints» sobre «ValidationBars», y si la cabeza supera ambos hombros y tolerancias («ShoulderTolerancePoints», «TroughTolerancePoints»), asignamos índices como «leftShoulderIdx», «headIdx» y «necklineStartIdx», registramos los rangos de barras con la función Print para la depuración y devolvemos verdadero para señalar un patrón detectado; de lo contrario, devolvemos falso. Utilizamos la misma lógica para encontrar el patrón inverso.
//+------------------------------------------------------------------+
//| Detect inverse Head and Shoulders pattern                        |
//+------------------------------------------------------------------+
bool DetectInverseHeadAndShoulders(Extremum &extrema[], int &leftShoulderIdx, int &headIdx, int &rightShoulderIdx, int &necklineStartIdx, int &necklineEndIdx) { //--- Function to detect inverse H&S pattern
   int size = ArraySize(extrema);                                        //--- Get the size of the extrema array
   if (size < 6) return false;                                           //--- Return false if insufficient extrema for pattern (need at least 6 points)

   for (int i = size - 6; i >= 0; i--) {                                 //--- Loop through extrema to find inverse H&S pattern
      if (extrema[i].isPeak && !extrema[i+1].isPeak && extrema[i+2].isPeak && //--- Check sequence: peak, trough (LS), peak
          !extrema[i+3].isPeak && extrema[i+4].isPeak && !extrema[i+5].isPeak) { //--- Check sequence: trough (head), peak, trough (RS)
         double leftShoulder = extrema[i+1].price;                       //--- Get price of left shoulder
         double head = extrema[i+3].price;                               //--- Get price of head
         double rightShoulder = extrema[i+5].price;                      //--- Get price of right shoulder
         double peak1 = extrema[i+2].price;                              //--- Get price of first peak (neckline start)
         double peak2 = extrema[i+4].price;                              //--- Get price of second peak (neckline end)

         bool isHeadLowest = true;                                       //--- Flag to verify head is the lowest trough in range
         int headBar = extrema[i+3].bar;                                 //--- Get bar index of head for range check
         for (int j = MathMax(0, headBar - 5); j <= MathMin(Bars(_Symbol, _Period) - 1, headBar + 5); j++) { //--- Check 5 bars before and after head
            if (iLow(_Symbol, _Period, j) < head) {                      //--- If any low is below head
               isHeadLowest = false;                                     //--- Set flag to false
               break;                                                    //--- Exit loop as head is not lowest
            }
         }

         int lsBar = extrema[i+1].bar;                                   //--- Get bar index of left shoulder
         int rsBar = extrema[i+5].bar;                                   //--- Get bar index of right shoulder
         int lsToHead = lsBar - headBar;                                 //--- Calculate bars from left shoulder to head
         int headToRs = headBar - rsBar;                                 //--- Calculate bars from head to right shoulder

         if (lsToHead < MinBarRange || lsToHead > MaxBarRange || headToRs < MinBarRange || headToRs > MaxBarRange) continue; //--- Skip if bar ranges are out of bounds

         int minRange = MathMin(lsToHead, headToRs);                     //--- Get the smaller of the two ranges for uniformity check
         if (lsToHead > minRange * BarRangeMultiplier || headToRs > minRange * BarRangeMultiplier) continue; //--- Skip if ranges exceed uniformity multiplier

         bool rsValid = false;                                           //--- Flag to validate right shoulder breakout
         int rsBarIndex = extrema[i+5].bar;                              //--- Get bar index of right shoulder for validation
         for (int j = rsBarIndex - 1; j >= MathMax(0, rsBarIndex - ValidationBars); j--) { //--- Check bars after right shoulder for breakout
            if (iHigh(_Symbol, _Period, j) > rightShoulder + ThresholdPoints * _Point) { //--- Check if price rises above RS by threshold
               rsValid = true;                                           //--- Set flag to true if breakout confirmed
               break;                                                    //--- Exit loop once breakout is validated
            }
         }
         if (!rsValid) continue;                                         //--- Skip if right shoulder breakout not validated

         if (isHeadLowest && head < leftShoulder && head < rightShoulder && //--- Verify head is lowest and below shoulders
             MathAbs(leftShoulder - rightShoulder) < ShoulderTolerancePoints * _Point && //--- Check shoulder price difference within tolerance
             MathAbs(peak1 - peak2) < TroughTolerancePoints * _Point) { //--- Check peak price difference within tolerance
            leftShoulderIdx = i + 1;                                     //--- Set index for left shoulder
            headIdx = i + 3;                                             //--- Set index for head
            rightShoulderIdx = i + 5;                                    //--- Set index for right shoulder
            necklineStartIdx = i + 2;                                    //--- Set index for neckline start (first peak)
            necklineEndIdx = i + 4;                                      //--- Set index for neckline end (second peak)
            Print("Bar Ranges: LS to Head = ", lsToHead, ", Head to RS = ", headToRs); //--- Log bar ranges for debugging
            return true;                                                 //--- Return true to indicate pattern found
         }
      }
   }
   return false;                                                         //--- Return false if no pattern detected
}
Definimos la función «DetectInverseHeadAndShoulders» para identificar el patrón inverso, que examina la matriz «extrema» para localizar una secuencia de seis puntos (pico, valle [hombro izquierdo], pico, valle [cabeza], pico, valle [hombro derecho]) que necesita al menos seis entradas, según lo verifica la función ArraySize. Iteramos desde "size - 6" hacia atrás, confirmando la alternancia "pico–valle" del patrón. Luego obtenemos los precios de "leftShoulder", "head", "rightShoulder" y los picos "peak1" y "peak2". Un bucle interno comprueba si la cabeza es el valle más bajo dentro de un rango de cinco barras alrededor de "headBar" usando "MathMax", "MathMin" y "iLow". Además, "Bars" garantiza que no salgamos de los límites del gráfico.
Forzamos la separación entre barras con "MinBarRange" y "MaxBarRange", calculamos la uniformidad con "MathMin" y "BarRangeMultiplier", y validamos la ruptura del hombro derecho usando "iHigh" contra "ThresholdPoints" durante "ValidationBars". Si la "head" queda por debajo de ambos hombros y se cumplen las tolerancias ("ShoulderTolerancePoints", "TroughTolerancePoints"), guardamos índices como "leftShoulderIdx" y "necklineStartIdx", registramos los rangos y devolvemos true; en caso contrario devolvemos false. Con estas dos funciones, ahora podemos proceder a identificar los patrones como se muestra a continuación.
int leftShoulderIdx, headIdx, rightShoulderIdx, necklineStartIdx, necklineEndIdx; //--- Indices for pattern components

// Standard Head and Shoulders (Sell)
if (DetectHeadAndShoulders(extrema, leftShoulderIdx, headIdx, rightShoulderIdx, necklineStartIdx, necklineEndIdx)) { //--- Check for standard H&S pattern
   double closePrice = iClose(_Symbol, _Period, 1);                   //--- Get the closing price of the previous bar
   double necklinePrice = extrema[necklineEndIdx].price;              //--- Get the price of the neckline end point

   if (closePrice < necklinePrice) {                                  //--- Check if price has broken below the neckline (sell signal)
      datetime lsTime = extrema[leftShoulderIdx].time;                //--- Get the timestamp of the left shoulder
      double lsPrice = extrema[leftShoulderIdx].price;                //--- Get the price of the left shoulder

      //---
   }
}
Aquí, avanzamos declarando las variables «leftShoulderIdx», «headIdx», «rightShoulderIdx», «necklineStartIdx» y «necklineEndIdx» para almacenar los índices de los componentes del patrón, y luego utilizamos la función «DetectHeadAndShoulders» para comprobar la matriz «extrema» en busca de un patrón estándar, pasando estos índices como referencias. Si se detecta, recuperamos «closePrice» con la función iClose para la barra anterior y «necklinePrice» de «extrema[necklineEndIdx].price», lo que activa una señal de venta si «closePrice» cae por debajo de «necklinePrice»; a continuación, extraemos «lsTime» y «lsPrice» de «extrema[leftShoulderIdx]» para prepararnos para la ejecución de la operación basándonos en la posición del hombro izquierdo. En este punto, debemos asegurarnos de que el patrón no se comercialice. Definimos una función para realizar la comprobación.
//+------------------------------------------------------------------+
//| Check if pattern has already been traded                         |
//+------------------------------------------------------------------+
bool IsPatternTraded(datetime lsTime, double lsPrice) {                  //--- Function to check if a pattern has already been traded
   int size = ArraySize(tradedPatterns);                                 //--- Get the current size of the tradedPatterns array
   for (int i = 0; i < size; i++) {                                      //--- Loop through all stored traded patterns
      if (tradedPatterns[i].leftShoulderTime == lsTime &&                //--- Check if left shoulder time matches
          MathAbs(tradedPatterns[i].leftShoulderPrice - lsPrice) < PriceTolerance * _Point) { //--- Check if left shoulder price is within tolerance
         Print("Pattern already traded: Left Shoulder Time ", TimeToString(lsTime), ", Price ", DoubleToString(lsPrice, _Digits)); //--- Log that pattern was previously traded
         return true;                                                    //--- Return true to indicate pattern has been traded
      }
   }
   return false;                                                         //--- Return false if no match found
}
Aquí, nos aseguramos de que nuestro programa evite operaciones duplicadas mediante la implementación de la función «IsPatternTraded», que comprueba si un patrón, identificado por «lsTime» y «lsPrice», ya existe en la matriz «tradedPatterns». Utilizamos la función ArraySize para obtener el «tamaño» de la matriz y, a continuación, la recorremos comparando el «leftShoulderTime» de cada entrada con «lsTime» y el «leftShoulderPrice» con «lsPrice» dentro de un rango «PriceTolerance» mediante la función MathAbs. si se encuentra una coincidencia, la registramos con la función Print, incluyendo TimeToString y DoubleToString para facilitar la lectura, y devolvemos verdadero; de lo contrario, devolvemos falso para permitir una nueva operación. A continuación, llamamos a la función para realizar la comprobación y continuamos si no se encuentra ninguna.
if (IsPatternTraded(lsTime, lsPrice)) return;                   //--- Exit if this pattern has already been traded

datetime breakoutTime = iTime(_Symbol, _Period, 1);             //--- Get the timestamp of the breakout bar (previous bar)
int lsBar = extrema[leftShoulderIdx].bar;                       //--- Get the bar index of the left shoulder
int headBar = extrema[headIdx].bar;                             //--- Get the bar index of the head
int rsBar = extrema[rightShoulderIdx].bar;                      //--- Get the bar index of the right shoulder
int necklineStartBar = extrema[necklineStartIdx].bar;           //--- Get the bar index of the neckline start
int necklineEndBar = extrema[necklineEndIdx].bar;               //--- Get the bar index of the neckline end
int breakoutBar = 1;                                            //--- Set breakout bar index (previous bar)

int lsToHead = lsBar - headBar;                                 //--- Calculate number of bars from left shoulder to head
int headToRs = headBar - rsBar;                                 //--- Calculate number of bars from head to right shoulder
int rsToBreakout = rsBar - breakoutBar;                         //--- Calculate number of bars from right shoulder to breakout
int lsToNeckStart = lsBar - necklineStartBar;                   //--- Calculate number of bars from left shoulder to neckline start
double avgPatternRange = (lsToHead + headToRs) / 2.0;           //--- Calculate average bar range of the pattern for uniformity check

if (rsToBreakout > avgPatternRange * RightShoulderBreakoutMultiplier) { //--- Check if breakout distance exceeds allowed range
   Print("Pattern rejected: Right Shoulder to Breakout (", rsToBreakout,
         ") exceeds ", RightShoulderBreakoutMultiplier, "x average range (", avgPatternRange, ")"); //--- Log rejection due to excessive breakout range
   return;                                                      //--- Exit function if pattern is invalid
}

double necklineStartPrice = extrema[necklineStartIdx].price;    //--- Get the price of the neckline start point
double necklineEndPrice = extrema[necklineEndIdx].price;        //--- Get the price of the neckline end point
datetime necklineStartTime = extrema[necklineStartIdx].time;    //--- Get the timestamp of the neckline start point
datetime necklineEndTime = extrema[necklineEndIdx].time;        //--- Get the timestamp of the neckline end point
int barDiff = necklineStartBar - necklineEndBar;                //--- Calculate bar difference between neckline points for slope
double slope = (necklineEndPrice - necklineStartPrice) / barDiff; //--- Calculate the slope of the neckline (price change per bar)
double breakoutNecklinePrice = necklineStartPrice + slope * (necklineStartBar - breakoutBar); //--- Calculate neckline price at breakout point

// Extend neckline backwards
int extendedBar = necklineStartBar;                             //--- Initialize extended bar index with neckline start
datetime extendedNecklineStartTime = necklineStartTime;         //--- Initialize extended neckline start time
double extendedNecklineStartPrice = necklineStartPrice;         //--- Initialize extended neckline start price
bool foundCrossing = false;                                     //--- Flag to track if neckline crosses a bar within range

for (int i = necklineStartBar + 1; i < Bars(_Symbol, _Period); i++) { //--- Loop through bars to extend neckline backwards
   double checkPrice = necklineStartPrice - slope * (i - necklineStartBar); //--- Calculate projected neckline price at bar i
   if (NecklineCrossesBar(checkPrice, i)) {                     //--- Check if neckline intersects the bar's high-low range
      int distance = i - necklineStartBar;                      //--- Calculate distance from neckline start to crossing bar
      if (distance <= avgPatternRange * RightShoulderBreakoutMultiplier) { //--- Check if crossing is within uniformity range
         extendedBar = i;                                       //--- Update extended bar index
         extendedNecklineStartTime = iTime(_Symbol, _Period, i); //--- Update extended neckline start time
         extendedNecklineStartPrice = checkPrice;              //--- Update extended neckline start price
         foundCrossing = true;                                  //--- Set flag to indicate crossing found
         Print("Neckline extended to first crossing bar within uniformity: Bar ", extendedBar); //--- Log successful extension
         break;                                                 //--- Exit loop after finding valid crossing
      } else {                                                  //--- If crossing exceeds uniformity range
         Print("Crossing bar ", i, " exceeds uniformity (", distance, " > ", avgPatternRange * RightShoulderBreakoutMultiplier, ")"); //--- Log rejection of crossing
         break;                                                 //--- Exit loop as crossing is too far
      }
   }
}

if (!foundCrossing) {                                           //--- If no valid crossing found within range
   int barsToExtend = 2 * lsToNeckStart;                        //--- Set fallback extension distance as twice LS to neckline start
   extendedBar = necklineStartBar + barsToExtend;               //--- Calculate extended bar index
   if (extendedBar >= Bars(_Symbol, _Period)) extendedBar = Bars(_Symbol, _Period) - 1; //--- Cap extended bar at total bars if exceeded
   extendedNecklineStartTime = iTime(_Symbol, _Period, extendedBar); //--- Update extended neckline start time
   extendedNecklineStartPrice = necklineStartPrice - slope * (extendedBar - necklineStartBar); //--- Update extended neckline start price
   Print("Neckline extended to fallback (2x LS to Neckline Start): Bar ", extendedBar, " (no crossing within uniformity)"); //--- Log fallback extension
}

Print("Standard Head and Shoulders Detected:");                 //--- Log detection of standard H&S pattern
Print("Left Shoulder: Bar ", lsBar, ", Time ", TimeToString(lsTime), ", Price ", DoubleToString(lsPrice, _Digits)); //--- Log left shoulder details
Print("Head: Bar ", headBar, ", Time ", TimeToString(extrema[headIdx].time), ", Price ", DoubleToString(extrema[headIdx].price, _Digits)); //--- Log head details
Print("Right Shoulder: Bar ", rsBar, ", Time ", TimeToString(extrema[rightShoulderIdx].time), ", Price ", DoubleToString(extrema[rightShoulderIdx].price, _Digits)); //--- Log right shoulder details
Print("Neckline Start: Bar ", necklineStartBar, ", Time ", TimeToString(necklineStartTime), ", Price ", DoubleToString(necklineStartPrice, _Digits)); //--- Log neckline start details
Print("Neckline End: Bar ", necklineEndBar, ", Time ", TimeToString(necklineEndTime), ", Price ", DoubleToString(necklineEndPrice, _Digits)); //--- Log neckline end details
Print("Close Price: ", DoubleToString(closePrice, _Digits));    //--- Log closing price at breakout
Print("Breakout Time: ", TimeToString(breakoutTime));           //--- Log breakout timestamp
Print("Neckline Price at Breakout: ", DoubleToString(breakoutNecklinePrice, _Digits)); //--- Log neckline price at breakout
Print("Extended Neckline Start: Bar ", extendedBar, ", Time ", TimeToString(extendedNecklineStartTime), ", Price ", DoubleToString(extendedNecklineStartPrice, _Digits)); //--- Log extended neckline start details
Print("Bar Ranges: LS to Head = ", lsToHead, ", Head to RS = ", headToRs, ", RS to Breakout = ", rsToBreakout, ", LS to Neckline Start = ", lsToNeckStart); //--- Log bar ranges for pattern analysis
Aquí, mejoramos la detección de patrones validando un patrón estándar detectado y configurando una operación de venta, comenzando con la función «IsPatternTraded» para comprobar si «lsTime» y «lsPrice» coinciden con una operación anterior en «tradedPatterns», saliendo si es cierto para evitar duplicados. A continuación, utilizamos la función iTime para asignar «breakoutTime» como la marca de tiempo de la barra anterior y recuperar índices de barra como «lsBar», «headBar», «rsBar», «necklineStartBar» y «necklineEndBar» de «extrema», calculando rangos como «lsToHead», «headToRs» y «rsToBreakout»; si «rsToBreakout» supera «avgPatternRange» multiplicado por «RightShoulderBreakoutMultiplier», rechazamos el patrón y lo registramos con la función Print.
A continuación, determinamos la «pendiente» de la línea de cuello utilizando «necklineStartPrice» y «necklineEndPrice» sobre «barDiff», calculamos «breakoutNecklinePrice» y extendemos la línea de cuello hacia atrás con un bucle, utilizando la función «NecklineCrossesBar» para encontrar un cruce dentro de «avgPatternRange * RightShoulderBreakoutMultiplier», actualizando «extendedBar», «extendedNecklineStartTime» (a través de «iTime») y «extendedNecklineStartPrice»; si no hay ningún cruce que encaje, recurrimos a «2 * lsToNeckStart», con un límite máximo de «Bars» en total, y registramos todos los detalles (índices de barras, precios y rangos) con las funciones Print, TimeToString y DoubleToString para obtener una documentación exhaustiva. El fragmento de código de la función personalizada es el siguiente.
//+------------------------------------------------------------------+
//| Check if neckline crosses a bar's high-low range                 |
//+------------------------------------------------------------------+
bool NecklineCrossesBar(double necklinePrice, int barIndex) {            //--- Function to check if neckline price intersects a bar's range
   double high = iHigh(_Symbol, _Period, barIndex);                      //--- Get the high price of the specified bar
   double low = iLow(_Symbol, _Period, barIndex);                        //--- Get the low price of the specified bar
   return (necklinePrice >= low && necklinePrice <= high);               //--- Return true if neckline price is within bar's high-low range
}
El fragmento de código de la función personalizada es el siguiente. Utilizamos la función iHigh para obtener el precio «alto» de la barra y la función «iLow» para obtener su precio «bajo», y luego devolvemos verdadero si «necklinePrice» se encuentra entre «bajo» y «alto», lo que confirma que la línea de cuello cruza el rango de la barra para la validación del patrón. Si se valida el patrón, lo visualizamos en el gráfico. Necesitaremos funciones para dibujarlo y etiquetarlo.
//+------------------------------------------------------------------+
//| Draw a trend line for visualization                              |
//+------------------------------------------------------------------+
void DrawTrendLine(string name, datetime timeStart, double priceStart, datetime timeEnd, double priceEnd, color lineColor, int width, int style) { //--- Function to draw a trend line on the chart
   if (ObjectCreate(0, name, OBJ_TREND, 0, timeStart, priceStart, timeEnd, priceEnd)) { //--- Create a trend line object if possible
      ObjectSetInteger(0, name, OBJPROP_COLOR, lineColor);               //--- Set the color of the trend line
      ObjectSetInteger(0, name, OBJPROP_STYLE, style);                   //--- Set the style (e.g., solid, dashed) of the trend line
      ObjectSetInteger(0, name, OBJPROP_WIDTH, width);                   //--- Set the width of the trend line
      ObjectSetInteger(0, name, OBJPROP_BACK, true);                     //--- Set the line to draw behind chart elements
      ChartRedraw();                                                     //--- Redraw the chart to display the new line
   } else {                                                              //--- If line creation fails
      Print("Failed to create line: ", name, ". Error: ", GetLastError()); //--- Log the error with the object name and error code
   }
}

//+------------------------------------------------------------------+
//| Draw a filled triangle for visualization                         |
//+------------------------------------------------------------------+
void DrawTriangle(string name, datetime time1, double price1, datetime time2, double price2, datetime time3, double price3, color fillColor) { //--- Function to draw a filled triangle on the chart
   if (ObjectCreate(0, name, OBJ_TRIANGLE, 0, time1, price1, time2, price2, time3, price3)) { //--- Create a triangle object if possible
      ObjectSetInteger(0, name, OBJPROP_COLOR, fillColor);               //--- Set the fill color of the triangle
      ObjectSetInteger(0, name, OBJPROP_STYLE, STYLE_SOLID);             //--- Set the border style to solid
      ObjectSetInteger(0, name, OBJPROP_WIDTH, 1);                       //--- Set the border width to 1 pixel
      ObjectSetInteger(0, name, OBJPROP_FILL, true);                     //--- Enable filling of the triangle
      ObjectSetInteger(0, name, OBJPROP_BACK, true);                     //--- Set the triangle to draw behind chart elements
      ChartRedraw();                                                     //--- Redraw the chart to display the new triangle
   } else {                                                              //--- If triangle creation fails
      Print("Failed to create triangle: ", name, ". Error: ", GetLastError()); //--- Log the error with the object name and error code
   }
}

//+------------------------------------------------------------------+
//| Draw text label for visualization                                |
//+------------------------------------------------------------------+
void DrawText(string name, datetime time, double price, string text, color textColor, bool above, double angle = 0) { //--- Function to draw a text label on the chart
   int chartscale = (int)ChartGetInteger(0, CHART_SCALE);                //--- Get the current chart zoom level
   int dynamicFontSize = 5 + int(chartscale * 1.5);                      //--- Calculate font size based on zoom level for visibility
   double priceOffset = (above ? 10 : -10) * _Point;                     //--- Set price offset above or below the point for readability
   if (ObjectCreate(0, name, OBJ_TEXT, 0, time, price + priceOffset)) {  //--- Create a text object if possible
      ObjectSetString(0, name, OBJPROP_TEXT, text);                      //--- Set the text content of the label
      ObjectSetInteger(0, name, OBJPROP_COLOR, textColor);               //--- Set the color of the text
      ObjectSetInteger(0, name, OBJPROP_FONTSIZE, dynamicFontSize);      //--- Set the font size based on chart scale
      ObjectSetInteger(0, name, OBJPROP_ANCHOR, ANCHOR_CENTER);          //--- Center the text at the specified point
      ObjectSetDouble(0, name, OBJPROP_ANGLE, angle);                    //--- Set the rotation angle of the text in degrees
      ObjectSetInteger(0, name, OBJPROP_BACK, false);                    //--- Set the text to draw in front of chart elements
      ChartRedraw();                                                     //--- Redraw the chart to display the new text
      Print("Text created: ", name, ", Angle: ", DoubleToString(angle, 2)); //--- Log successful creation of the text with its angle
   } else {                                                              //--- If text creation fails
      Print("Failed to create text: ", name, ". Error: ", GetLastError()); //--- Log the error with the object name and error code
   }
}
Aquí, enriquecemos el programa con herramientas de visualización para resaltar el patrón en el gráfico, comenzando con la función «DrawTrendLine», que utiliza la función ObjectCreate para trazar una línea desde «timeStart» y «priceStart» hasta «timeEnd» y «priceEnd», estableciendo propiedades como «lineColor», «style» y «width» mediante ObjectSetInteger, dibujándola detrás de las barras con OBJPROP_BACK y actualizando la visualización con la función ChartRedraw, registrando los fallos con «Print» y GetLastError si es necesario.
A continuación, implementamos la función «DrawTriangle» para sombrear la estructura del patrón, llamando a la función «ObjectCreate» con tres puntos («time1», «price1», etc.), aplicando «fillColor» y un borde sólido utilizando ObjectSetInteger, rellenándolo con OBJPROP_FILL, colocándolo detrás del gráfico y actualizando la vista con ChartRedraw, registrando de nuevo los errores con «Print» si falla la creación.
Por último, añadimos la función «DrawText» para etiquetar los puntos clave, utilizando la función ChartGetInteger para ajustar «dynamicFontSize» en función de «chartscale», colocando el texto en «time» y «price» más un desplazamiento mediante «ObjectCreate», personalizándolo con «ObjectSetString» para «text», «ObjectSetInteger» para «textColor» y «FONTSIZE», y «ObjectSetDouble» para «angle», dibujándolo delante con ChartRedraw y confirmando la creación con «Print» y «DoubleToString» o anotando los errores. Ahora podemos llamar a las funciones para añadir la función de visibilidad, y lo primero que hacemos es añadir las líneas de la siguiente manera.
string prefix = "HS_" + TimeToString(extrema[headIdx].time, TIME_MINUTES); //--- Create unique prefix for chart objects based on head time
// Lines
DrawTrendLine(prefix + "_LeftToNeckStart", lsTime, lsPrice, necklineStartTime, necklineStartPrice, clrRed, 3, STYLE_SOLID); //--- Draw line from left shoulder to neckline start
DrawTrendLine(prefix + "_NeckStartToHead", necklineStartTime, necklineStartPrice, extrema[headIdx].time, extrema[headIdx].price, clrRed, 3, STYLE_SOLID); //--- Draw line from neckline start to head
DrawTrendLine(prefix + "_HeadToNeckEnd", extrema[headIdx].time, extrema[headIdx].price, necklineEndTime, necklineEndPrice, clrRed, 3, STYLE_SOLID); //--- Draw line from head to neckline end
DrawTrendLine(prefix + "_NeckEndToRight", necklineEndTime, necklineEndPrice, extrema[rightShoulderIdx].time, extrema[rightShoulderIdx].price, clrRed, 3, STYLE_SOLID); //--- Draw line from neckline end to right shoulder
DrawTrendLine(prefix + "_Neckline", extendedNecklineStartTime, extendedNecklineStartPrice, breakoutTime, breakoutNecklinePrice, clrBlue, 2, STYLE_SOLID); //--- Draw neckline from extended start to breakout
DrawTrendLine(prefix + "_RightToBreakout", extrema[rightShoulderIdx].time, extrema[rightShoulderIdx].price, breakoutTime, breakoutNecklinePrice, clrRed, 3, STYLE_SOLID); //--- Draw line from right shoulder to breakout
DrawTrendLine(prefix + "_ExtendedToLeftShoulder", extendedNecklineStartTime, extendedNecklineStartPrice, lsTime, lsPrice, clrRed, 3, STYLE_SOLID); //--- Draw line from extended neckline to left shoulder
Aquí, representamos visualmente el patrón estándar creando un prefijo único basado en la marca de tiempo de la cabeza utilizando la función TimeToString y dibujando líneas de tendencia con la función «DrawTrendLine» para conectar el hombro izquierdo con el inicio del cuello, el inicio del cuello a la cabeza, la cabeza al final del cuello y el final del cuello al hombro derecho en rojo con un ancho de 3, mientras que el cuello desde su inicio extendido hasta el punto de ruptura utiliza azul con un ancho de 2, y líneas adicionales conectan el hombro derecho a la ruptura y el cuello extendido de vuelta al hombro izquierdo en rojo, todo en estilo sólido para mostrar el patrón en el gráfico. Tras la compilación, obtenemos el siguiente resultado.

Para añadir los triángulos, utilizamos la función «DrawTriangle». Técnicamente, lo construimos dentro de los hombros y la cabeza.
// Triangles
DrawTriangle(prefix + "_LeftShoulderTriangle", lsTime, lsPrice, necklineStartTime, necklineStartPrice, extendedNecklineStartTime, extendedNecklineStartPrice, clrLightCoral); //--- Draw triangle for left shoulder area
DrawTriangle(prefix + "_HeadTriangle", extrema[headIdx].time, extrema[headIdx].price, necklineStartTime, necklineStartPrice, necklineEndTime, necklineEndPrice, clrLightCoral); //--- Draw triangle for head area
DrawTriangle(prefix + "_RightShoulderTriangle", extrema[rightShoulderIdx].time, extrema[rightShoulderIdx].price, necklineEndTime, necklineEndPrice, breakoutTime, breakoutNecklinePrice, clrLightCoral); //--- Draw triangle for right shoulder area
Aquí, mejoramos la visualización utilizando la función «DrawTriangle» para sombrear áreas clave en coral claro, formando un triángulo para el hombro izquierdo desde el punto del hombro izquierdo hasta el inicio del escote y el inicio del escote extendido, otro para la cabeza desde el punto de la cabeza hasta el inicio y el final del escote, y un tercero para el hombro derecho desde el punto del hombro derecho hasta el final del escote y el punto de ruptura, resaltando la estructura del patrón en el gráfico. Tras la compilación, obtenemos el siguiente resultado.

Por último, debemos añadir etiquetas al patrón para que resulte totalmente atractivo a la vista y se explique por sí mismo.
// Text Labels
DrawText(prefix + "_LS_Label", lsTime, lsPrice, "LS", clrRed, true); //--- Draw "LS" label above left shoulder
DrawText(prefix + "_Head_Label", extrema[headIdx].time, extrema[headIdx].price, "HEAD", clrRed, true); //--- Draw "HEAD" label above head
DrawText(prefix + "_RS_Label", extrema[rightShoulderIdx].time, extrema[rightShoulderIdx].price, "RS", clrRed, true); //--- Draw "RS" label above right shoulder
datetime necklineMidTime = extendedNecklineStartTime + (breakoutTime - extendedNecklineStartTime) / 2; //--- Calculate midpoint time of the neckline
double necklineMidPrice = extendedNecklineStartPrice + slope * (iBarShift(_Symbol, _Period, extendedNecklineStartTime) - iBarShift(_Symbol, _Period, necklineMidTime)); //--- Calculate midpoint price of the neckline
// Calculate angle in pixel space
int x1 = ShiftToX(iBarShift(_Symbol, _Period, extendedNecklineStartTime)); //--- Convert extended neckline start to x-pixel coordinate
int y1 = PriceToY(extendedNecklineStartPrice);                          //--- Convert extended neckline start price to y-pixel coordinate
int x2 = ShiftToX(iBarShift(_Symbol, _Period, breakoutTime));           //--- Convert breakout time to x-pixel coordinate
int y2 = PriceToY(breakoutNecklinePrice);                               //--- Convert breakout price to y-pixel coordinate
double pixelSlope = (y2 - y1) / (double)(x2 - x1);                     //--- Calculate slope in pixel space (rise over run)
double necklineAngle = -atan(pixelSlope) * 180 / M_PI;                  //--- Calculate neckline angle in degrees, negated for visual alignment
Print("Pixel X1: ", x1, ", Y1: ", y1, ", X2: ", x2, ", Y2: ", y2, ", Pixel Slope: ", DoubleToString(pixelSlope, 4), ", Neckline Angle: ", DoubleToString(necklineAngle, 2)); //--- Log pixel coordinates and angle
DrawText(prefix + "_Neckline_Label", necklineMidTime, necklineMidPrice, "NECKLINE", clrBlue, false, necklineAngle); //--- Draw "NECKLINE" label at midpoint with calculated angle
Por último, anotamos el patrón utilizando la función «DrawText» para colocar las etiquetas rojas «LS», «HEAD» y «RS» sobre los puntos del hombro izquierdo, la cabeza y el hombro derecho en sus respectivos momentos y precios, lo que mejora la legibilidad del gráfico. A continuación, calculamos el punto medio de la línea de cuello promediando «extendedNecklineStartTime» y «breakoutTime» para «necklineMidTime» y ajustamos «extendedNecklineStartPrice» con «slope» y las diferencias de barras mediante la función iBarShift para «necklineMidPrice»; para alinear la etiqueta, convertimos los tiempos a píxeles x con la función «ShiftToX» y los precios a píxeles y con la función «PriceToY» en el inicio y la ruptura de la línea de cuello, calculamos una «pixelSlope» y derivamos «necklineAngle» en grados utilizando la función atan y «M_PI», registrando estos datos con la función «Print» y la función DoubleToString para su verificación.
A continuación, dibujamos una etiqueta azul «NECKLINE» en el punto medio con la función «DrawText», situada debajo y girada para que coincida con «necklineAngle», asegurándonos de que la anotación siga la inclinación de la línea del cuello. Este es el resultado.

En la imagen podemos ver que el patrón se visualiza completamente. Ahora necesitamos detectar su ruptura, básicamente, la línea extendida, abrir una posición de venta y modificar el rango de extensión a la barra de ruptura. Pan comido. Lo conseguimos mediante la siguiente lógica.
double entryPrice = 0;                                                  //--- Set entry price to 0 for market order (uses current price)
double sl = extrema[rightShoulderIdx].price + BufferPoints * _Point;    //--- Calculate stop-loss above right shoulder with buffer
double patternHeight = extrema[headIdx].price - necklinePrice;          //--- Calculate pattern height from head to neckline
double tp = closePrice - patternHeight;                                 //--- Calculate take-profit below close by pattern height
if (sl > closePrice && tp < closePrice) {                               //--- Validate trade direction (SL above, TP below for sell)
   if (obj_Trade.Sell(LotSize, _Symbol, entryPrice, sl, tp, "Head and Shoulders")) { //--- Attempt to open a sell trade
      AddTradedPattern(lsTime, lsPrice);                                //--- Add pattern to traded list
      Print("Sell Trade Opened: SL ", DoubleToString(sl, _Digits), ", TP ", DoubleToString(tp, _Digits)); //--- Log successful trade opening
   }
}
Una vez confirmado el patrón, ejecutamos una operación de venta estableciendo «entryPrice» en 0 para una orden de mercado, calculando «sl» por encima del precio del hombro derecho con «BufferPoints», determinando «patternHeight» como la diferencia entre los precios de la cabeza y la línea del cuello, y estableciendo «tp» por debajo de «closePrice» por «patternHeight».
Validamos la dirección de la operación, asegurándonos de que «sl» esté por encima y «tp» por debajo de «closePrice», antes de utilizar la función «Sell» en «obj_Trade» para abrir la operación con «LotSize», «sl», «tp» y comentario. si tiene éxito, llamamos a la función «AddTradedPattern» con «lsTime» y «lsPrice» para registrar el patrón y utilizamos la función Print con DoubleToString para registrar los detalles de «sl» y «tp». El fragmento de código de la función personalizada para marcar el patrón como negociado es el siguiente.
//+------------------------------------------------------------------+
//| Add pattern to traded list with size management                  |
//+------------------------------------------------------------------+
void AddTradedPattern(datetime lsTime, double lsPrice) {                 //--- Function to add a new traded pattern to the list
   int size = ArraySize(tradedPatterns);                                 //--- Get the current size of the tradedPatterns array
   if (size >= MaxTradedPatterns) {                                      //--- Check if array size exceeds maximum allowed
      for (int i = 0; i < size - 1; i++) {                               //--- Shift all elements left to remove the oldest
         tradedPatterns[i] = tradedPatterns[i + 1];                      //--- Copy next element to current position
      }
      ArrayResize(tradedPatterns, size - 1);                            //--- Reduce array size by 1
      size--;                                                           //--- Decrement size variable
      Print("Removed oldest traded pattern to maintain max size of ", MaxTradedPatterns); //--- Log removal of oldest pattern
   }
   ArrayResize(tradedPatterns, size + 1);                                //--- Increase array size to add new pattern
   tradedPatterns[size].leftShoulderTime = lsTime;                       //--- Store the left shoulder time of the new pattern
   tradedPatterns[size].leftShoulderPrice = lsPrice;                     //--- Store the left shoulder price of the new pattern
   Print("Added traded pattern: Left Shoulder Time ", TimeToString(lsTime), ", Price ", DoubleToString(lsPrice, _Digits)); //--- Log addition of new pattern
}
Definimos la función «AddTradedPattern» para realizar un seguimiento de las configuraciones negociadas. Utiliza «lsTime» y «lsPrice» para registrar los detalles del hombro izquierdo, ya que este no se repinta. Comprobamos el tamaño de «tradedPatterns» con la función ArraySize. Si alcanza «MaxTradedPatterns», desplazamos los elementos hacia la izquierda para eliminar los más antiguos. Cambiamos el tamaño de «tradedPatterns» con la función «ArrayResize» para reducirlo. Registramos esto y luego ampliamos «tradedPatterns» utilizando la función ArrayResize para una nueva entrada. Establecemos «leftShoulderTime» en «lsTime» y «leftShoulderPrice» en «lsPrice». Registramos la suma con la función Print, la función TimeToString y la función DoubleToString. Tras la compilación, obtenemos el siguiente resultado.

En la imagen podemos ver que no solo visualizamos la configuración, sino que también operamos en consecuencia. El reconocimiento del patrón inverso de cabeza y hombros, la visualización y la operación comercial emplean la misma lógica, pero de manera inversa. Esta es su lógica.
// Inverse Head and Shoulders (Buy)
if (DetectInverseHeadAndShoulders(extrema, leftShoulderIdx, headIdx, rightShoulderIdx, necklineStartIdx, necklineEndIdx)) { //--- Check for inverse H&S pattern
   double closePrice = iClose(_Symbol, _Period, 1);                   //--- Get the closing price of the previous bar
   double necklinePrice = extrema[necklineEndIdx].price;              //--- Get the price of the neckline end point

   if (closePrice > necklinePrice) {                                  //--- Check if price has broken above the neckline (buy signal)
      datetime lsTime = extrema[leftShoulderIdx].time;                //--- Get the timestamp of the left shoulder
      double lsPrice = extrema[leftShoulderIdx].price;                //--- Get the price of the left shoulder

      if (IsPatternTraded(lsTime, lsPrice)) return;                   //--- Exit if this pattern has already been traded

      datetime breakoutTime = iTime(_Symbol, _Period, 1);             //--- Get the timestamp of the breakout bar (previous bar)
      int lsBar = extrema[leftShoulderIdx].bar;                       //--- Get the bar index of the left shoulder
      int headBar = extrema[headIdx].bar;                             //--- Get the bar index of the head
      int rsBar = extrema[rightShoulderIdx].bar;                      //--- Get the bar index of the right shoulder
      int necklineStartBar = extrema[necklineStartIdx].bar;           //--- Get the bar index of the neckline start
      int necklineEndBar = extrema[necklineEndIdx].bar;               //--- Get the bar index of the neckline end
      int breakoutBar = 1;                                            //--- Set breakout bar index (previous bar)

      int lsToHead = lsBar - headBar;                                 //--- Calculate number of bars from left shoulder to head
      int headToRs = headBar - rsBar;                                 //--- Calculate number of bars from head to right shoulder
      int rsToBreakout = rsBar - breakoutBar;                         //--- Calculate number of bars from right shoulder to breakout
      int lsToNeckStart = lsBar - necklineStartBar;                   //--- Calculate number of bars from left shoulder to neckline start
      double avgPatternRange = (lsToHead + headToRs) / 2.0;           //--- Calculate average bar range of the pattern for uniformity check

      if (rsToBreakout > avgPatternRange * RightShoulderBreakoutMultiplier) { //--- Check if breakout distance exceeds allowed range
         Print("Pattern rejected: Right Shoulder to Breakout (", rsToBreakout,
               ") exceeds ", RightShoulderBreakoutMultiplier, "x average range (", avgPatternRange, ")"); //--- Log rejection due to excessive breakout range
         return;                                                      //--- Exit function if pattern is invalid
      }

      double necklineStartPrice = extrema[necklineStartIdx].price;    //--- Get the price of the neckline start point
      double necklineEndPrice = extrema[necklineEndIdx].price;        //--- Get the price of the neckline end point
      datetime necklineStartTime = extrema[necklineStartIdx].time;    //--- Get the timestamp of the neckline start point
      datetime necklineEndTime = extrema[necklineEndIdx].time;        //--- Get the timestamp of the neckline end point
      int barDiff = necklineStartBar - necklineEndBar;                //--- Calculate bar difference between neckline points for slope
      double slope = (necklineEndPrice - necklineStartPrice) / barDiff; //--- Calculate the slope of the neckline (price change per bar)
      double breakoutNecklinePrice = necklineStartPrice + slope * (necklineStartBar - breakoutBar); //--- Calculate neckline price at breakout point

      // Extend neckline backwards
      int extendedBar = necklineStartBar;                             //--- Initialize extended bar index with neckline start
      datetime extendedNecklineStartTime = necklineStartTime;         //--- Initialize extended neckline start time
      double extendedNecklineStartPrice = necklineStartPrice;         //--- Initialize extended neckline start price
      bool foundCrossing = false;                                     //--- Flag to track if neckline crosses a bar within range

      for (int i = necklineStartBar + 1; i < Bars(_Symbol, _Period); i++) { //--- Loop through bars to extend neckline backwards
         double checkPrice = necklineStartPrice - slope * (i - necklineStartBar); //--- Calculate projected neckline price at bar i
         if (NecklineCrossesBar(checkPrice, i)) {                     //--- Check if neckline intersects the bar's high-low range
            int distance = i - necklineStartBar;                      //--- Calculate distance from neckline start to crossing bar
            if (distance <= avgPatternRange * RightShoulderBreakoutMultiplier) { //--- Check if crossing is within uniformity range
               extendedBar = i;                                       //--- Update extended bar index
               extendedNecklineStartTime = iTime(_Symbol, _Period, i); //--- Update extended neckline start time
               extendedNecklineStartPrice = checkPrice;              //--- Update extended neckline start price
               foundCrossing = true;                                  //--- Set flag to indicate crossing found
               Print("Neckline extended to first crossing bar within uniformity: Bar ", extendedBar); //--- Log successful extension
               break;                                                 //--- Exit loop after finding valid crossing
            } else {                                                  //--- If crossing exceeds uniformity range
               Print("Crossing bar ", i, " exceeds uniformity (", distance, " > ", avgPatternRange * RightShoulderBreakoutMultiplier, ")"); //--- Log rejection of crossing
               break;                                                 //--- Exit loop as crossing is too far
            }
         }
      }

      if (!foundCrossing) {                                           //--- If no valid crossing found within range
         int barsToExtend = 2 * lsToNeckStart;                        //--- Set fallback extension distance as twice LS to neckline start
         extendedBar = necklineStartBar + barsToExtend;               //--- Calculate extended bar index
         if (extendedBar >= Bars(_Symbol, _Period)) extendedBar = Bars(_Symbol, _Period) - 1; //--- Cap extended bar at total bars if exceeded
         extendedNecklineStartTime = iTime(_Symbol, _Period, extendedBar); //--- Update extended neckline start time
         extendedNecklineStartPrice = necklineStartPrice - slope * (extendedBar - necklineStartBar); //--- Update extended neckline start price
         Print("Neckline extended to fallback (2x LS to Neckline Start): Bar ", extendedBar, " (no crossing within uniformity)"); //--- Log fallback extension
      }

      Print("Inverse Head and Shoulders Detected:");                  //--- Log detection of inverse H&S pattern
      Print("Left Shoulder: Bar ", lsBar, ", Time ", TimeToString(lsTime), ", Price ", DoubleToString(lsPrice, _Digits)); //--- Log left shoulder details
      Print("Head: Bar ", headBar, ", Time ", TimeToString(extrema[headIdx].time), ", Price ", DoubleToString(extrema[headIdx].price, _Digits)); //--- Log head details
      Print("Right Shoulder: Bar ", rsBar, ", Time ", TimeToString(extrema[rightShoulderIdx].time), ", Price ", DoubleToString(extrema[rightShoulderIdx].price, _Digits)); //--- Log right shoulder details
      Print("Neckline Start: Bar ", necklineStartBar, ", Time ", TimeToString(necklineStartTime), ", Price ", DoubleToString(necklineStartPrice, _Digits)); //--- Log neckline start details
      Print("Neckline End: Bar ", necklineEndBar, ", Time ", TimeToString(necklineEndTime), ", Price ", DoubleToString(necklineEndPrice, _Digits)); //--- Log neckline end details
      Print("Close Price: ", DoubleToString(closePrice, _Digits));    //--- Log closing price at breakout
      Print("Breakout Time: ", TimeToString(breakoutTime));           //--- Log breakout timestamp
      Print("Neckline Price at Breakout: ", DoubleToString(breakoutNecklinePrice, _Digits)); //--- Log neckline price at breakout
      Print("Extended Neckline Start: Bar ", extendedBar, ", Time ", TimeToString(extendedNecklineStartTime), ", Price ", DoubleToString(extendedNecklineStartPrice, _Digits)); //--- Log extended neckline start details
      Print("Bar Ranges: LS to Head = ", lsToHead, ", Head to RS = ", headToRs, ", RS to Breakout = ", rsToBreakout, ", LS to Neckline Start = ", lsToNeckStart); //--- Log bar ranges for pattern analysis

      string prefix = "IHS_" + TimeToString(extrema[headIdx].time, TIME_MINUTES); //--- Create unique prefix for chart objects based on head time
      // Lines
      DrawTrendLine(prefix + "_LeftToNeckStart", lsTime, lsPrice, necklineStartTime, necklineStartPrice, clrGreen, 2, STYLE_SOLID); //--- Draw line from left shoulder to neckline start
      DrawTrendLine(prefix + "_NeckStartToHead", necklineStartTime, necklineStartPrice, extrema[headIdx].time, extrema[headIdx].price, clrGreen, 2, STYLE_SOLID); //--- Draw line from neckline start to head
      DrawTrendLine(prefix + "_HeadToNeckEnd", extrema[headIdx].time, extrema[headIdx].price, necklineEndTime, necklineEndPrice, clrGreen, 2, STYLE_SOLID); //--- Draw line from head to neckline end
      DrawTrendLine(prefix + "_NeckEndToRight", necklineEndTime, necklineEndPrice, extrema[rightShoulderIdx].time, extrema[rightShoulderIdx].price, clrGreen, 2, STYLE_SOLID); //--- Draw line from neckline end to right shoulder
      DrawTrendLine(prefix + "_Neckline", extendedNecklineStartTime, extendedNecklineStartPrice, breakoutTime, breakoutNecklinePrice, clrBlue, 2, STYLE_SOLID); //--- Draw neckline from extended start to breakout
      DrawTrendLine(prefix + "_RightToBreakout", extrema[rightShoulderIdx].time, extrema[rightShoulderIdx].price, breakoutTime, breakoutNecklinePrice, clrGreen, 2, STYLE_SOLID); //--- Draw line from right shoulder to breakout
      DrawTrendLine(prefix + "_ExtendedToLeftShoulder", extendedNecklineStartTime, extendedNecklineStartPrice, lsTime, lsPrice, clrGreen, 2, STYLE_SOLID); //--- Draw line from extended neckline to left shoulder
      // Triangles
      DrawTriangle(prefix + "_LeftShoulderTriangle", lsTime, lsPrice, necklineStartTime, necklineStartPrice, extendedNecklineStartTime, extendedNecklineStartPrice, clrLightGreen); //--- Draw triangle for left shoulder area
      DrawTriangle(prefix + "_HeadTriangle", extrema[headIdx].time, extrema[headIdx].price, necklineStartTime, necklineStartPrice, necklineEndTime, necklineEndPrice, clrLightGreen); //--- Draw triangle for head area
      DrawTriangle(prefix + "_RightShoulderTriangle", extrema[rightShoulderIdx].time, extrema[rightShoulderIdx].price, necklineEndTime, necklineEndPrice, breakoutTime, breakoutNecklinePrice, clrLightGreen); //--- Draw triangle for right shoulder area
      // Text Labels
      DrawText(prefix + "_LS_Label", lsTime, lsPrice, "LS", clrGreen, false); //--- Draw "LS" label below left shoulder
      DrawText(prefix + "_Head_Label", extrema[headIdx].time, extrema[headIdx].price, "HEAD", clrGreen, false); //--- Draw "HEAD" label below head
      DrawText(prefix + "_RS_Label", extrema[rightShoulderIdx].time, extrema[rightShoulderIdx].price, "RS", clrGreen, false); //--- Draw "RS" label below right shoulder
      datetime necklineMidTime = extendedNecklineStartTime + (breakoutTime - extendedNecklineStartTime) / 2; //--- Calculate midpoint time of the neckline
      double necklineMidPrice = extendedNecklineStartPrice + slope * (iBarShift(_Symbol, _Period, extendedNecklineStartTime) - iBarShift(_Symbol, _Period, necklineMidTime)); //--- Calculate midpoint price of the neckline
      // Calculate angle in pixel space
      int x1 = ShiftToX(iBarShift(_Symbol, _Period, extendedNecklineStartTime)); //--- Convert extended neckline start to x-pixel coordinate
      int y1 = PriceToY(extendedNecklineStartPrice);                          //--- Convert extended neckline start price to y-pixel coordinate
      int x2 = ShiftToX(iBarShift(_Symbol, _Period, breakoutTime));           //--- Convert breakout time to x-pixel coordinate
      int y2 = PriceToY(breakoutNecklinePrice);                               //--- Convert breakout price to y-pixel coordinate
      double pixelSlope = (y2 - y1) / (double)(x2 - x1);                     //--- Calculate slope in pixel space (rise over run)
      double necklineAngle = -atan(pixelSlope) * 180 / M_PI;                  //--- Calculate neckline angle in degrees, negated for visual alignment
      Print("Pixel X1: ", x1, ", Y1: ", y1, ", X2: ", x2, ", Y2: ", y2, ", Pixel Slope: ", DoubleToString(pixelSlope, 4), ", Neckline Angle: ", DoubleToString(necklineAngle, 2)); //--- Log pixel coordinates and angle
      DrawText(prefix + "_Neckline_Label", necklineMidTime, necklineMidPrice, "NECKLINE", clrBlue, true, necklineAngle); //--- Draw "NECKLINE" label at midpoint with calculated angle

      double entryPrice = 0;                                                  //--- Set entry price to 0 for market order (uses current price)
      double sl = extrema[rightShoulderIdx].price - BufferPoints * _Point;    //--- Calculate stop-loss below right shoulder with buffer
      double patternHeight = necklinePrice - extrema[headIdx].price;          //--- Calculate pattern height from neckline to head
      double tp = closePrice + patternHeight;                                 //--- Calculate take-profit above close by pattern height
      if (sl < closePrice && tp > closePrice) {                               //--- Validate trade direction (SL below, TP above for buy)
         if (obj_Trade.Buy(LotSize, _Symbol, entryPrice, sl, tp, "Inverse Head and Shoulders")) { //--- Attempt to open a buy trade
            AddTradedPattern(lsTime, lsPrice);                                //--- Add pattern to traded list
            Print("Buy Trade Opened: SL ", DoubleToString(sl, _Digits), ", TP ", DoubleToString(tp, _Digits)); //--- Log successful trade opening
         }
      }
   }
}
Ahora solo queda gestionar las posiciones abiertas aplicando una lógica de trailing stop para maximizar los beneficios. Creamos una función para gestionar la lógica final como se muestra a continuación.
//+------------------------------------------------------------------+
//| Apply trailing stop with minimum profit threshold                |
//+------------------------------------------------------------------+
void ApplyTrailingStop(int minTrailPoints, int trailingPoints, CTrade &trade_object, ulong magicNo = 0) { //--- Function to apply trailing stop to open positions
   double bid = SymbolInfoDouble(_Symbol, SYMBOL_BID);                           //--- Get current bid price
   double ask = SymbolInfoDouble(_Symbol, SYMBOL_ASK);                           //--- Get current ask price

   for (int i = PositionsTotal() - 1; i >= 0; i--) {                             //--- Loop through all open positions from last to first
      ulong ticket = PositionGetTicket(i);                                       //--- Retrieve position ticket number
      if (ticket > 0 && PositionSelectByTicket(ticket)) {                        //--- Check if ticket is valid and select the position
         if (PositionGetString(POSITION_SYMBOL) == _Symbol &&                    //--- Verify position is for the current symbol
             (magicNo == 0 || PositionGetInteger(POSITION_MAGIC) == magicNo)) {  //--- Check if magic number matches or no magic filter applied
            double openPrice = PositionGetDouble(POSITION_PRICE_OPEN);           //--- Get position opening price
            double currentSL = PositionGetDouble(POSITION_SL);                   //--- Get current stop-loss price
            double currentProfit = PositionGetDouble(POSITION_PROFIT) / (LotSize * SymbolInfoDouble(_Symbol, SYMBOL_TRADE_TICK_VALUE)); //--- Calculate profit in points

            if (PositionGetInteger(POSITION_TYPE) == POSITION_TYPE_BUY) {         //--- Check if position is a Buy
               double profitPoints = (bid - openPrice) / _Point;                 //--- Calculate profit in points for Buy position
               if (profitPoints >= minTrailPoints + trailingPoints) {            //--- Check if profit exceeds minimum threshold for trailing
                  double newSL = NormalizeDouble(bid - trailingPoints * _Point, _Digits); //--- Calculate new stop-loss price
                  if (newSL > openPrice && (newSL > currentSL || currentSL == 0)) { //--- Ensure new SL is above open price and better than current SL
                     if (trade_object.PositionModify(ticket, newSL, PositionGetDouble(POSITION_TP))) { //--- Attempt to modify position with new SL
                        Print("Trailing Stop Updated: Ticket ", ticket, ", New SL: ", DoubleToString(newSL, _Digits)); //--- Log successful SL update
                     }
                  }
               }
            } else if (PositionGetInteger(POSITION_TYPE) == POSITION_TYPE_SELL) { //--- Check if position is a Sell
               double profitPoints = (openPrice - ask) / _Point;                 //--- Calculate profit in points for Sell position
               if (profitPoints >= minTrailPoints + trailingPoints) {            //--- Check if profit exceeds minimum threshold for trailing
                  double newSL = NormalizeDouble(ask + trailingPoints * _Point, _Digits); //--- Calculate new stop-loss price
                  if (newSL < openPrice && (newSL < currentSL || currentSL == 0)) { //--- Ensure new SL is below open price and better than current SL
                     if (trade_object.PositionModify(ticket, newSL, PositionGetDouble(POSITION_TP))) { //--- Attempt to modify position with new SL
                        Print("Trailing Stop Updated: Ticket ", ticket, ", New SL: ", DoubleToString(newSL, _Digits)); //--- Log successful SL update
                     }
                  }
               }
            }
         }
      }
   }
}
Aquí, añadimos una función de stop dinámico con la función «ApplyTrailingStop». Utiliza «minTrailPoints» y «trailingPoints» para ajustar las posiciones abiertas. Obtenemos los precios de «compra» y «venta» con la función SymbolInfoDouble. Recorremos las posiciones utilizando la función PositionsTotal. Para cada uno, obtenemos el «ticket» con la función PositionGetTicket y lo seleccionamos con la función PositionSelectByTicket. Verificamos el símbolo y «magicNo» utilizando las funciones «PositionGetString» y «PositionGetInteger». Recuperamos «openPrice», «currentSL» y «currentProfit» con la función PositionGetDouble.
Para una compra, calculamos la ganancia con la «oferta» y la comparamos con «minTrailPoints» más «trailingPoints». Si se cumple, establecemos un nuevo «newSL» con la función NormalizeDouble y lo actualizamos mediante el método «PositionModify» en el objeto «trade_object». Para una venta, utilizamos «ask» en su lugar y ajustamos «newSL» a continuación. Se registra la modificación de precio correcta. A continuación, podemos llamar a esta función en el controlador de eventos OnTick.
// Apply trailing stop if enabled and positions exist
if (UseTrailingStop && PositionsTotal() > 0) {                        //--- Check if trailing stop is enabled and there are open positions
   ApplyTrailingStop(MinTrailPoints, TrailingPoints, obj_Trade, MagicNumber); //--- Apply trailing stop to positions with specified parameters
}
Lo único que necesitamos para asegurarnos de que el trailing stop esté habilitado es llamar a la función con los parámetros de entrada. Lo que queda ahora es liberar las matrices de almacenamiento una vez que el programa ya no se utilice y eliminar los objetos visuales que hemos mapeado. Nos ocupamos de eso en el controlador de eventos OnDeinit.
//+------------------------------------------------------------------+
//| Expert deinitialization function                                 |
//+------------------------------------------------------------------+
void OnDeinit(const int reason) {                                        //--- Expert Advisor deinitialization function
   ArrayFree(tradedPatterns);                                            //--- Free memory used by tradedPatterns array
   ObjectsDeleteAll(0, "HS_");                                           //--- Delete all chart objects with "HS_" prefix (standard H&S)
   ObjectsDeleteAll(0, "IHS_");                                          //--- Delete all chart objects with "IHS_" prefix (inverse H&S)
   ChartRedraw();                                                        //--- Redraw the chart to remove deleted objects
}
En el controlador de eventos OnDeinit, que se ejecuta cuando se cierra el Asesor Experto, limpiamos el programa y el gráfico al que está vinculado. Utilizamos la función ArrayFree para liberar memoria de «tradedPatterns». A continuación, eliminamos todos los objetos del gráfico. La función ObjectsDeleteAll borra los elementos con el prefijo «HS_» para los patrones estándar. También elimina aquellos con el prefijo «IHS_» para patrones inversos. Por último, actualizamos el gráfico. La función ChartRedraw actualiza la visualización para reflejar estos cambios antes del cierre total. Tras la compilación, obtenemos el siguiente resultado.

En la imagen podemos ver que aplicamos un trailing stop a la configuración negociada, logrando así nuestro objetivo. Lo que queda por hacer es realizar pruebas retrospectivas del programa, lo cual se aborda en la siguiente sección.
Prueba retrospectiva
Tras realizar exhaustivas pruebas retrospectivas, hemos obtenido los siguientes resultados.
Gráfico de prueba retrospectiva:

Informe de prueba retrospectiva:

Conclusión
En conclusión, hemos creado con éxito un algoritmo de trading Hombro-Cabeza-Hombro en MQL5. Cuenta con detección precisa de patrones, visualización detallada y ejecución automatizada de operaciones para la señal de reversión clásica. Mediante el uso de reglas de validación, trazado de cuellos y stops dinámicos, nuestro Asesor Experto se adapta eficazmente a los cambios del mercado. Puede utilizar las ilustraciones como punto de partida para mejorarlo con pasos adicionales, como el ajuste de parámetros o controles de riesgo avanzados. Además, hay que tener en cuenta que se trata de una configuración de patrón poco habitual.
Descargo de responsabilidad: Este artículo tiene fines exclusivamente educativos. El trading conlleva un riesgo financiero significativo y las condiciones del mercado pueden ser impredecibles. Es esencial realizar pruebas retrospectivas adecuadas y gestionar los riesgos antes de la implementación en vivo.
Con esta base, podrá perfeccionar sus habilidades comerciales y mejorar este algoritmo. Siga probando y optimizando para alcanzar el éxito. ¡Mucha suerte!
Traducción del inglés realizada por MetaQuotes Ltd.
Artículo original: https://www.mql5.com/en/articles/17618
Advertencia: todos los derechos de estos materiales pertenecen a MetaQuotes Ltd. Queda totalmente prohibido el copiado total o parcial.
Este artículo ha sido escrito por un usuario del sitio web y refleja su punto de vista personal. MetaQuotes Ltd. no se responsabiliza de la exactitud de la información ofrecida, ni de las posibles consecuencias del uso de las soluciones, estrategias o recomendaciones descritas.

- Aplicaciones de trading gratuitas
- 8 000+ señales para copiar
- Noticias económicas para analizar los mercados financieros
Usted acepta la política del sitio web y las condiciones de uso