ZigZag Lines MTF
- Göstergeler
- Sürüm: 6.5
- Güncellendi: 19 Temmuz 2026
- Etkinleştirmeler: 10

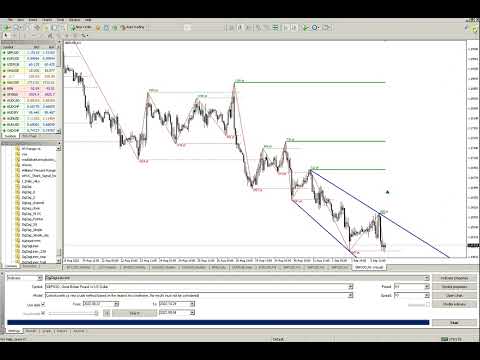
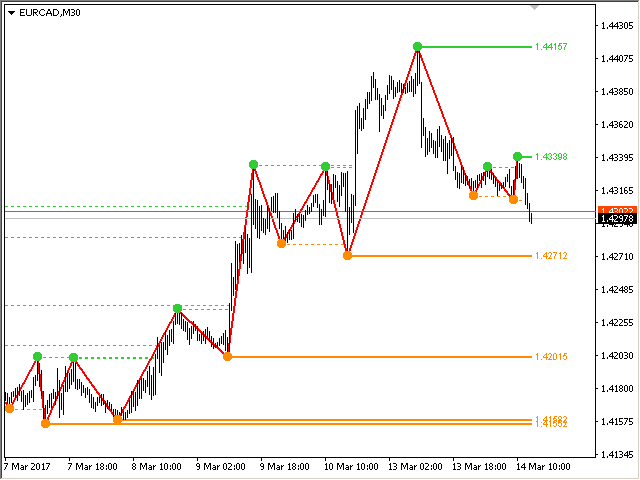
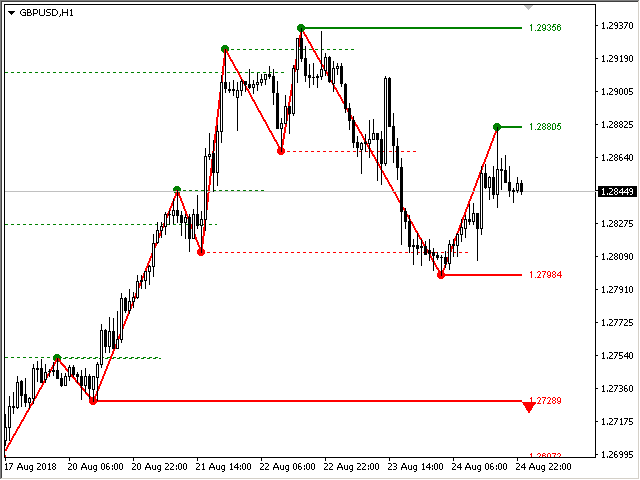
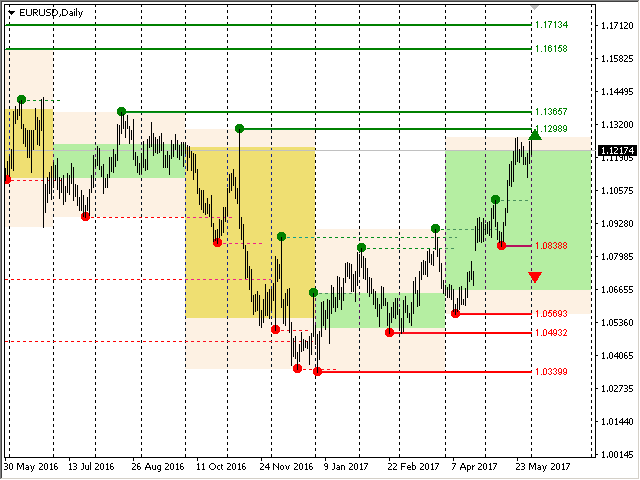
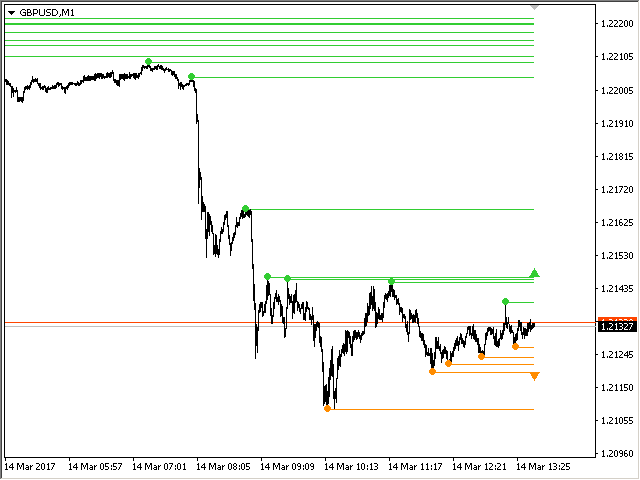
Çoklu zaman dilimi ZigZag göstergesi. Destek/direnç yatay çizgilerini ve bunların kırılmalarını gösterir, ayrıca piyasanın mevcut hedeflerini de çizer. Ayrıca Fraktallar göstergesinin çizgilerini ve diğer dönemlere ait mumları da görüntüleyebilir (Üç Aylığa kadar). Gösterge – Trend çizgilerini göstermek için önemli dip ve tepe noktalarını birbirine bağlar.
Gösterge son (geçerli) noktayı yeniden çizer ve bazı durumlarda son 2-3 noktayı değiştirebilir.
Tüm çizgiler nesneler olarak çizilir (gösterge arabellekleri değil, ancak EA için veri alma olasılığı vardır).
Uzman Danışmanda kullanıldığında, iCustom'u kullanarak ZigZag noktalarını okuyabilirsiniz
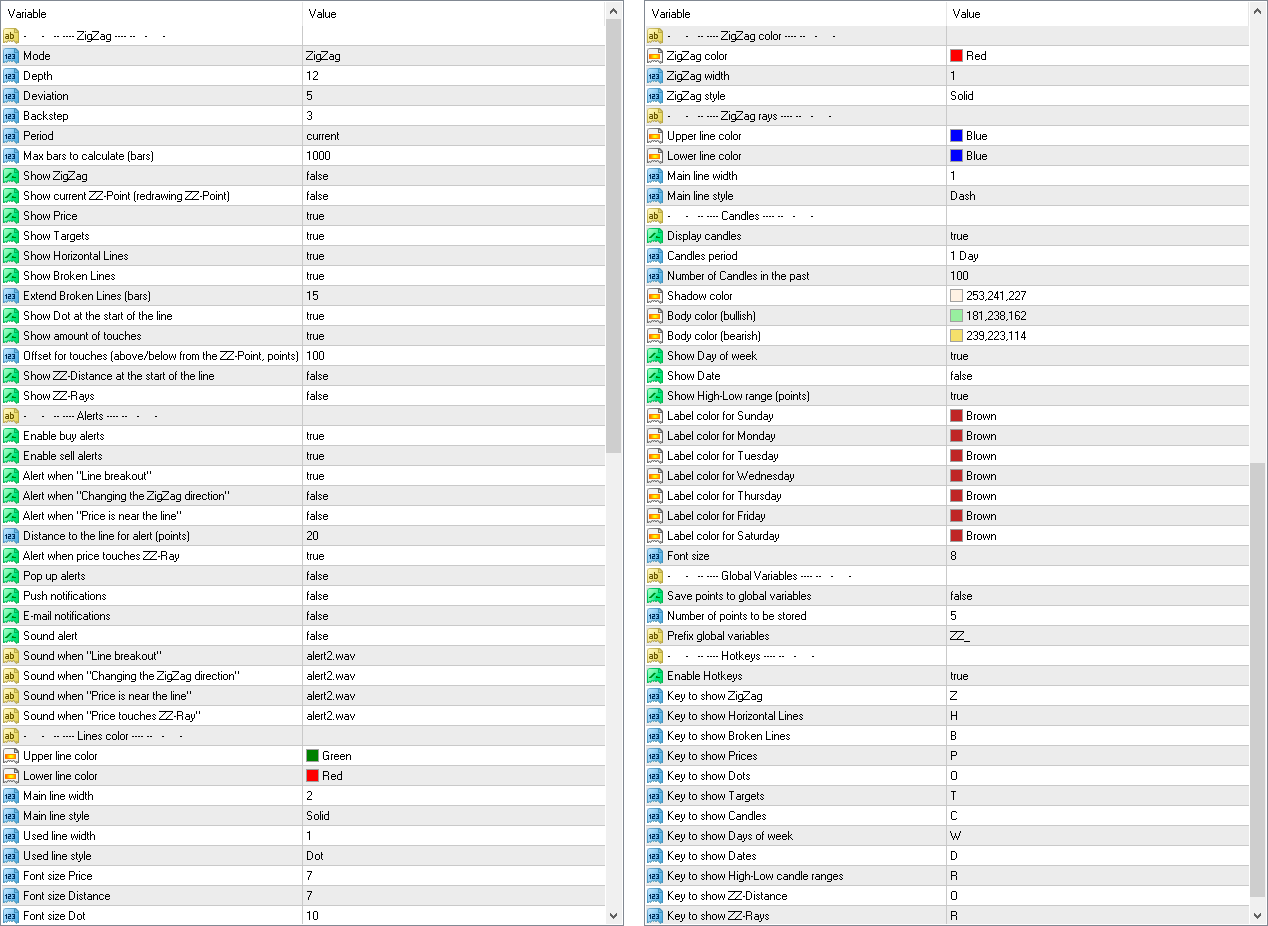
Ayarlar
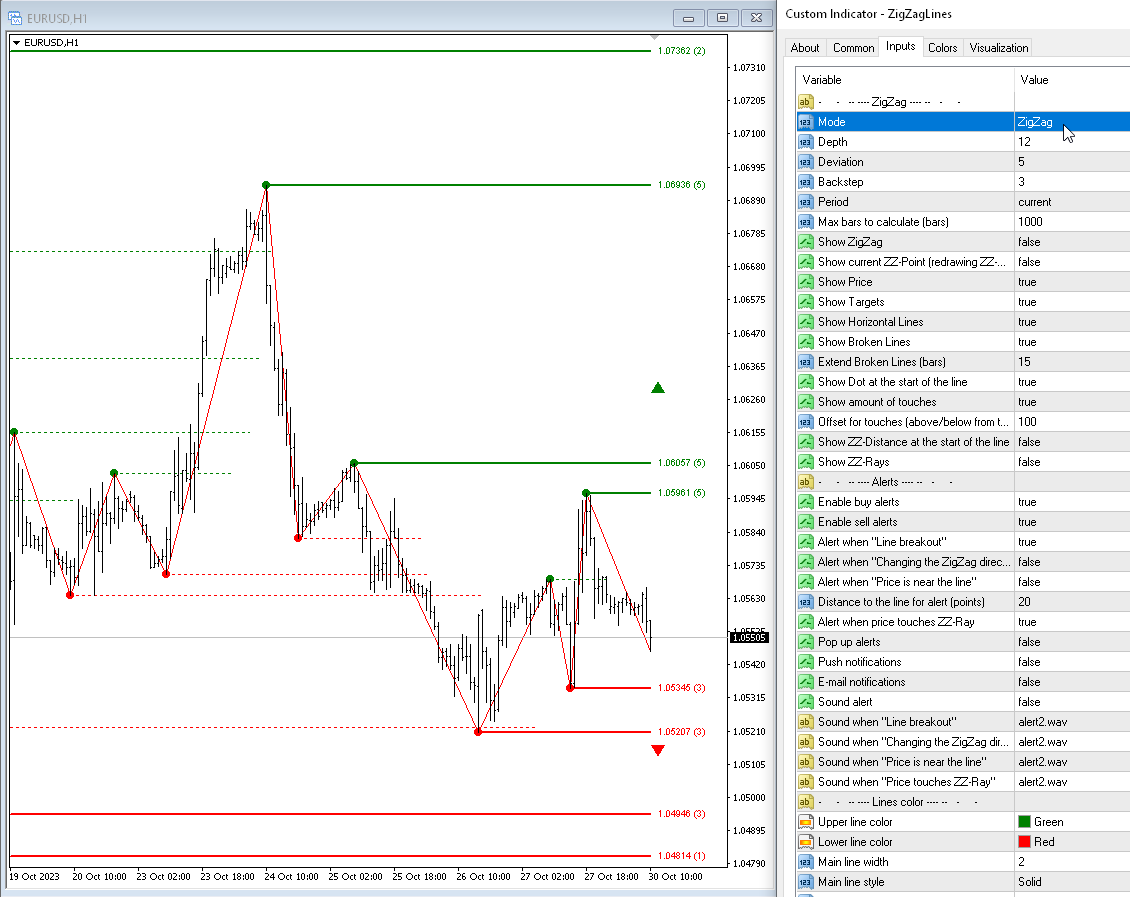
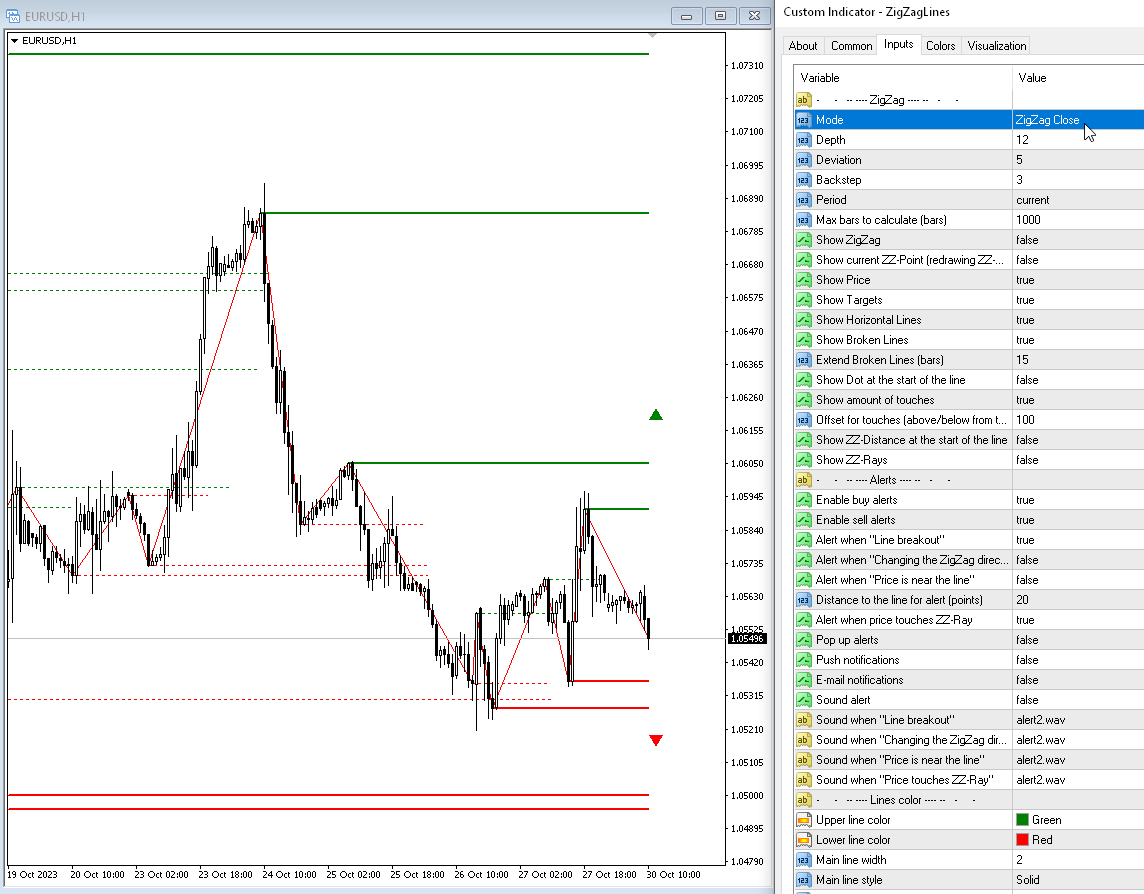
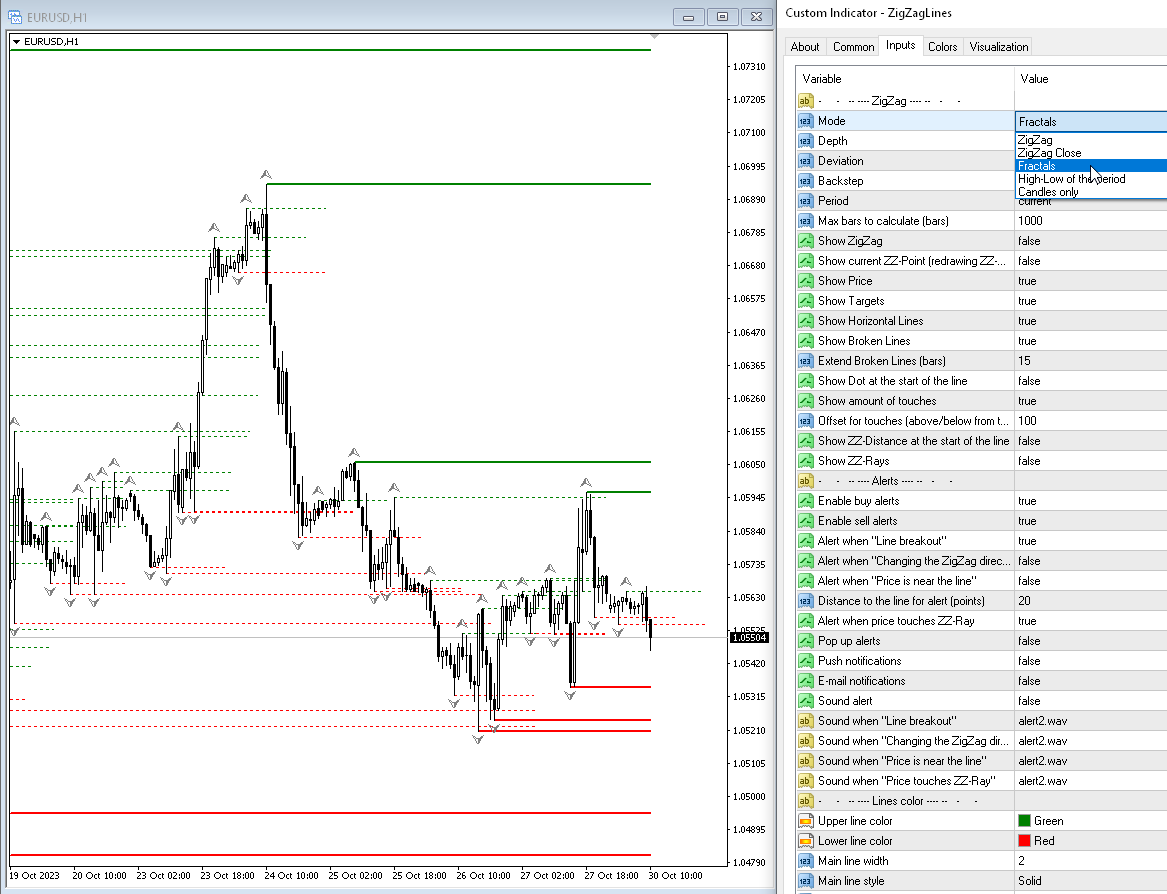
Mode — Destek ve direnç seviyelerini hesaplayın:
— Zig Zag — ZigZag göstergesi;— ZigZag Close — ZigZag Kapatma göstergesi;— Fractals — Fraktallar göstergesi;— High-Low of the period — yüksek-düşük seviyelere göre bir gösterge oluşturmak. Zaman çerçevesi Dönem parametresinde belirtilir;— Candles only — yalnızca Mumları çizin;
Depth — eğer sonuncusu öncekinden daha az (veya daha büyük) Sapma ise, Zigzag'ın ikinci maksimumu (veya minimumu) çekmeyeceği minimum mum çubuğu sayısı;
Deviation — Zigzag'ın yerel bir tepe/dip oluşturması için iki bitişik mum çubuğunun Yüksek/Düşük noktaları arasındaki minimum nokta sayısı;
Backstep — yerel Yüksekler/Düşükler arasındaki minimum mum çubuğu sayısı;
Period — Fraktalların ZigZag'ının hesaplanması için dönem;
Max bars to calculate (bars) — hesaplama için maksimum çubuk sayısı. Bu sınırlama hesaplamaları hızlandırmak için getirilmiştir;
Grafikte görüntüle
Show Zigzag — ZigZag'ı göster;
Show current ZZ-point (redrawing point) — geçerli (son) noktayı göster;
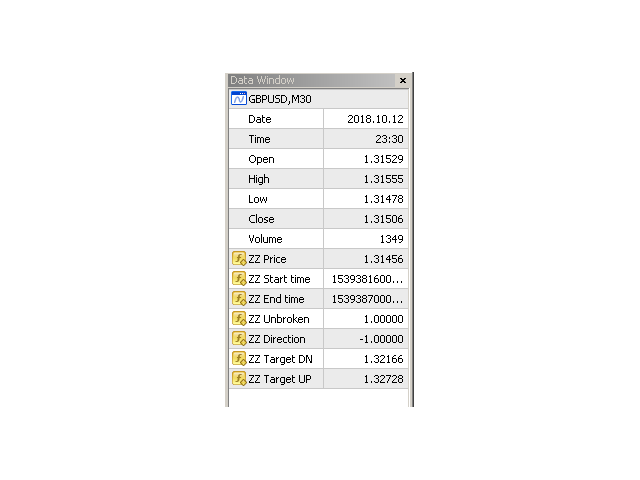
Show Price — seviyelerin fiyatını gösterin;
Show Targets — mevcut hedefleri gösterin (piyasanın nereye gittiğini);
Show broken lines) — kesikli seviyeleri gösterir;
Check the breakout of the Lines by price — Hatların dağılımını fiyata göre kontrol edin:
- High-Low (current bar) — Yüksek-Düşük (mevcut çubuk)
- High-Low (previous bar) — Yüksek-Düşük (önceki çubuk)
- Close (previous bar) — Kapat (önceki çubuk)
- Open (current bar) — Açık (geçerli çubuk)
Extend broken lines (bars) — kesik çizgileri belirtilen sayıda çubuk kadar sağa doğru uzatın;
Show Dot at the start of the line — göstergenin dönüş noktalarında noktaları görüntüleyin;
Show amount of touches — satır fiyatına yakın dokunma sayısını gösterin;
Offset for touches (above/below from the ZZ-point, points) — ZZ noktasının seviyeye temas ettiği kabul edilecek aralık.
Uyarılar
Pop up alerts — bir seviyeye dokunduğunuzda açılan uyarı;
Push notifications — Anında bildirim;
E-mail notifications — e-postayla bildirim;
Sound alert — bir seviyeye dokunduğunuzda sesli uyarı;
Alert when "Line breakout" — ZigZag seviyesi kırıldığında uyarı;
Alert when "Changing the ZigZag direction" — ZigZag yönünü değiştirirken uyarı ver;
Alert when "Price is near the line" — fiyat seviyeye yakınsa uyarı ver (çubuk olduğunda ZigZag'ın mevcut noktası kontrol edilmez);
Distance to the line for alert (points) — uyarı için mesafe (puan olarak);
Renkler
Upper line color — üst çizgilerin rengi;
Lower line color — alt çizgilerin rengi;
Main line width — ana çizginin genişliği;
Main line style — ana çizginin stili;
Used line width — kullanılan çizginin genişliği;
Used line style — kullanılan çizginin stili;
Font size price — Fiyatlar için yazı tipi boyutu;
Font size dot — Noktalar için yazı tipi boyutu;
ZigZag color — ZigZagа'nın rengi;
ZigZag width — ZigZag çizgilerinin genişliği;
ZigZag style — ZigZag çizgilerinin stili;
Mumlar
Display candles — diğer dönemlere ait mumların görüntülenmesini etkinleştirin;
Candles period — mum dönemi, tüm standart olanlar artı Üç Aylık;
Number of Candles in the past — grafikteki mum sayısı;
Shadow color — mum fitillerinin mumu;
Body color (bullish) — yükseliş mumunun gövde mumu;
Body color (bearish) — düşüş mumunun gövde rengi;
Save points to global variables — noktaları terminalin Global Değişkenlerinde saklayın;
Number of points to be stored — saklanacak nokta sayısı (mevcut nokta sıfırdır);
Prefix global variables — Genel Değişken adlarının öneki.


This is a brilliant indicator with a huge versatility in specific options. It can draw zigzag from a higher time frame and candles from a higher timeframe, whilst showing levels from the zigzag (or fractals etc.) Colours and so on can be individually specified to give what you need and keep a clean chart. It has too many uses to go into details but an invaluable tool if you use zigzag, candles or liquidity levels. Taras is helpful and skilled, he was able to update to show candles only closed of htf, which I suggested, in a few hours. Look at his other items too!