ZigZag Lines MTF
- Indicadores
- Versão: 6.5
- Atualizado: 19 julho 2026
- Ativações: 10

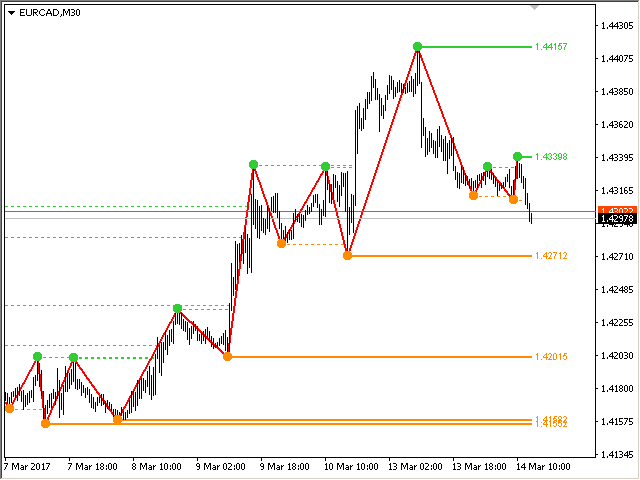
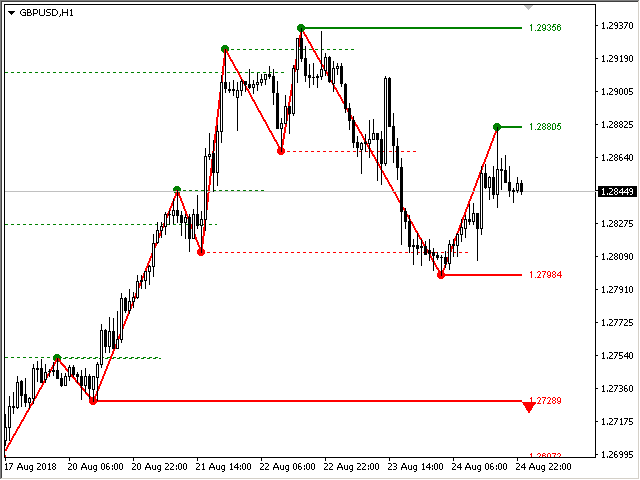
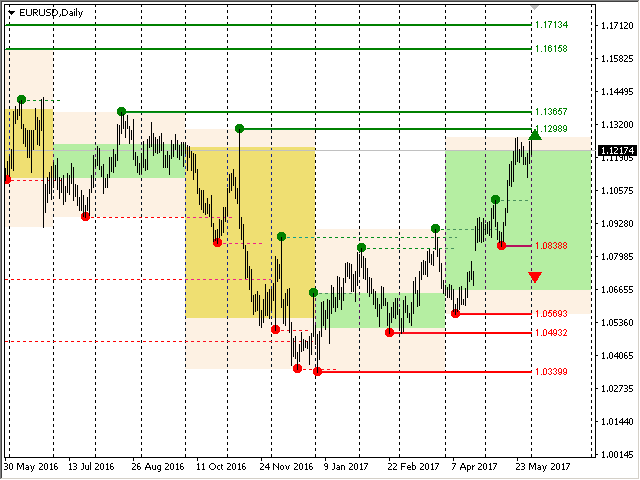
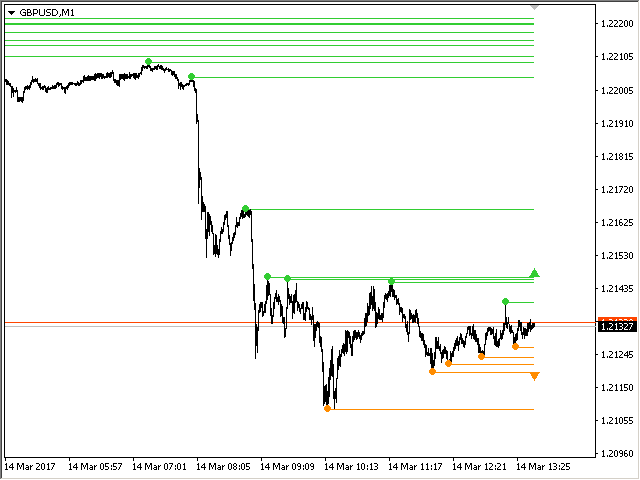
Indicador ZigZag de vários períodos de tempo. Ele exibe as linhas horizontais de suporte/resistência e seus rompimentos, bem como desenha as metas atuais do mercado. Também pode exibir linhas do indicador Fractais e velas de outros períodos (até Trimestral). Indicador – conecta máximas e mínimas importantes para mostrar linhas de tendência.
O indicador redesenha o último ponto (atual) e, em alguns casos, pode alterar os últimos 2-3 pontos.
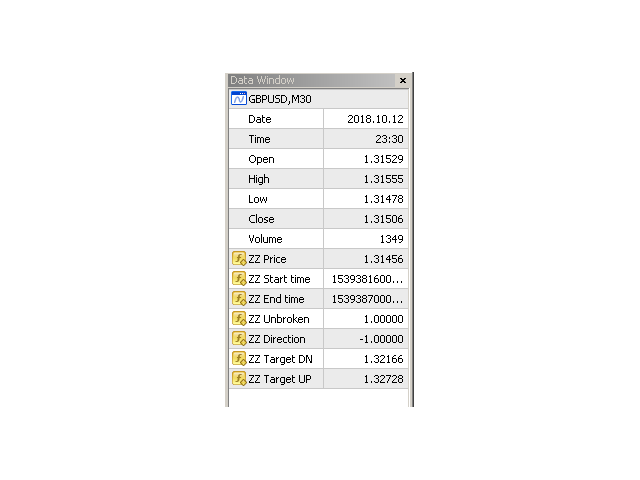
Todas as linhas são desenhadas como objetos (não buffers de indicadores, mas existe a possibilidade de receber os dados para o EA).
Quando usado em um Expert Advisor, você pode ler pontos ZigZag usando iCustom
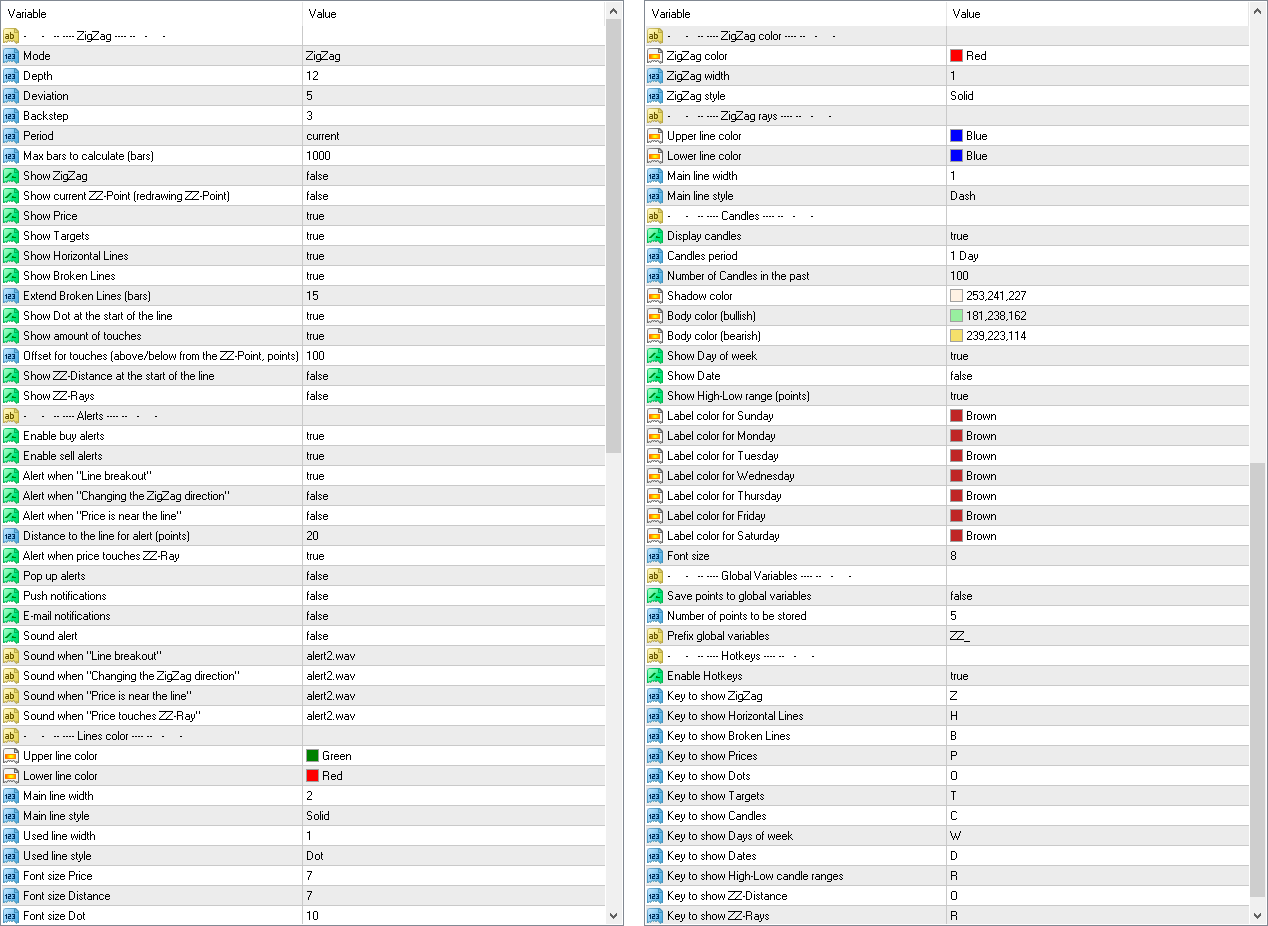
Configurações
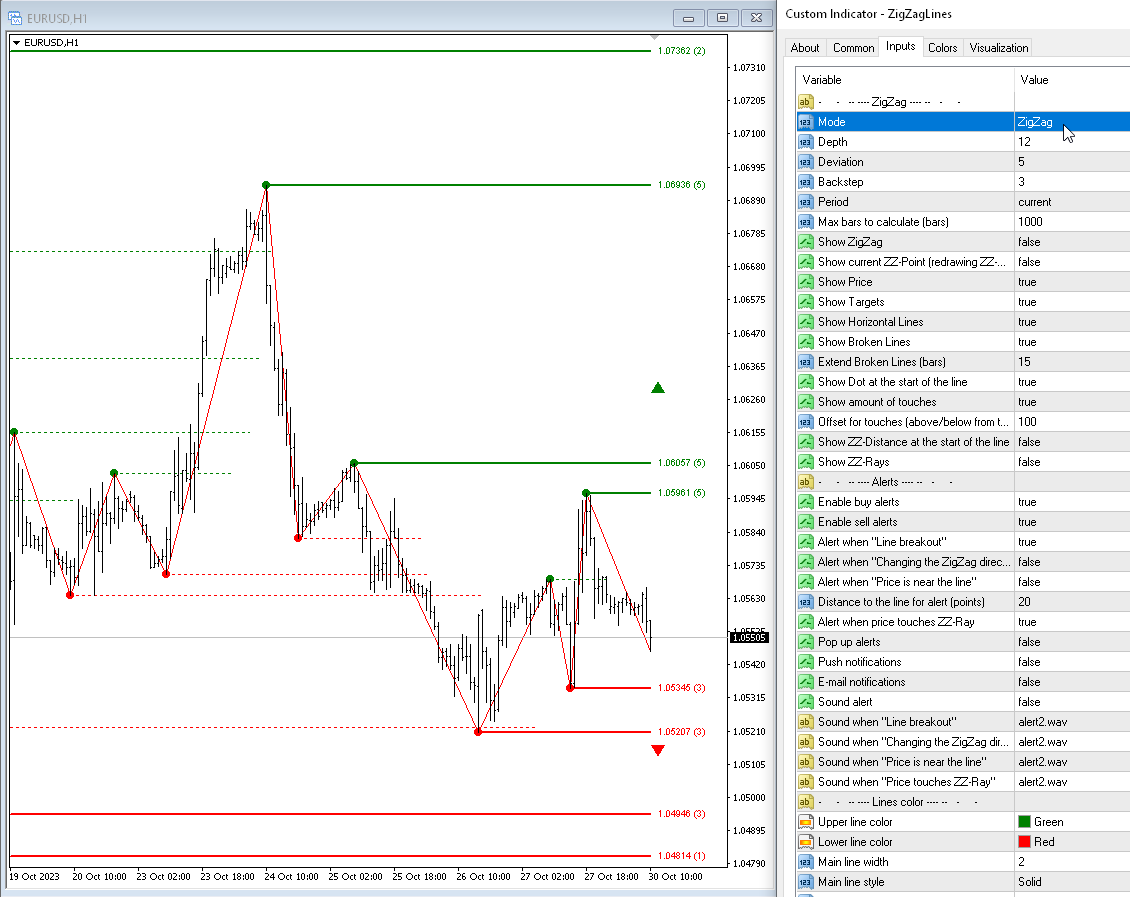
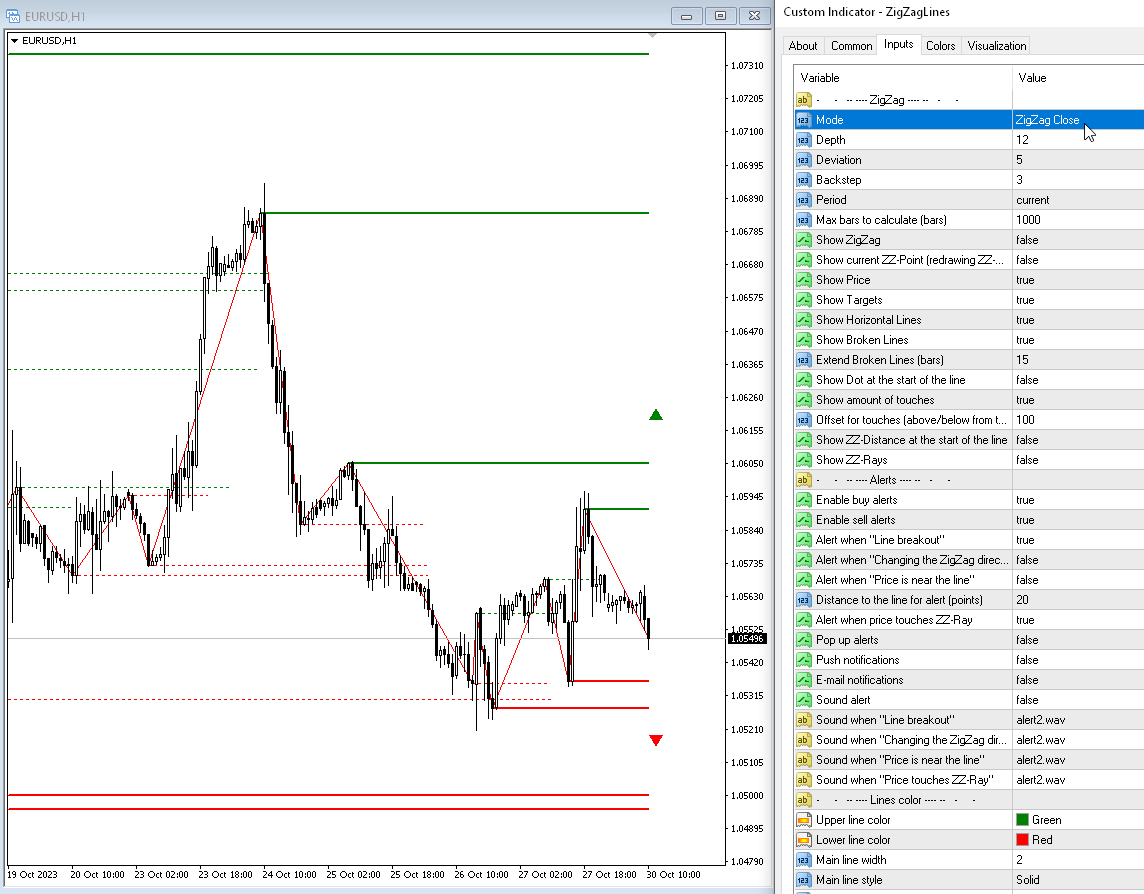
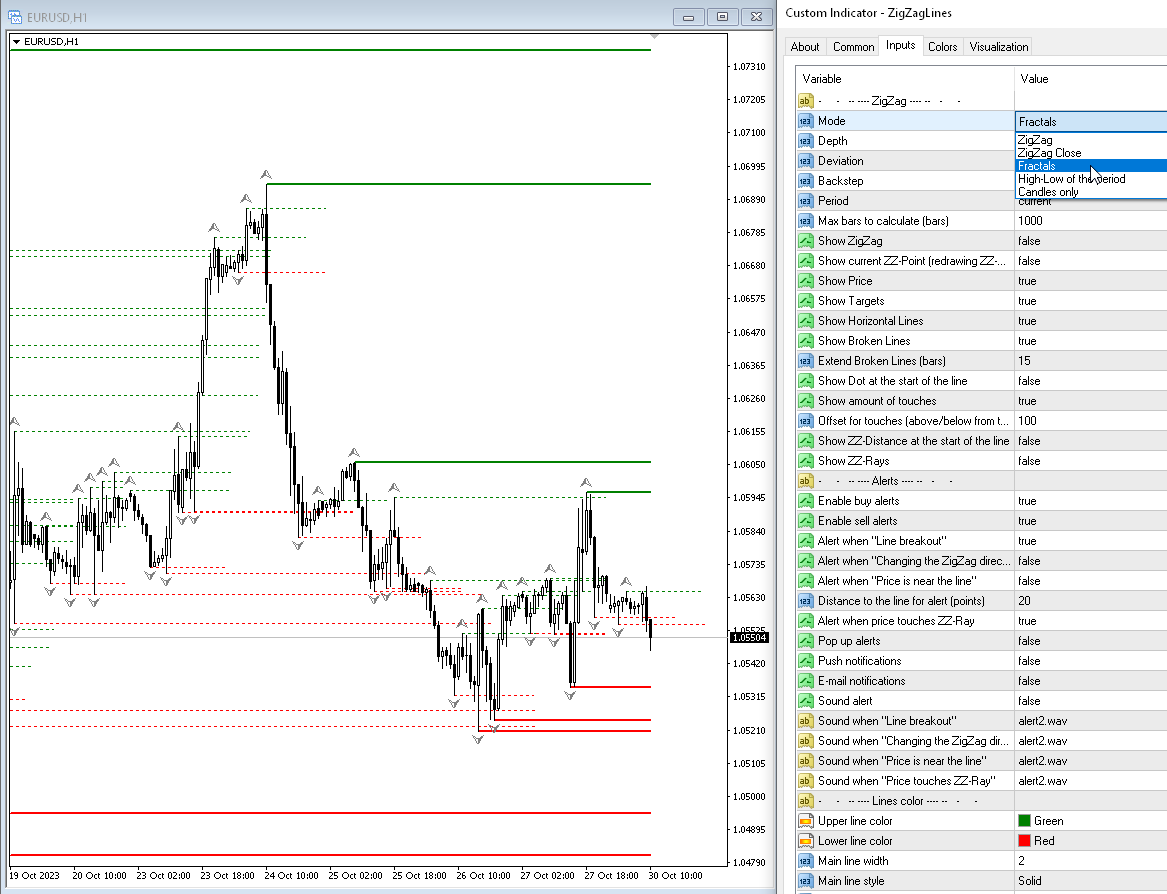
Mode — calcular níveis de suporte e resistência com base em:
— Zig Zag — o indicador ZigZag;— ZigZag Close — o indicador ZigZag Close;— Fractals — o indicador Fractais;— High-Low of the period — construção de um indicador por níveis high-low. O prazo é especificado no parâmetro Período;— Candles only — desenhe apenas velas;
Depth — número mínimo de velas, para as quais o Zigzag não sorteará o segundo máximo (ou mínimo), se o último for Desvio menor (ou maior) que o anterior;
Deviation — o número mínimo de pontos entre os Máximos/Mínimos de duas velas adjacentes para que o Ziguezague forme um topo/fundo local;
Backstep — o número mínimo de velas entre os máximos/mínimos locais;
Period — período para cálculo do ZigZag de Fractais;
Max bars to calculate (bars) — o número máximo de barras para cálculo. Esta limitação é introduzida para agilizar os cálculos;
Exibir no gráfico
Show Zigzag — mostra o Ziguezague;
Show current ZZ-point (redrawing point) — mostrar ponto atual (último);
Show Price — mostra o preço dos níveis;
Show Targets — mostra as metas atuais (para onde o mercado está indo);
Show broken lines) — mostra os níveis quebrados;
Check the breakout of the Lines by price — Confira o desdobramento das Linhas por preço:
- High-Low (current bar) — Alto-Baixo (barra atual)
- High-Low (previous bar) — Alto-baixo (barra anterior)
- Close (previous bar) — Fechar (barra anterior)
- Open (current bar) — Aberto (barra atual)
Extend broken lines (bars) — estende as linhas quebradas para a direita pelo número especificado de barras;
Show Dot at the start of the line — exibe pontos nos pontos de viragem do indicador;
Show amount of touches — mostra a quantidade de toques próximo ao preço da linha;
Offset for touches (above/below from the ZZ-point, points) — a faixa na qual o ponto ZZ será considerado como tocando o nível.
Alertas
Pop up alerts — alerta pop-up ao tocar em um nível;
Push notifications — Notificação push;
E-mail notifications — notificação por e-mail;
Sound alert — alerta sonoro ao tocar em um nível;
Alert when "Line breakout" — alerta quando o nível do ZigZag for rompido;
Alert when "Changing the ZigZag direction" — alerta ao mudar a direção do ZigZag;
Alert when "Price is near the line" — alerta se o preço estiver próximo do nível (uma vez na barra, o ponto atual do ZigZag não é verificado);
Distance to the line for alert (points) — distância para alerta (em pontos);
Cores
Upper line color — cor das linhas superiores;
Lower line color — cor das linhas inferiores;
Main line width — largura da linha principal;
Main line style — estilo da linha principal;
Used line width — largura da linha usada;
Used line style — estilo da linha usada;
Font size price — tamanho da fonte dos Preços;
Font size dot — tamanho da fonte dos pontos;
ZigZag color — cor do ZigZagа;
ZigZag width — largura das linhas ZigZag;
ZigZag style — estilo das linhas ZigZag;
Velas
Display candles — habilita a exibição de velas de outros períodos;
Candles period — período das velas, todas padrão mais Trimestral;
Number of Candles in the past — o número de velas no gráfico;
Shadow color — vela dos pavios da vela;
Body color (bullish) — vela do corpo de uma vela de alta;
Body color (bearish) — cor do corpo de uma vela de baixa;
Save points to global variables — armazena pontos nas Variáveis Globais do terminal;
Number of points to be stored — número de pontos a serem armazenados (o ponto atual é zero);
Prefix global variables — prefixo para nomes de variáveis globais.
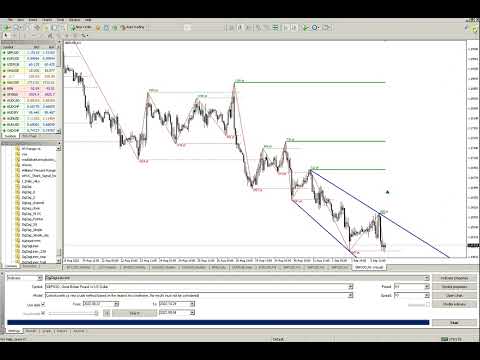


This is a brilliant indicator with a huge versatility in specific options. It can draw zigzag from a higher time frame and candles from a higher timeframe, whilst showing levels from the zigzag (or fractals etc.) Colours and so on can be individually specified to give what you need and keep a clean chart. It has too many uses to go into details but an invaluable tool if you use zigzag, candles or liquidity levels. Taras is helpful and skilled, he was able to update to show candles only closed of htf, which I suggested, in a few hours. Look at his other items too!