ZigZag Lines MTF
- 指标
- 版本: 6.5
- 更新: 19 七月 2026
- 激活: 10

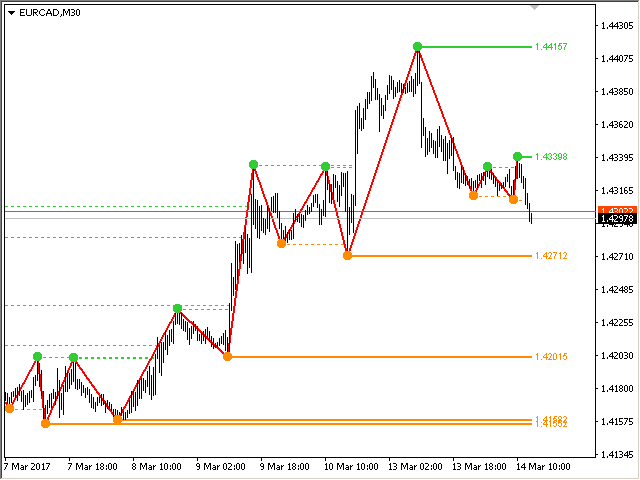
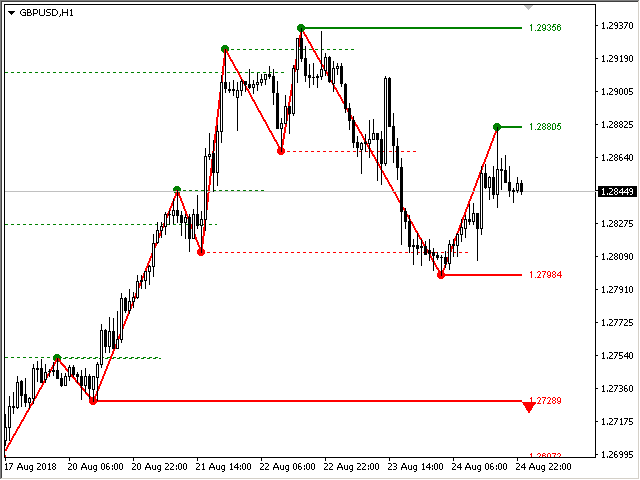
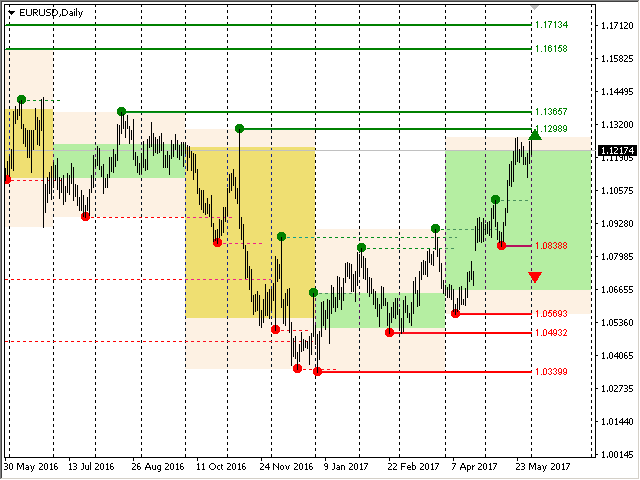
多时间框架锯齿形调整浪指标。 它显示支撑/阻力水平线及其突破,并绘制当前的市场目标。 它还可以显示分形指标的线条和其他时期(最多季度)的蜡烛。指标——连接关键低点和高点以显示趋势线。
该指标重新绘制最后一个(当前)点,并且在某些情况下可以更改最后 2-3 个点。
所有线条均绘制为对象(不是指标缓冲区,但有可能接收 EA 的数据).
在 Expert Advisor 中使用时,您可以使用 iCustom 读取 ZigZag 点
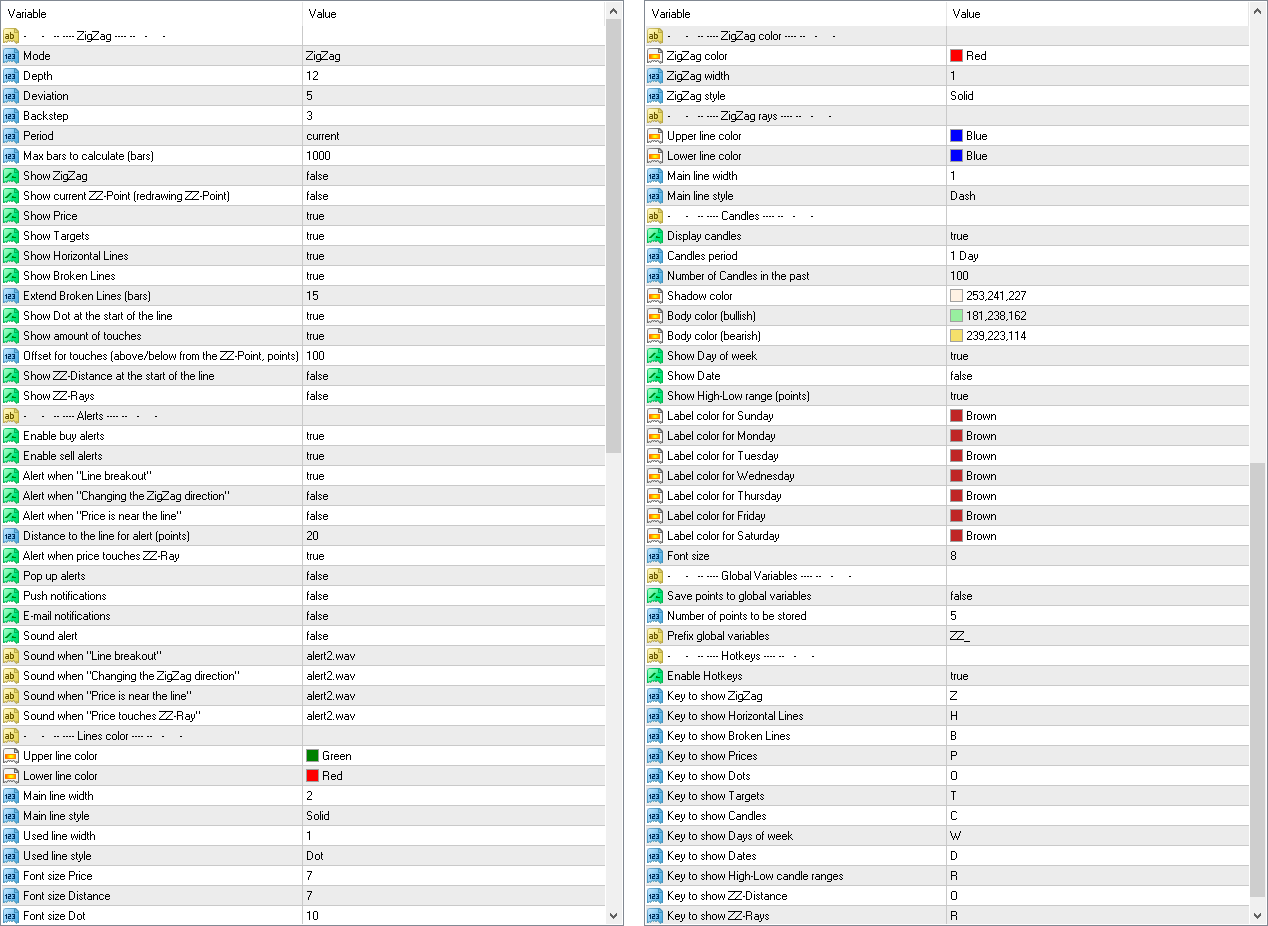
设置
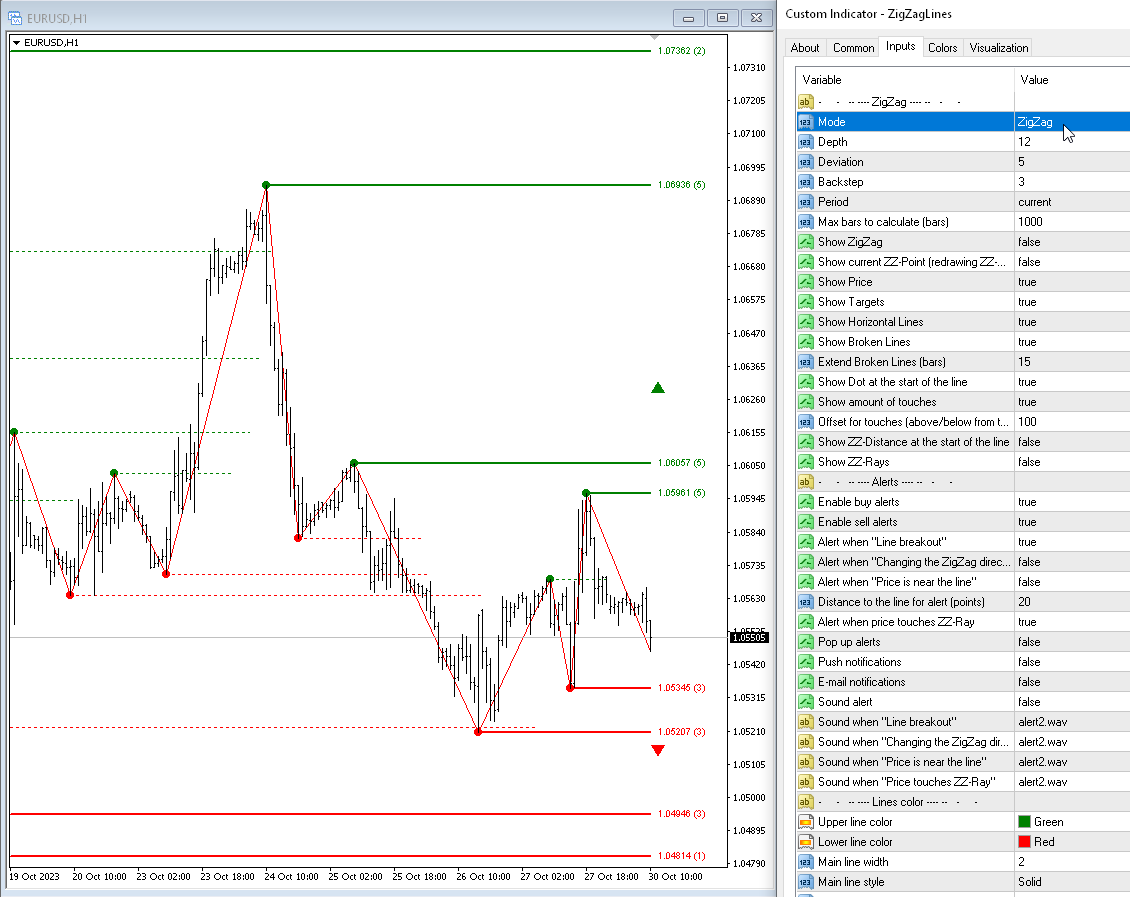
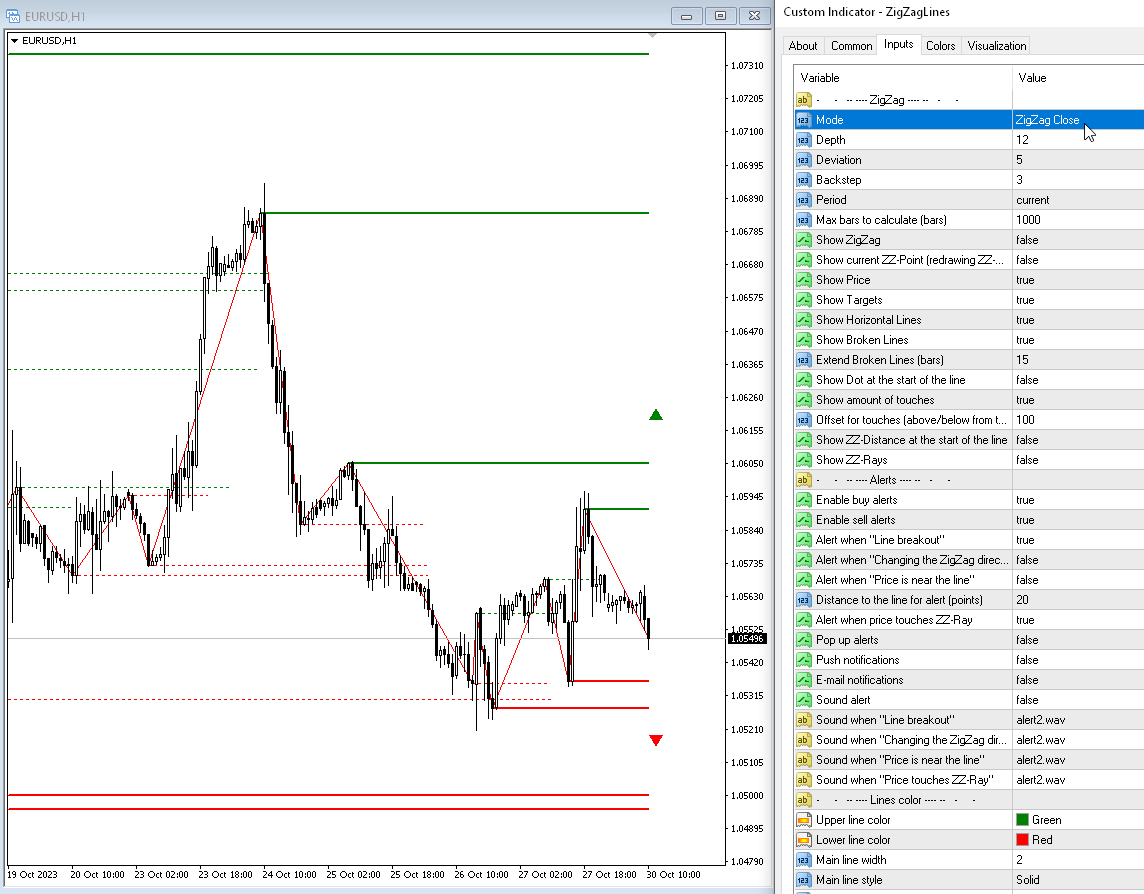
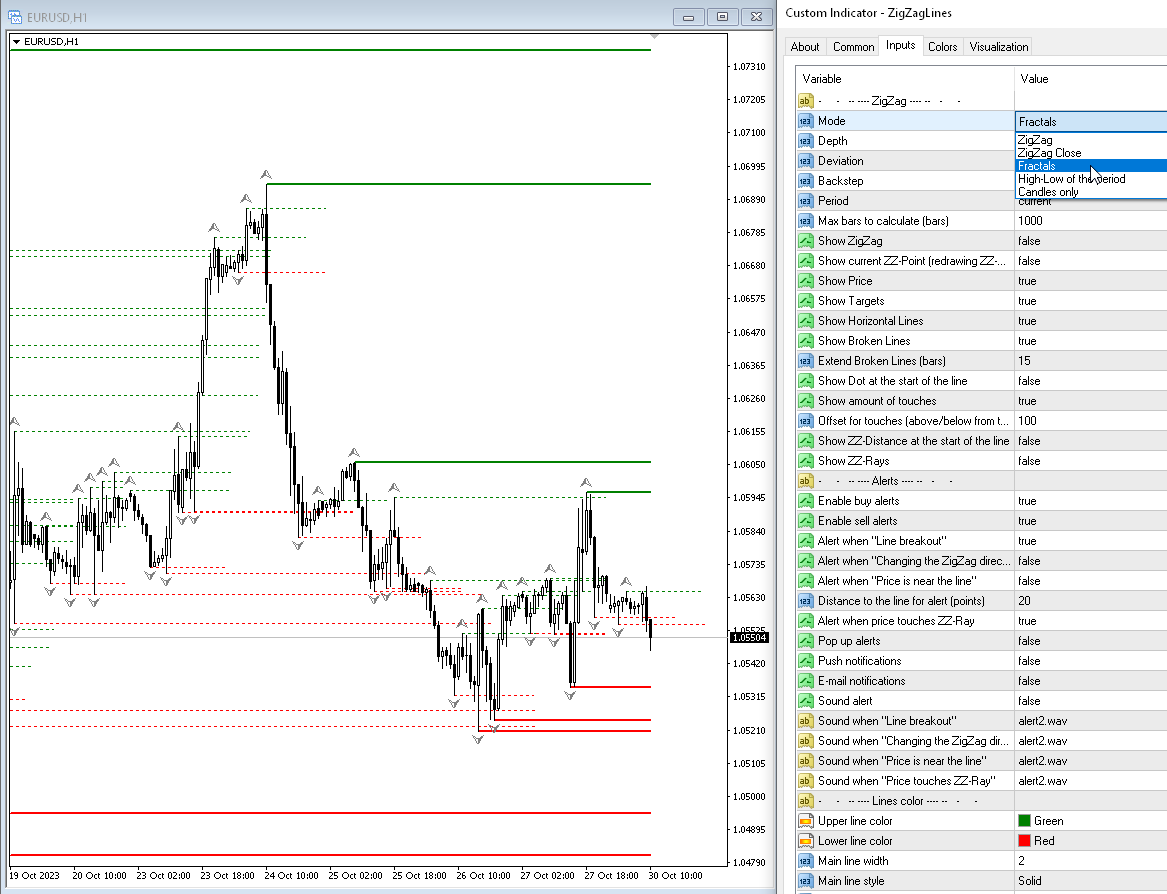
Mode — 根据计算支撑位和阻力位:
— Zig Zag — ZigZag 指标;— ZigZag Close — 之字折线收盘指标;— Fractals — 分形指标;— High-Low of the period — 通过高低水平构建指标。 时间范围在Period参数中指定;— Candles only — 仅绘制蜡烛;
Depth — 如果最后一根蜡烛的偏差小于(或大于)前一根,则 Zigzag 将不会绘制第二个最大值(或最小值)的烛台的最小数量;
Deviation — 锯齿形形成局部顶部/底部的两个相邻烛台的最高点/最低点之间的最小点数;
Backstep — 局部高点/低点之间的最小烛台数量;
Period — 分形锯齿形调整浪的计算周期;
Max bars to calculate (bars) — 用于计算的最大柱数。 引入这个限制是为了加快计算速度;
显示在图表上
Show Zigzag — 显示之字折线;
Show current ZZ-point (redrawing point) — 显示当前(最后一个)点;
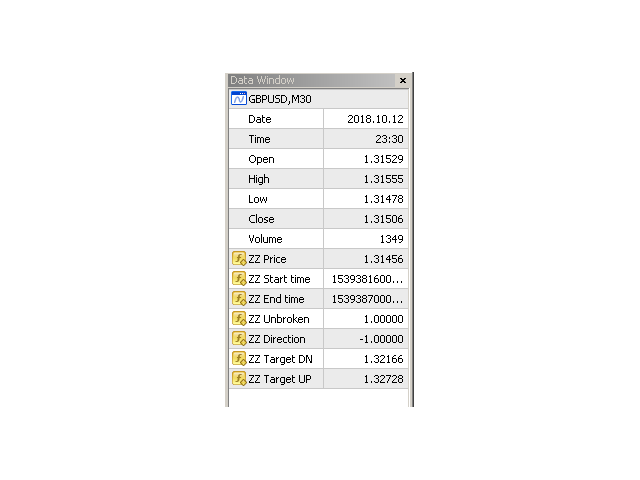
Show Price — 显示级别的价格;
Show Targets — 显示当前目标(市场走向);
Show broken lines) — 显示断线级别;
Check the breakout of the Lines by price — 按价格检查线的突破:
- High-Low (current bar) — 低(当前柱)
- High-Low (previous bar) — 低(前一栏)
- Close (previous bar) — 关闭(上一栏)
- Open (current bar) — 开盘(当前柱)
Extend broken lines (bars) — 将折线向右延伸指定的条数;
Show Dot at the start of the line — 在指标的转折点显示点;
Show amount of touches — 显示线价附近的触碰次数;
Offset for touches (above/below from the ZZ-point, points) — ZZ 点被视为接触水平面的范围。
警报
Pop up alerts — 触摸关卡时弹出警报;
Push notifications — 推送通知;
E-mail notifications — 通过电子邮件通知;
Sound alert — 触摸关卡时发出声音警报;
Alert when "Line breakout" — 当 ZigZag 水平被突破时发出警报;
Alert when "Changing the ZigZag direction" — 改变 ZigZag 方向时发出警报;
Alert when "Price is near the line" — 如果价格接近该水平则发出警报(一旦出现一根柱,则不会检查锯齿形调整浪的当前点);
Distance to the line for alert (points) — 警报距离(以点为单位);
颜色
Upper line color — 上线的颜色;
Lower line color — 下线的颜色;
Main line width — 主线的宽度;
Main line style — 主线的样式;
Used line width — 使用的线的宽度;
Used line style — 使用的线条的样式;
Font size price — 价格的字体大小;
Font size dot — 点的字体大小;
ZigZag color — ZigZag 的颜色;
ZigZag width — ZigZag 线的宽度;
ZigZag style — ZigZag 线的样式;
蜡烛
Display candles — 启用显示其他时期的蜡烛;
Candles period — 蜡烛周期,所有标准蜡烛周期加上季度;
Number of Candles in the past — 图表上的蜡烛数量;
Shadow color — 烛芯的蜡烛;
Body color (bullish) — 看涨蜡烛的主体蜡烛;
Body color (bearish) — 看跌蜡烛的主体颜色;
Save points to global variables — 将点存储在终端的全局变量中;
Number of points to be stored — 要存储的点数(当前点为零);
Prefix global variables — 全局变量名称的前缀。


This is a brilliant indicator with a huge versatility in specific options. It can draw zigzag from a higher time frame and candles from a higher timeframe, whilst showing levels from the zigzag (or fractals etc.) Colours and so on can be individually specified to give what you need and keep a clean chart. It has too many uses to go into details but an invaluable tool if you use zigzag, candles or liquidity levels. Taras is helpful and skilled, he was able to update to show candles only closed of htf, which I suggested, in a few hours. Look at his other items too!