Dino Trader

5

Discover the "Agulhadas" Strategy

Inspired by popular concepts in the Brazilian market, this strategy combines five technical indicators to identify potential entry and exit points based on trends, market strength, and momentum. Among the indicators used is the famous Didi Index, developed by Odair Aguiar, widely known for representing moving average crossovers.

Indicators Used

  1. Didi Index
  2. ADX
  3. Bollinger Bands
  4. Trix
  5. Stochastic

How This Strategy Works

The indicator displays arrows at buy and sell entry points based on predefined criteria. It also marks exit points with an "X" on the chart.

Buy Signal

Three criteria are observed to confirm an entry point:

  1. ADX in Uptrend

    ADX above 32 or rising, with DI+ above DI-.

  2. Crossover in the Didi Index

    Short-term average crossing above the intermediate average.

  3. Bollinger Bands Expanding

    Simultaneous widening of the upper and lower bands.

Sell Signal

Same criteria as the buy signal, but with inverted signals:

  1. ADX in Downtrend

    ADX above 32 or rising, with DI- above DI+.

  2. Crossover in the Didi Index

    Short-term average crossing below the intermediate average.

  3. Bollinger Bands Expanding

    Simultaneous widening of the bands.

Exit Criteria

The strategy offers multiple conditions to indicate the right time to exit a trade, with a visual "X" signal on the chart.

Buy Exit (two alternatives):

  1. Combined Conditions

    • ADX in trend (above 32 or rising, not simultaneously below DI+ and DI-)
    • Sell crossover in the Didi Index
  2. Multiple Conditions

    • ADX "kick" (V-shaped pattern)
    • Bollinger Bands contracting
    • Trix below its average
    • Stochastic below its average

Sell Exit (two alternatives):

  1. Combined Conditions

    • ADX in trend
    • Buy crossover in the Didi Index
  2. Multiple Conditions

    • ADX "kick"
    • Bands contracting
    • Trix above its average
    • Stochastic above its average

Visual Interpretation of Indicators

Didi Index

  • Buy Alert: Blue dot on the lower band
  • Sell Alert: Red dot on the upper band
  • Confirmations: Blue star for buy, red star for sell

Bollinger Bands with Color Indicators

  • Lower Band: Color reflects the Stochastic trend
  • Upper Band: Color reflects the Trix trend
  • Middle Line: Color indicates ADX trend strength

ADX Representation

  • Thin blue: Weak uptrend
  • Thick blue: Strong uptrend
  • Thin red: Weak downtrend
  • Thick red: Strong downtrend
  • Yellow "X": ADX "kick" signal
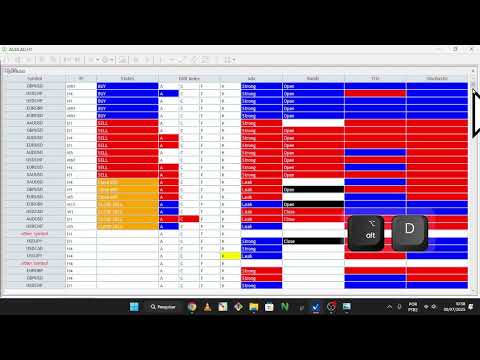
Analysis Panel

The panel visually consolidates key indicator signals with colored boxes and markers to simplify entry and exit analysis.

Default Parameters Used

  • Didi Index: 3, 8, 20
  • ADX: Period 8
  • Bollinger Bands: Period 8, Deviation 2
  • Trix: Period 9, Average 4
  • Stochastic: K=8, D=3, Slowing=3

Important Note

This indicator was independently developed based on publicly available knowledge about moving averages, trend strength, and volatility. Although inspired by widely used concepts in the Brazilian market, it is not affiliated with Odair "Didi" Aguiar, his course, or any official product.

For a deeper understanding of the original methodology created by Didi Aguiar, we recommend contacting the author directly and referring to his official content.

Reviews 3
Wesley Sousa
150
Wesley Sousa 2025.11.11 15:44 
 

Como sempre o velho não entra pra brincar, literalmente pré-histórico. Queria parabenizar seu trabalho, faço e farei de tudo para divulgá-lo, pena que pessoas como você não são valorizadas, enquanto outras apenas crescem enganando outros, e olha que nesse mercado tá cheio...e bota cheio nisso. Abraço irmão, não desiste não, uma hora dá, tem que dar. E se não der agente dá um jeito.

Recommended products
Anchored VWAP indicator
Ahmad Kazbar
4.78 (18)
Anchored VWAP Indicator MT5 — Institutional Volume Weighted Average Price Unlock institutional-grade market analysis with the Anchored VWAP Indicator for MetaTrader 5 . While standard VWAP indicators force a rigid daily reset, this professional-grade tool gives you absolute freedom: anchor the Volume Weighted Average Price to any specific candle, high/low, news event, or market session shift . By tracking exactly where the heavy institutional volume is concentrated from your chosen starting poin
FREE
This indicator is an indicator for automatic wave analysis that is perfect for practical trading! Case... Note:   I am not used to the Western name for wave classification. Influenced by the naming habit of Chaos Theory (Chanzhongshuochan), I named the basic wave as   pen   , the secondary wave band as   segment   , and the segment with trend direction   as main trend segment   (this naming method will be used in future notes, let me tell you in advance), but the algorithm is not closely relat
Link to our products: LINK The ICT Asian Killzone Indicator delivers a professional, institutional-grade framework by precisely defining the Asian trading session from 00:00 to 04:00 GMT with absolute accuracy. It streamlines market structure analysis by isolating liquidity accumulation, range formation, and volatility compression during the Asian session. Built for serious ICT and Smart Money traders, it enhances strategic decision-making, execution confidence, and Tokyo session directional bi
Product Description: Adaptive Y-Axis Scaling is a powerful MT5 indicator designed to enhance your trading experience by providing precise control over the Y-axis (price) scaling of your charts. This innovative tool allows you to customize the price scaling by specifying the number of pips from the visible chart's highs and lows. The calculated price range from this input is then used to set the maximum and minimum prices for the open chart, ensuring an optimized and comprehensive view of market
FREE
CM Ema Trend Bars
Biswarup Banerjee
5 (2)
Introducing CM EMA Trend Bars MT5, an innovative indicator designed specifically for MetaTrader 5 that helps traders identify market trends using Exponential Moving Averages (EMA). This powerful tool is perfect for both novice and experienced traders looking to enhance their trading strategies and capitalize on market movements. With CM EMA Trend Bars MT5, you gain a competitive edge by receiving timely trading signals based on price action. It allows you to make informed decisions, ensuring you
FREE
Trending or Ranging Dashboard See Every Timeframe's Market Condition at a Glance Stop guessing whether you should be trading breakouts or reversals. The Trending or Ranging Dashboard instantly shows you the market state across all major timeframes - from M1 to Monthly - in one compact, color-coded panel. What Makes This Different Most traders struggle because they use trending strategies in ranging markets, or range-bound strategies when the market is trending. This indicator solves that proble
Sigma VWAP Bands Sigma VWAP Bands (Rolling) is a technical analysis indicator that plots upper and lower bands based on the statistical deviation of price from a rolling Volume-Weighted Average Price (VWAP). The indicator is designed to visualize price dispersion around VWAP using a user-defined lookback window and a configurable standard deviation multiplier. Parameters Lookback Period Number of bars used for VWAP and standard deviation calculations. Sigma Factor Multiplier applied to the cal
Utilities
Douglas Lucio De Araujo
Indicator with 3 features - Clock : Clock independent of the chart, counting continues even when the market is closed. - Template : After setting up a configuration in any graphic, be it color patterns, indicators, zoom ... The configuration will be copied to all active graphics. - TimeFrame : Set the TimeFrame on a chart, and with just one click all the active charts will be changed to the same TimeFrame.
Didi Index
Flavio Javier Jarabeck
4.8 (25)
The famous brazilian trader and analyst Didi Aguiar created years ago a study with the crossing of 3 Simple Moving Averages called "Agulhada do Didi", then later was also named Didi Index, as a separate indicator. The period of those SMAs are 3, 8 and 20. As simple as that, this approach and vision bring an easy analysis of market momentum and trend reversal to those traders looking for objective (and visual) information on their charts. Of course, as always, no indicator alone could be used wit
FREE
Price Action Suvo - Ultimate SMC & Trend Indicator  Key Features 1. Advanced Market Structure (BOS & CHoCH) Dual Structure Analysis:   Automatically identifies both   Internal Structure   (short-term) and   Swing Structure   (major trends). BOS & CHoCH:   Clearly marks   Break of Structure (BOS)   and   Change of Character (CHoCH)   with distinct styles. Visual Perfection: Internal:   Dotted lines for minor structure. Swing:   Solid lines for major structure. No Overlap:   Fixed logic prevent
FREE
The "Moving Average Range Painter" is a robust MetaTrader 5 (MT5) indicator meticulously crafted to illustrate the fluctuating range between an exponential moving average (EMA) and a simple moving average (SMA) on any financial chart. This tool offers traders a comprehensive visual depiction of the price range within which an asset is oscillating. Here's a succinct interpretation of what this range signifies for technical analysis: Trend Dynamics : The range delineated by the EMA and SMA unveils
FREE
Liquidity Map
Alex Amuyunzu Raymond
Liquidity Map  Overview The Liquidity Map indicator is an advanced visualization tool based on ICT Smart Money Concepts . It automatically identifies daily Buy Zones , Sell Zones , and Liquidity Levels , showing where price is likely to reverse or continue based on institutional order flow. It calculates key levels from the daily session — such as the previous day’s high, low, and midpoint — then derives a premium (sell bias) and discount (buy bias) structure. When price trades into these mapped
KT DMA is a modified and advanced version of the classic Displaced Moving Averages with buy/sell crossover alerts and a Multi-Timeframe scanner that shows DMA's direction across each real-time time frame. A Displaced Moving Average is a simple moving average that moves ahead or backward in a time frame (either short-term or long-term). It also allows you to predict price movement more accurately. Features Depicts the trend direction using the alignment of three moving averages. Buy/Sell signals
Trading concept: When price touches or exceeds the upper circle boundary = potential sell signal (overbought) When price touches or falls below the lower circle boundary = potential buy signal (oversold) The circle acts like a dynamic support/resistance band around the opening price The numbered points (1-24) help identify where in the cycle the price currently is This is similar to using Bollinger Bands or other envelope indicators, but with a fixed radius instead of standard deviations.
Xtrade Trend Detector
Dago Elkana Samuel Dadie
Xtrade Trend Detector is an indicator capable of finding the best opportunities to take a position in any stock market. Indeed, it is a great tool for scalpers but also for Daytraders. You could therefore use it to identify areas to trade, it fits easily on a chart. I use it to detect trends on Big timeframes and take positions on Small timeframes. Don't hesitate to give me a feedback if you test it.
Simple MACD Expert
Abraao Moreira
3 (1)
Estratégia de negociação MACD O cálculo do MACD é executado uma vez a cada tick, e são considerados para fim de cálculo os três últimos resultados, para analisar o cruzamento da linha de zero, ou seja quando o último resultado for maior que 0 e o antepenúltimo não então há um cruzamento para cima e analogamente para baixo, quando um cruzamento é constatado o estado de uma variável de controle é alterado de "false" para "true", permitindo o abertura de uma posição caso a média de sinal também cru
FREE
The Brilliant Reversals MultiCurrency Scanner MT5 is a state-of-the-art trading indicator designed for traders looking to identify potential reversal points across multiple currency pairs. By leveraging advanced algorithms, this tool provides instant insights, making it invaluable for both novice and experienced traders aiming to optimize their trading strategies. This indicator empowers traders by delivering real-time buy and sell signals based on market conditions, enhancing decision-making an
This indicator helps to identify market sessions, It's High/Low, Open Range (OR), range of the sessions in pips and percentage of previous day (change%) under OHLC.   It is also editable for any brokerage market watch time. For traders who use session trading strategies such as Mark B. Fisher ACD it can be super effective, where they can edit OR from the settings to either line or box.  We tried to make the settings easier to edit, for traders' use on different markets, charts and brokerage ti
Optimized Spike Detector Pro for MT5 is a professional-grade technical indicator designed to identify and capitalize on sharp, impulsive price movements (spikes) in any financial instrument. Utilizing a sophisticated, multi-algorithmic core, it distinguishes significant volatility expansions from market noise with exceptional accuracy. The tool dynamically adapts to changing market conditions, filtering out false signals and highlighting only high-probability spike setups in real-time. Featuring
Good day! I present to you a trading technical indicator for Deriv broker synthetic indices. This indicator ONLY works with the following indices: Boom 300 Index Boom 500 Index Boom 1000 Index Crash 300 Index Crash 500 Index Crash 1000 Index The indicator was created to give signals to open medium-term trades in the direction of Spikes. But you can open trades in the opposite direction to Spikes, at your own risk. Trade only on M1. Other TFs do not guarantee the correct operation of the indica
Phi Cubic Fractals Pack1A with FuTuRe   PACK 1A é uma melhoria sobre o Pack 1 que inclui a possibilidade de selecionar as linhas LINE 4/8/17/34/72/144/305/610 individualmente. Este produto contém os indicadores do PACK 1A (Lines + LineSAR + Channels + BTL + Ladder) + MODO FUTURO Phi Lines  - medias moveis especiais, semelhantes às MIMAs do Phicube, capazes de indicar com muita clareza tanto a tendencia como a consolidação; Phi LineSAR  - apaga ou destaca as Phi Lines para mostrar apenas as linha
The ABC Indicator analyzes the market through waves, impulses, and trends, helping identify key reversal and trend-change points. It automatically detects waves A, B, and C, along with stop-loss and take-profit levels. A reliable tool to enhance the accuracy and efficiency of your trading. This product is also available for MetaTrader 4 =>  https://www.mql5.com/en/market/product/128179 Key Features of the Indicator: 1. Wave and Trend Identification:    - Automatic detection of waves based on mov
Linha PCM Fimathe
Anderson Maicon De Vargas Odorcik
Manual de Instalação e Configuração Para que você tenha a melhor experiência profissional, siga estes passos simples para preparar o seu terminal: 1. Ativação no Terminal (Ajuste de Segurança) Antes de começar, precisamos garantir que o MetaTrader permita que você manipule a ferramenta livremente: Pressione Ctrl + O para abrir as Opções . Vá na aba Gráficos . Marque a opção: "Selecionar objetos com um clique do mouse" . Isso permitirá que você ajuste a régua de medição de forma instantânea. 2. V
Quantified Trendline Strength (QTS) Overview Quantified Trendline Strength is a technical analysis tool that automatically detects and evaluates trendlines based on price swing structures. It provides a visual and quantitative way to understand how significant each trendline may be, allowing traders to make more structured observations of market behavior. Indicator Type Category: Trend / Level Detection Display: Chart window (overlay indicator) Purpose: Identify and evaluate trendlines, support
Moving pivot Average Fibonacci The  indicator compares the selected period with its counterpart from the previous period. The indicator determines the moving Fibonacci levels for the day or any time interval to assess the price movement range from the time average. The indicator helps predict the expected high or low for the day based on historical time data. The pivot line can be considered an average trend line and use it in a variety of trading strategies. If you have any question about the
Apex Trend Engine
Thiago Balonyi Candal Da Rosa
Apex Trend Engine is a professional Expert Advisor built to trade market structure and directional momentum with a disciplined risk framework. Unlike conventional systems that rely on lagging indicators or risky recovery methods, Apex Trend Engine focuses on identifying high-probability trend conditions and executing trades with precision and control. The system uses a combination of structural price analysis, volatility filtering, and trend validation to avoid low-quality market conditions. Tra
An all‑in‑one trading assistant that blends AI candle synthesis with a 15‑pattern Heat Map, ATR‑scaled S/R & pivots, and a Vigilant risk monitor (LOC/TF/SR/PAT gates, Ready%, EM points, SR‑distance bar). The Opportunity Advisor adds ETAs, checklists and gate status; Multi‑TF Confluence confirms alignment from M1–D1. The Professional Trade Suggestion panel shows regime, session filter, R:R presets, Partials and Quality Pause. Clean, readable UI with one‑click S/R toggles, scanners and a built‑in,
SMC Structure Markup
Seyed Mohammad Hosseini Hejazi
4.67 (15)
Overview The Smart Money Structure Markup Indicator for MetaTrader 5 is a powerful tool designed to help traders identify key market structures based on popular Smart Money Concepts (SMC) strategies. This indicator detects micro-market structures, providing insights into price movements and potential trend changes. It highlights important elements such as valid Break of Structure (BOS), Change of Character (CHoCH), and Inducement (IDM), helping traders to make informed decisions. Key Features Ma
FREE
Pure Diamond Trend Exhaustion The Pure Diamond Trend Exhaustion indicator is designed to identify market exhaustion zones and potential price reversal points. The core algorithm is based on the analysis of extremes and candlestick wick structures, allowing it to highlight significant overbought and oversold levels without the use of standard lagging oscillators. Technical Characteristics: No Repaint: Indicator signals (diamonds) are fixed immediately after the current candle closes. A formed sig
PAX BDB Trade Chaos system of Bill Williams   (Bearish/Bullish divergent bar). One of the signals of the "Trade Chaos" system of Bill Williams. (First wiseman) When bar moving away from the  "Alligator" indicator and there is divergence on the Awesome Oscillator indicator, it shows a potential point of movement change. It is based on the opening/closing of the bar, the position relative to the previous ones, the Alligator and AO. When trading, the entrance is at the breakthrough of the bar(short
Buyers of this product also purchase
SuperScalp Pro
Van Minh Nguyen
4.63 (24)
SuperScalp Pro – Advanced Multi-Filter Scalping Indicator System SuperScalp Pro is an advanced scalping indicator that combines the classic Supertrend with multiple intelligent confirmation filters to help identify trading opportunities. It works efficiently across multiple timeframes from M1 to H4, with optimized performance on XAUUSD, BTCUSD, and major Forex pairs. The indicator provides clear Buy and Sell signals, along with automatically calculated entry price, stop loss, and take profit lev
Divergence Bomber
Ihor Otkydach
4.9 (89)
Each buyer of this indicator also receives the following for free: The custom utility "Bomber Utility", which automatically manages every trade, sets Stop Loss and Take Profit levels, and closes trades according to the rules of this strategy Set files for configuring the indicator for various assets Set files for configuring Bomber Utility in the following modes: "Minimum Risk", "Balanced Risk", and "Wait-and-See Strategy" A step-by-step video manual to help you quickly install, configure, and s
SignalTech MT5 is an unique fully rule based trading system for EURUSD, USDCHF, USDJPY, AUDUSD, NZDUSD, EURJPY, AUDJPY, NZDJPY, CADJPY.  All the winning trades with chart setups are published on the comments page. 2026-05 3493 Pips (Until 05-21 NY Closed) 2026-04 2243 Pips 2026-03 2165 Pips 2026-02 2937 Pips 2026-01 2624 Pips 2025-12 1174 Pips It can generate signals with Buy/Sell Arrows and Pop-Up/Sound Alerts. Each signal has clear Entry and Stop Loss levels, which should be automatically flag
Gold Entry Sniper
Tahir Mehmood
5 (9)
Gold Entry Sniper – Professional Multi-Timeframe ATR Dashboard for Gold Scalping & Swing Trading Gold Entry Sniper is a cutting-edge MetaTrader 5 indicator designed to give traders precise buy/sell signals for XAUUSD and other symbols, powered by ATR Trailing Stop logic and a multi-timeframe analysis dashboard . Built for both scalpers and swing traders, it combines real-time market direction , dynamic stop levels , and professional visual dashboards to help you identify high-probability gold en
Entry In The Zone and SMC Multi Timeframe is a real-time 2-in-1 market analysis tool that combines market structure analysis and a No Repaint BUY / SELL signal system into a single indicator, built on Smart Money Concepts (SMC) — a widely adopted framework used by professional traders to understand market structure. This indicator helps you see the market more clearly, make decisions based on structure rather than guesswork, and focus on high-probability zones where price is more likely to react
Let's be honest first. No indicator will make you profitable on its own. If someone tells you otherwise, they're selling you a dream. Every indicator that shows perfect buy/sell arrows can be made to look flawless — just zoom into the right window of history and screenshot the winners. We won't do that. SMC Intraday Formula is a tool. It reads the market structure for you, maps the highest-probability price zones, and tells you exactly what the smart money footprint looks like right now — in pl
Azimuth Pro
Ottaviano De Cicco
5 (7)
Azimuth Pro V2: Synthetic Fractal Structure and Confirmed Entries for MT5 Overview Azimuth Pro is a multi-level swing structure indicator by Merkava Labs . Four nested swing layers, swing-anchored VWAP, ABC pattern detection, three-timeframe structural filtering, and closed-bar confirmed entries — one chart, one workflow from micro-swings to macro-cycles. This is not a blind signal product. It is a structure-first workflow for traders who care about location, context, and timing. V2 Launch Offe
Power Candles MT5
Daniel Stein
5 (8)
Power Candles V3 - Self-Optimizing Strength Indicator Power Candles V3 turns currency and instrument strength into an actionable trade plan on every chart it is attached to. Instead of just coloring candles, it runs a live auto-optimization in the background and hands you the best Stop Loss, Take Profit and signal threshold for the symbol in front of you. One click adopts it for live trading - entry, Stop Loss and Take Profit rays appear on the chart at the exact prices, and alerts fire with dir
TREND CATCHER INDICATOR Trend Catcher Indicator analyzes market price movements, using a combination of the author’s proprietary and customized adaptive trend-analysis indicators.  It identifies the true market direction by filtering out short-term noise and focusing on underlying momentum strength, volatility expansion, and price structure behavior.  It also uses a combination of smoothing and trend-filtering customized indicators such as moving averages, RSI, and volatility filters.   Real ope
New Update of   Smart Trend Trading System MT5 For  2026 Market: If You Buy this Indicator you will Get my Professional Trade Manager + EA  for FREE . First of all Its worth emphasizing here that this Trading System is Non-Repainting   , Non Redrawing and Non Lagging Indicator Which makes it ideal from both manual and robot trading .  [Online course] , [manual] and [download presets] . The Smart Trend Trading System MT5 is a comprehensive trading solution tailored for new and experienced traders
Gann Made Easy   is a professional and easy to use Forex trading system which is based on the best principles of trading using the theory of W.D. Gann. The indicator provides accurate BUY and SELL signals including Stop Loss and Take Profit levels. You can trade even on the go using PUSH notifications. PLEASE CONTACT ME AFTER PURCHASE TO GET TRADING  INSTRUCTIONS   AND GREAT EXTRA INDICATORS   FOR FREE! Probably you already   heard   about the Gann trading methods before. Usually the Gann theory
ARIPoint
Temirlan Kdyrkhan
1 (1)
ARIPoint is a powerful trading companion designed to generate high-probability entry signals with dynamic TP/SL/DP levels based on volatility. Built-in performance tracking shows win/loss stats, PP1/PP2 hits, and success rates all updated live. Key Features: Buy/Sell signals with adaptive volatility bands Real-time TP/SL/DP levels based on ATR Built-in MA Filter with optional ATR/StdDev volatility Performance stats panel (Success, Profit/Loss, PP1/PP2) Alerts via popup, sound, push, or email Cu
FX Trend MT5 NG
Daniel Stein
5 (6)
FX Trend NG: The Next Generation Multi-Market Trend Intelligence Overview FX Trend NG is a professional multi-timeframe trend and market monitoring tool designed to give you a complete structural overview of the market in seconds. Instead of switching between dozens of charts, you instantly see which symbols are trending, where momentum is fading, and where strong alignment exists across timeframes. This tool is part of the Stein Investments ecosystem - 18+ tools plus Max, your 1-on-1 AI tradi
First of all Its worth emphasizing here that this Trading Tool is Non Repainting , Non Redrawing and Non Lagging Indicator , Which makes it ideal for professional trading . [Online course] ,   and   [manual] The Smart Price Action Concepts Indicator is a very powerful tool for both new and experienced traders . It packs more than 20 useful indicators into one , combining advanced trading ideas like Inner Circle Trader Analysis and Smart Money Concepts Trading Strategies . This indicator focuses
Trend Screener Pro MT5
STE S.S.COMPANY
4.85 (104)
Trend Screener Indicator --Professional Trend Trading & Market Scanning System for MetaTrader Unlock the true power of trend trading with Trend Screener Indicator — a complete multi-currency, multi-timeframe trend analysis solution powered by Fuzzy Logic,Trend Pulse Technology  and advanced market structure algorithms.   Trend Screener transforms your MetaTrader platform into a professional-grade Trend Analyzer and Market Scanner, helping you identify high-probability trend opportunities, early
KT Alpha Hunter Arrows MT5
KEENBASE SOFTWARE SOLUTIONS
Most arrow indicators give you a signal and leave you to figure out the rest. KT Alpha Hunter Arrows gives you the full trading plan. Every signal arrow prints with a full plan already drawn: entry line, stop-loss, four take-profit levels, and a live edge verdict telling you whether this symbol and time-frame is worth trading right now. An included Trade Manager EA handles the execution after you enter, so discipline stays intact when the market gets loud. Non-repaint. Closed-bar signals only. B
Introducing   Quantum Breakout PRO , the groundbreaking MQL5 Indicator that's transforming the way you trade Breakout Zones! Developed by a team of experienced traders with trading experience of over 13 years,   Quantum Breakout PRO   is designed to propel your trading journey to new heights with its innovative and dynamic breakout zone strategy. Quantum Breakout Indicator will give you signal arrows on breakout zones with 5 profit target zones and stop loss suggestion based on the breakout b
Gem SIGNAL
Shengzu Zhong
5 (1)
GEM Signal Pro GEM Signal Pro is a trend-following indicator for MetaTrader 5, designed for traders who want clearer signals, more structured trade setups, and practical risk management directly on the chart. Instead of showing only a simple arrow, GEM Signal Pro helps present the full trade idea in a cleaner and more readable way. When conditions are confirmed, the indicator can display the entry price, stop loss, and take profit targets on the chart, helping traders review the setup more effic
FX Levels MT5
Daniel Stein
5 (14)
FX Levels: Exceptionally Accurate Support & Resistance for All Markets Quick Overview Looking for a reliable way to pinpoint support and resistance levels across any market—currencies, indices, stocks, or commodities? FX Levels merges our traditional “Lighthouse” method with a forward-thinking dynamic approach, offering near-universal accuracy. By drawing from real-world broker experience and automated daily plus real-time updates, FX Levels helps you identify reversal points, set profit targe
Market Structure Order Block Dashboard MT5 is an MT5 indicator designed for traders who want to read market structure and the main price reaction zones directly on the chart. It combines BOS, ChoCH, Order Blocks, Fair Value Gaps (FVG), Liquidity, Kill Zones, Volume Profile, and a compact dashboard for quick analysis. This indicator targets traders who use market structure, ICT and Smart Money concepts as a decision framework. It can help spot trend continuations, possible reversals, price imbala
FX Power MT5 NG
Daniel Stein
5 (32)
FX Power: Analyze Currency Strength for Smarter Trading Decisions Overview FX Power is your go-to tool for understanding the real strength of currencies and Gold in any market condition. By identifying strong currencies to buy and weak ones to sell, FX Power simplifies trading decisions and uncovers high-probability opportunities. Whether you’re looking to follow trends or anticipate reversals using extreme delta values, this tool adapts seamlessly to your trading style. Don’t just trade—trade
Btmm state engine pro
Garry James Goodchild
5 (4)
BTMM State Engine Pro is a MetaTrader 5 indicator for traders who use the Beat The Market Maker approach: Asian session context, kill zone timing, level progression, peak formation detection, and a multi-pair scanner from a single chart. It combines cycle state logic with a built-in scanner dashboard so you do not need the same tool on many charts at once. What it does Draws the Asian session range; session times can follow broker server offset or be set in inputs. Tracks level progression (L
Reversal Master for MT5 Reversal Master for MT5 is a non‑repainting reversal indicator for MetaTrader 5. It helps you detect potential market reversal points and shows the maximum favourable price movement after each historical signal, so you can better understand how price behaved after similar situations in the past. The MT5 version keeps the familiar reversal‑signal logic of the original Reversal Master for MT4, but adds improved visualisation, historical statistics and a points summary panel
OrderFlux | Footprint Orderflow for MetaTrader 5 Version 2.0 – Real-time Bid/Ask Visualization for Active Traders OrderFlux is a footprint and orderflow indicator for MT5. It shows not only where the price has moved, but what happens inside the movement: Bid/Ask volume per price level, delta, imbalance, and volume distribution. Many charts only show you the final result of a candle. OrderFlux shows you the path to get there. This is exactly what helps when you want to read market participation i
Quantum TrendPulse
Bogdan Ion Puscasu
5 (25)
Introducing Quantum TrendPulse , the ultimate trading tool that combines the power of SuperTrend , RSI , and Stochastic into one comprehensive indicator to maximize your trading potential. Designed for traders who seek precision and efficiency, this indicator helps you identify market trends, momentum shifts, and optimal entry and exit points with confidence. Key Features: SuperTrend Integration: Easily follow the prevailing market trend and ride the wave of profitability. RSI Precision: Detect
Atomic Analyst MT5
Issam Kassas
3.94 (31)
New Update of   Atomic Analyst MT5 For  2026 Market: If You Buy this Indicator you will Get my Professional   Trade Manager + EA  for   FREE . First of all Its worth emphasizing here that this Trading Indicator is   Non-Repainting   , Non Redrawing and Non Lagging Indicator   Indicator, Which makes it ideal from both manual and robot trading.  User manual: settings, inputs and strategy . The Atomic Analyst  is a PA Price Action Indicator that uses Strength and Momentum of the price to find a bet
RelicusRoad Pro MT5
Relicus LLC
4.96 (24)
RelicusRoad Pro: Quantitative Market Operating System 70% OFF LIFETIME ACCESS (LIMITED TIME) - JOIN 2,000+ TRADERS Why do most traders fail even with "perfect" indicators? Because they trade Single Concepts in a vacuum. A signal without context is a gamble. To win consistently, you need CONFLUENCE . RelicusRoad Pro is not a simple arrow indicator. It is a complete Quantitative Market Ecosystem . It maps the "Fair Value Road" price travels on, distinguishing between random noise and true structur
Trend Forecaster
Alexey Minkov
5 (7)
Trend Forecaster – Since 2023. The Trend Forecaster indicator utilizes a unique proprietary algorithm to determine entry points for a breakout trading strategy. The indicator identifies price clusters, analyzes price movement near levels, and provides a signal when the price breaks through a level. The Trend Forecaster indicator is suitable for all financial assets, including currencies (Forex), metals, stocks, indices, and cryptocurrencies. You can also adjust the indicator to work on any time
Meridian Pro
Ottaviano De Cicco
5 (2)
Meridian Pro 2.00: Professional Multi-Timeframe Trend Matrix for MT5 Meridian Pro 2.00 is a professional adaptive trend matrix for MetaTrader 5. It combines the original Meridian trend engine, a clean chart ribbon, closed-bar signal arrows, an 8-timeframe dashboard, Fuel momentum, weighted consensus, synthetic HTF processing and chart-native higher-timeframe context lines. The goal is simple: read current trend, multi-timeframe structure, strength, momentum and EA-ready state from one discipline
This dashboard shows the latest available   harmonic patterns   for the selected symbols, so you will save time and be more efficient /   MT4 version . Free Indicator:   Basic Harmonic Pattern Comparison of "Basic Harmonic Pattern" vs. "Basic Harmonic Patterns Dashboard" Indicators Feature Basic Harmonic Pattern Basic Harmonic Patterns Dashboard Functionality Detects and displays harmonic patterns on a single chart Searches multiple symbols and timeframes for harmonic patterns, displays res
More from author
Supports And Resistances Lines
Francisco Gomes Da Silva
4.65 (46)
Support and Resistance zones Indicator MT5 this indicator knows how to identify tops and bottoms automaticly. This support and resistance indicator creates support lines and resistance lines based on tops and bottoms. how to make support and resistance lines. this is an indicator to make automatic support and resistance lines. how to find support level with indicator. this indicator finds tops and bottoms automaticly. The Indicator automatically creates support lines every time “Fractals” create
FREE
Sweet VWAP Anchored MT5
Francisco Gomes Da Silva
5 (6)
Save time and make more accurate decisions with Anchored VWAPs If you want to test the power of this tool, you can download the free Anchored VWAPs indicator for MT5 . In addition to this indicator working independently, it is also an extension for the free Sweet VWAP version. This is because when you click in the free version, the VWAP you see at the mouse pointer will be anchored. And for better understanding, what will be anchored there is this indicator, with all its functionalities. This in
VWAP With Alerts
Francisco Gomes Da Silva
5 (6)
This VWAP is a simple VWAP, but we have added alerts to let you know when the price touches the simple VWAP or when the price crosses the VWAP. This indicator is a traditional VWAP indicator for MetaTrader 5 (MT5). The default parameters are those of the normal VWAP, but you have the ability to use new calculations and the best part: When the price touches or crosses the VWAP, you will be notified through alerts, mobile notifications, email, or sound events. Free anchored VWAP indicator for MT5
FREE
Bar Number
Francisco Gomes Da Silva
5 (7)
Candle counter This indicator counts and identifies candles based on a longer time frame Bigger Timeframe You can choose the daily timeframe as " Bigger Timeframe ", and run it within any smaller chart. that it will count the bars based on the daily chart . If you pass as a parameter the timeframe " H1 " then the indicator will know how to count the bars inside the H1 chart you just need to run it on smaller charts. The main parameter is the " Bigger Timeframe " which is a larger timeframe than
FREE
VWAP With Alerts MT4
Francisco Gomes Da Silva
5 (8)
This VWAP is a simple VWAP, but we've incorporated notifications that inform you when the price hits or crosses the VWAP line. This indicator is a traditional VWAP indicator for MetaTrader 4 (MT4). The default parameters are those of the normal VWAP, but you have the ability to modify the VWAP calculation, and the best part: When the price touches or crosses the VWAP, you will be notified through alerts, mobile notifications, email, or sound events. Anchored VWAP indicator for MT4 . Parameters:
FREE
Dino Trader Scanner
Francisco Gomes Da Silva
Scanner for the Agulhadas Strategy This scanner was developed to automate the identification of signals from one of the most popular strategies among Brazilian traders — informally known as “Agulhadas.” The technique uses five main indicators with clear visual rules to identify potential entry and exit points on the chart. With the scanner, you save time and avoid the manual work of finding these opportunities. Download this Scanner Indicator for free here How the Scanner Works The scanner analy
RSI abcd
Francisco Gomes Da Silva
4.33 (3)
RSI ABCD Pattern Finder: Technical Strategy 1. How the Indicator Works Combines the classic RSI with automatic detection of ABCD harmonic patterns . Key Components Standard RSI (adjustable period) Peak and Trough Markers (arrows) ABCD Patterns (green/red lines) Overbought (70) and Oversold (30) Filters 2. MT5 Setup period = 14 ; // RSI period size = 4 ; // Maximum pattern size OverBought = 70 ; // Overbought level OverSold = 30 ; // Oversold level Filter = USE_FILTER_ YES ; // Confirmation filte
FREE
Rule Plotter Expert
Francisco Gomes Da Silva
5 (3)
This Expert Advisor has been designed to test and execute your strategies created within the Rule Plotter indicator. How to use: Download the indicator Rule Plotter - a tool for creating trading systems without the need for programming . Next, develop your strategies within the Rule Plotter indicator. Finally, execute your created strategies using this Expert Advisor. Parameters: Strategy: Your trading system created within the Rule Plotter indicator, allowing you to test and execute your custom
Supports And Resistances Lines MTF MT4
Francisco Gomes Da Silva
4.55 (11)
Supports and Resistances, was created to help you identify tops and bottoms automatically on several different timeframes and thus plot these tops and bottoms on the current chart. Let's go to the explanation of the creation of resistances There is a rule field, which you can define what is a top and bottom the top rule is set by default like this: H[ 0 ]<=H[ 1 ] and H[ 1 ]=>H[ 2 ] Where: Element Description H  means   High [0]  means   current   candle [1]  means   previous   candle <=  mean
FREE
OHLC Shifted
Francisco Gomes Da Silva
4.8 (5)
Previous Day's Close and Bar Shift Indicator for MetaTrader! The Previous Day's Close and Bar Shift Indicator is a tool designed to enhance technical analysis and decision-making in trading. With this indicator, you will have access to detailed information about the opening, high, low, and closing levels of any bar, allowing for precise and comprehensive analysis of market movements. Imagine having the ability to nest one timeframe within another, enabling detailed analysis of each bar across di
FREE
Rule Plotter
Francisco Gomes Da Silva
5 (14)
Build Your Strategy Yourself This tool allows you to develop your strategies using all the indicators available natively in MetaTrader and any indicators downloaded from the internet that use buffers to display data on the screen. This tool is another reason for you to consider MetaTrader to automate your trading strategies. With it, you can create your own strategy signals in a simple and intuitive way, using any MetaTrader indicator. How Do I Know If My Internet-Downloaded Indicator Uses Buffe
FREE
OHLC Shifted MT4
Francisco Gomes Da Silva
5 (3)
Previous Day's Close and Bar Shift Indicator for MetaTrader! The Previous Day's Close and Bar Shift Indicator is a tool designed to enhance technical analysis and decision-making in trading. With this indicator, you will have access to detailed information about the opening, high, low, and closing levels of any bar, allowing for precise and comprehensive analysis of market movements. Imagine having the ability to nest one timeframe within another, enabling detailed analysis of each bar across di
FREE
Fibonacci on ZigZag
Francisco Gomes Da Silva
4.93 (14)
Mouse You can draw fibonaccis moving the mouse over the zigzag indicator Pin them You can click on fibonacci with this option and it will no longer be deleted unless you click on it again :) Precision The tuned fibonacci gets the precise point in lower timeframes Enjoy it You can ask me for add more features, so please comment and leave your ranting for me to be happy, thank you :)
FREE
Bar Counter MT4
Francisco Gomes Da Silva
5 (5)
candlestick counter indicator this indicator counts candles that are on the chart of any timeframe a free bar counter for you to download on mt4 the candlestick counter counts how many candles there are inside a larger chart with this candle counter you can do the automatic candlestick count free candlestick count indicator for you to download and count bars automatically bar counter to count the bars count candle counter indicator mt4 count candle bar counter for MT5 If you are interested in th
FREE
Sweet VWAP Aux
Francisco Gomes Da Silva
4.5 (6)
Save time and make more informed decisions with Sweet VWAP Aux If you haven't already downloaded our free VWAP indicator for Metatrader 4 , do it now and experience its incredible capabilities for visualizing anchored vwap. Then come back here and get to know Sweet VWAP Aux - the perfect extension for your Sweet VWAP indicator. With just one click, Sweet VWAP allows you to anchor the VWAP indicator at the point of your choice, saving time and eliminating the need to set it up manually. In additi
Paula Bollinger Bands Strategy
Francisco Gomes Da Silva
3.67 (3)
Bollinger bands out/in strategy A strategy created by Joe Ross, and very useful for finding trades when the market is overloaded. Indicator You don't need to find where there are entries on the chart, this indicator shows them for you. The entrance The trade is confirmed when the price closes outside the bollinger bands on a candle and the candle after the price closes inside the bands. comment I want to improve this indicator, so you can help me sending me your reviews and comments, thanks :).
FREE
First Bar
Francisco Gomes Da Silva
Trade System You choose a bar on the day to trade, when this bar closes the robot will send two orders a at the high other at the low of the candle, which gets again the other will be canceled Stop the stop will be one tick under the low on case of the buy, or one tick above the high on case of the sell Take The take can be setted how much you wants of the stop range, it can be costumized in the strategy otimization Otimization This robot have the input to get risck return, so you can run int in
FREE
My Candle Patterns
Francisco Gomes Da Silva
5 (1)
This indicator is a demo version of the complete My candle, which can be downloaded here: Candle Patterns Creator With the full version, you can create your own candle rules and modify a traditional candle pattern to be more accurate according to your strategy. The indicator includes several example candle rules, but here I will demonstrate only a few: Pattern Rule Candle Green C > O Candle Red C < O Doji C = O Hammer (C > O and (C-O) *2 < O-L and (C-O) *0.5 > H-C) or (C < O and (O-C) *2 < C-L a
FREE
Rule Plotter Scanner
Francisco Gomes Da Silva
5 (1)
Have you ever thought about having a scanner that scans all strategies and shows the buy and sell points for all timeframes of that asset, all at the same time? That's exactly what this scanner does. This scanner is designed to display the buy and sell signals you created in the Rule Plotter: strategy creator without programming and run them within this scanner on various assets and different timeframes. The default strategy for Rule Plotter is only bullish and bearish candles. This means that i
FREE
Rule Plotter MT4
Francisco Gomes Da Silva
4.25 (4)
How to Create an Automated Trading Robot Have you ever wondered how powerful it would be to automate your trading strategies with just a few clicks of the mouse? Imagine having the freedom to create and test different trading strategies without the need to dive into complicated code. With Rule Plotter, this vision becomes a reality. Here we will explore how you can create your own custom trading robot using Rule Plotter, a trade-system creation tool that simplifies the entire process. What is Ru
FREE
Hide Scale
Francisco Gomes Da Silva
5 (1)
Hide Scale - Tool for Traders Who Want More Screen Space Instructions Press "T" to hide the time scale and "P" to hide the price scale. You can customize these keys by clicking the corresponding button and typing a new key on your keyboard. To hide both scales at the same time, you can assign the same key to both options. To show the scales again, simply press the corresponding key again. Why We Created This Tool We created this Hide Scale tool to help traders who use our Sweet VWAP indicator to
FREE
Pattern Wizard
Francisco Gomes Da Silva
5 (2)
Patterns Wizard is a tool for creating candlestick patterns. With it, you can create various patterns and add as many instances of this indicator as you want on your chart, each with a different pattern. To better understand how creation formulas work, you can refer to the examples of the My Candle indicator, which has over 70 examples of candlestick patterns The main difference with this indicator is that it has 30 rule parameters , meaning you can set a different rule for each of the last 30 c
FREE
Hide Scale MT4
Francisco Gomes Da Silva
5 (4)
Hide Scale - The ideal tool for traders who want to maximize chart space How to use Hide Scale Press "T" to hide the time scale and "P" to hide the price scale. You can customize the keyboard shortcuts by clicking on the corresponding buttons and choosing a new key for each function. If you want to hide both scales at the same time, you can assign the same key to both options. To display the scales again, simply press the corresponding key again. The reason behind creating this tool We developed
FREE
Pattern Wizard MT4
Francisco Gomes Da Silva
Patterns Wizard is a tool for creating candlestick patterns. With it, you can create various patterns and add as many instances of this indicator as you want on your chart, each with a different pattern. To better understand how creation formulas work, you can refer to the examples of the My Candle indicator, which has over 70 examples of candlestick patterns The main difference with this indicator is that it has 30 rule parameters , meaning you can set a different rule for each of the last 30 c
FREE
Discover the Power of Risk Management with Price Action to Position Your Stop Loss! Have you ever experienced the situation where you know exactly when to enter a trade, but you're unsure about the right time to exit? Don't worry, you're not alone! Many traders face this challenge on a daily basis. The good news is that our price action-based risk management tool is here to solve this problem. While you focus on identifying the optimal entry points, our tool takes control and handles the trade e
TrendPlator
Francisco Gomes Da Silva
TrendPlator: Empower Your Trading Strategies with an Advanced Trend Projection Indicator Explore the potential of our innovative indicator! With the ability to analyze and project trend lines from larger timeframes directly onto your current timeframe, it provides strategic support that catches the attention of traders across the board. These points become strategic levels of support or resistance for your trades, strengthening your trading strategy. Visualize the opportunity to add an indicator
Auto Anchored VWAPs MT4
Francisco Gomes Da Silva
Unveil Trading Insights with Auto Anchored VWAPs: Auto Anchored VWAPs serve as your guiding companion in the world of trading. These indicators pinpoint crucial market turning points and illustrate them on your chart using VWAP lines. This is a game-changer for traders who employ anchored VWAP strategies. How Does It Work? Identifying High Points: If the highest price of the current candle is lower than the highest price of the previous one, And the previous high is higher than the one before it
Rule Plotter Expert MT4
Francisco Gomes Da Silva
5 (1)
Trading Your Strategies Created with Rule Plotter Indicator with Rule Plotter Expert: Now that you have created your custom strategies using the Rule Plotter Indicator and visualized the arrows indicating entry and exit points on the chart, it's time to bring these strategies to life in the financial markets. With the Rule Plotter Expert, you can trade autonomously and accurately based on these arrows, making the most of the potential of your strategies Turning Arrows into Actions: The arrows ge
Paula Bollinger Bands
Francisco Gomes Da Silva
Transform your investment strategy with the Expert Advisor for MetaTrader investor robot. Based on the powerful Bollinger Bands strategy, created by Joe Ross and dubbed Paula by renowned Brazilian trader Rodrigo Cohen, you will have access to advanced technology that will maximize your profits and minimize your risks. Don't waste any more time with old and inefficient strategies. With our investor robot, you will have access to a highly accurate algorithm that combines technical analysis of ma
My Candle
Francisco Gomes Da Silva
Define your own candlestick pattern and this indicator will show on the screen when this pattern appears You can test it for free in the Strategy Tester and see how many times your candlestick pattern appears on the asset of your choice You can also paint all candles of your pattern or just one This indicator is useful for candlestick analysis, for you to use in price action and with naked trade strategies. It is an indicator that shows the movement you choose How to Use the Indicators: AC AC[1
Filter:
Wesley Sousa
150
Wesley Sousa 2025.11.11 15:44 
 

Como sempre o velho não entra pra brincar, literalmente pré-histórico. Queria parabenizar seu trabalho, faço e farei de tudo para divulgá-lo, pena que pessoas como você não são valorizadas, enquanto outras apenas crescem enganando outros, e olha que nesse mercado tá cheio...e bota cheio nisso. Abraço irmão, não desiste não, uma hora dá, tem que dar. E se não der agente dá um jeito.

mhipiolito
25
mhipiolito 2025.08.21 17:36 
 

User didn't leave any comment to the rating

Findolin
2320
Findolin 2025.07.22 09:23 
 

User didn't leave any comment to the rating

Reply to review