Supports And Resistances Lines
- Indicators
- Francisco Gomes Da Silva
- Version: 1.50
- Updated: 25 August 2025
Support and Resistance zones Indicator MT5
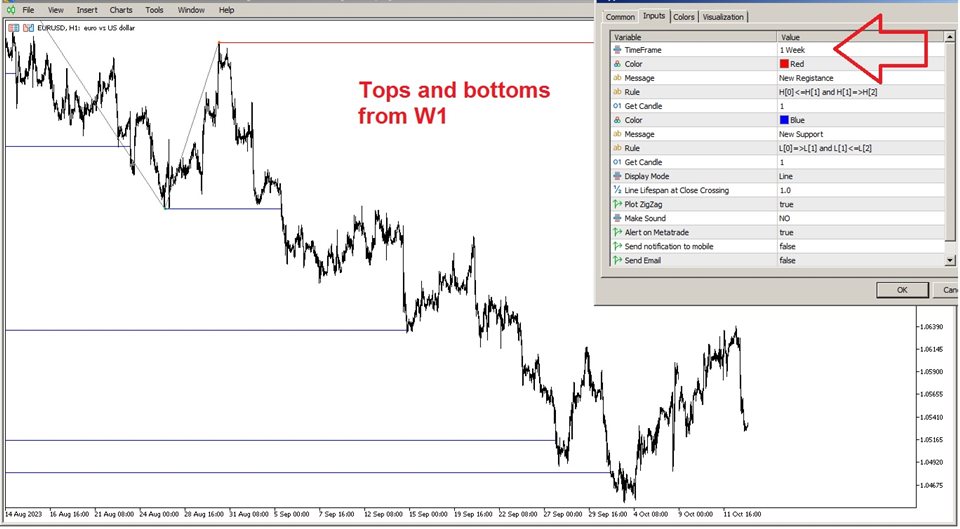
this indicator knows how to identify tops and bottoms automaticly.
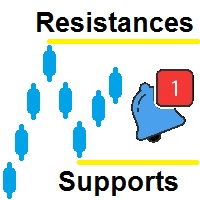
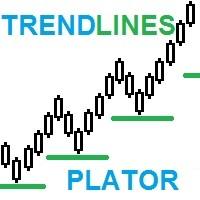
This support and resistance indicator creates support lines and resistance lines based on tops and bottoms.
how to make support and resistance lines.
this is an indicator to make automatic support and resistance lines.
how to find support level with indicator.
this indicator finds tops and bottoms automaticly.
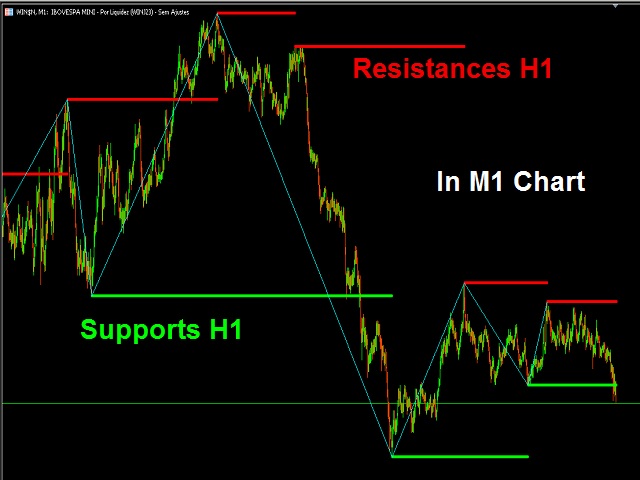
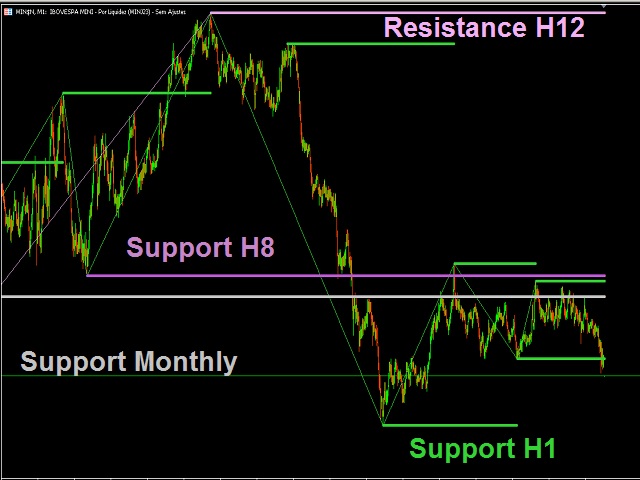
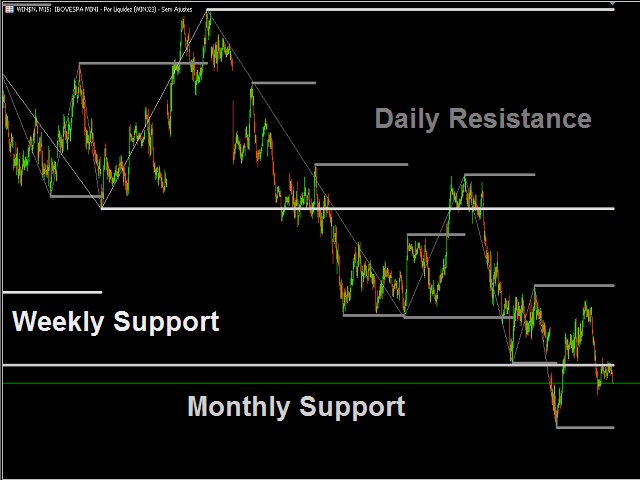
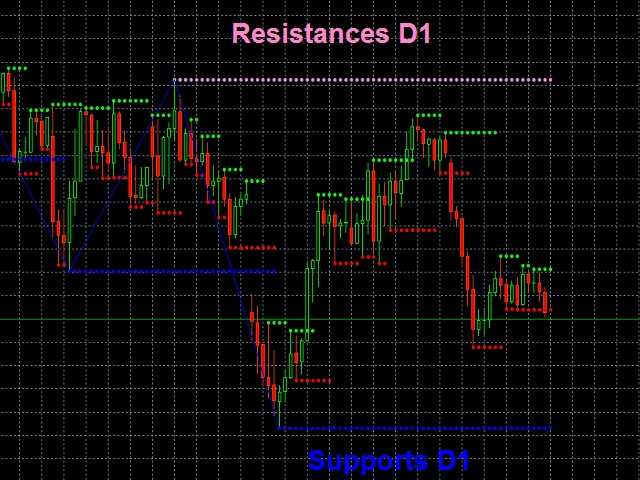
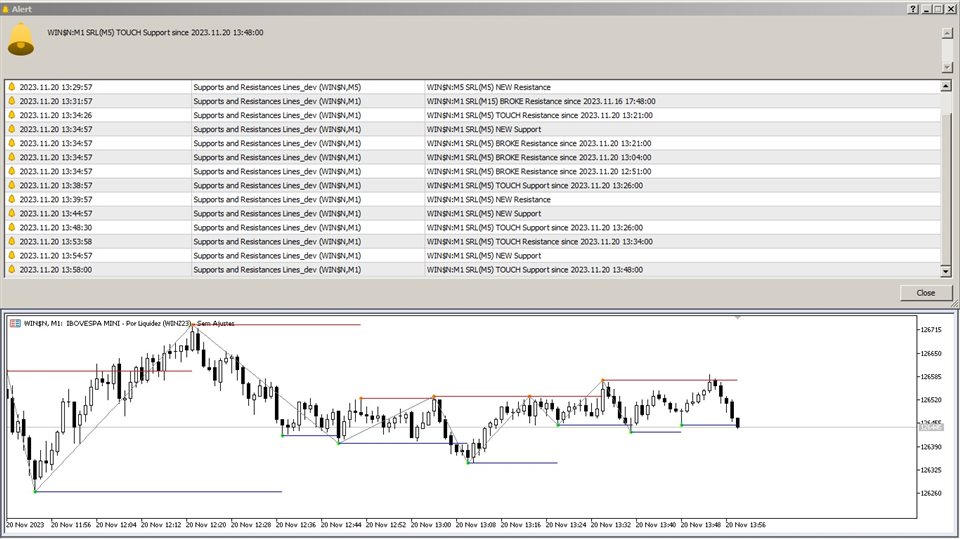
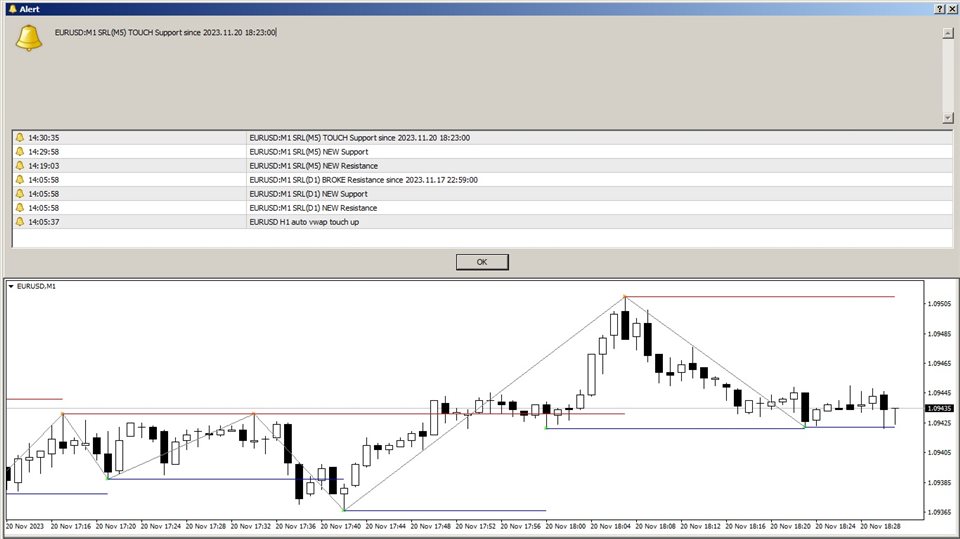
The Indicator automatically creates support lines every time “Fractals” creates a bottom automatically or makes a new bottom lower than the previous bottom, so the indicator automatically draw an automatic support line on the screen.
How to create Resistance lines.
The indicator creates resistance lines automatically in the same way that it creates support levels, whenever “Fractals” makes a new top or a top higher than the previous top, so the indicator creates a new resistance automatically, so you don't have to worry about where are tops and bottoms levels.
this indicator is a easy way for traders to mark their charts with support and resistance.
How to mark a top.
Tops are automatically setted by “Fractals” and then a resistance line is drawn at that level to mark that top.
How to mark a bottom
bottoms are also automatically setted by “Fractals” and then a support line is created to mark that bottom.
Support and resistance zones
tops and bottoms zones MT5
Bottom zones
You can set the tick width of the support zone to take an entire support region instead of just drawing a line at the bottom
top zones
In the same way you define a resistance zone, using ticks to increase the width of the line on tops region
Range of tops and bottoms
The main function of this indicator is to easily identify empty holes in the chart, where there are neither tops nor bottoms, a space without resistance and without support, where normally the market runs faster from one such point to another.
Tops and bottoms strategy
The strategy of operating with this indicator is to have a better risk management, because if the market breaks a resistance, it will probably look for the next one, and as there may be a big hole until the next one, the risk return is favorable, or not, depending on from where you place your stop, normally the stop is placed at the last support, or below the resistance that has just been broken.
support and resistance or supports and resistances zones with tops and bottoms or peaks pointComment
You can submit suggestions, comments, ratings or complaints about my products. Thank you for every interaction, it will be very useful.
support and resistance or supports and resistances zones with tops and bottoms or peaks and bottom points






























great product