Dino Trader Scanner
- Utilities
-
Francisco Gomes Da Silva
 Welcome to my profile, I am a developer of systems and currently I am working only with the language of the metatrade, but I have as goal to create script for tradingview too
 - Version: 1.1
- Updated: 26 August 2025
- Activations: 20
Scanner for the Agulhadas Strategy
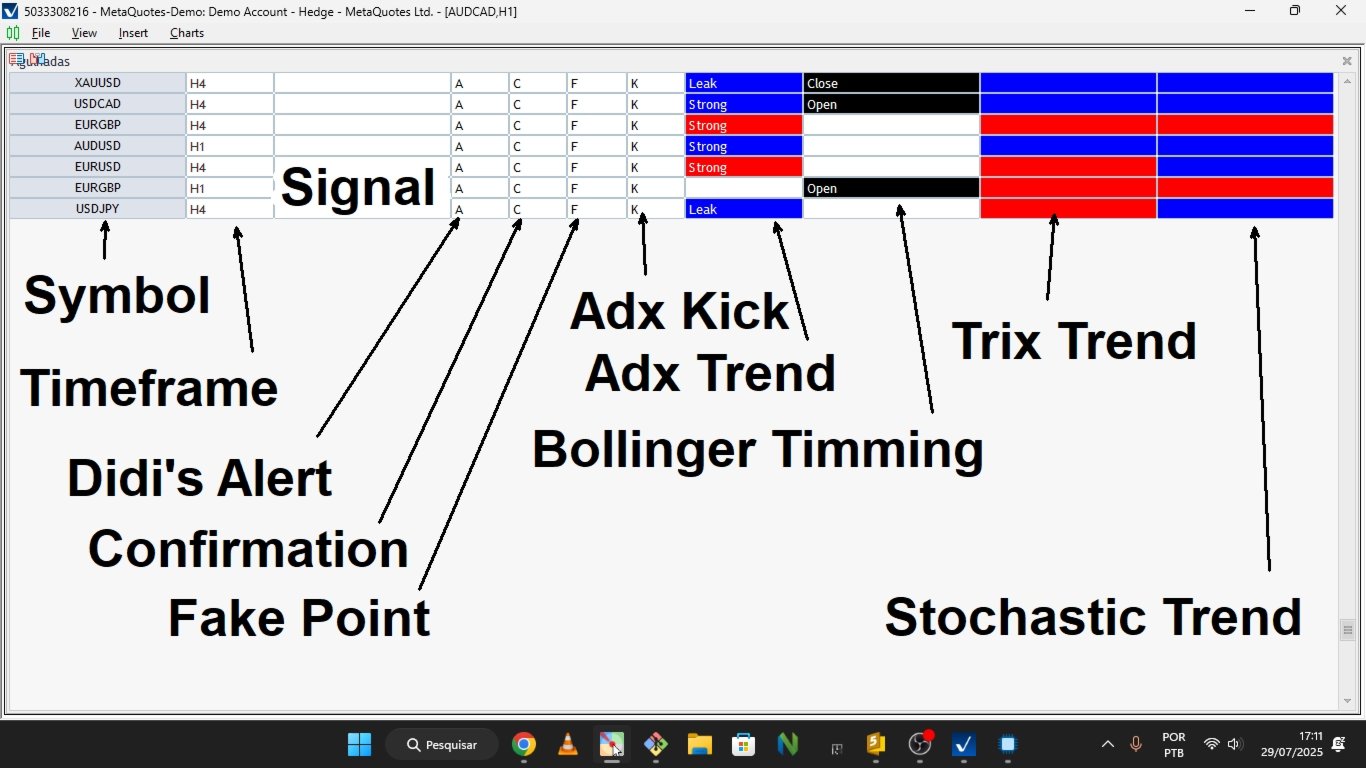
This scanner was developed to automate the identification of signals from one of the most popular strategies among Brazilian traders — informally known as “Agulhadas.” The technique uses five main indicators with clear visual rules to identify potential entry and exit points on the chart. With the scanner, you save time and avoid the manual work of finding these opportunities.
How the Scanner Works
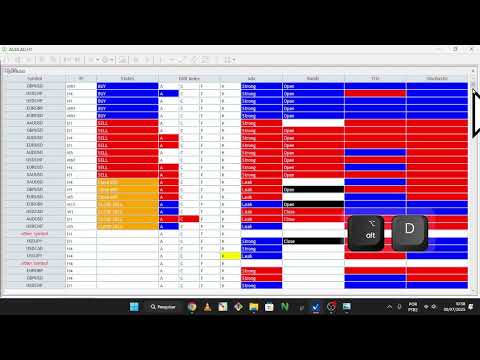
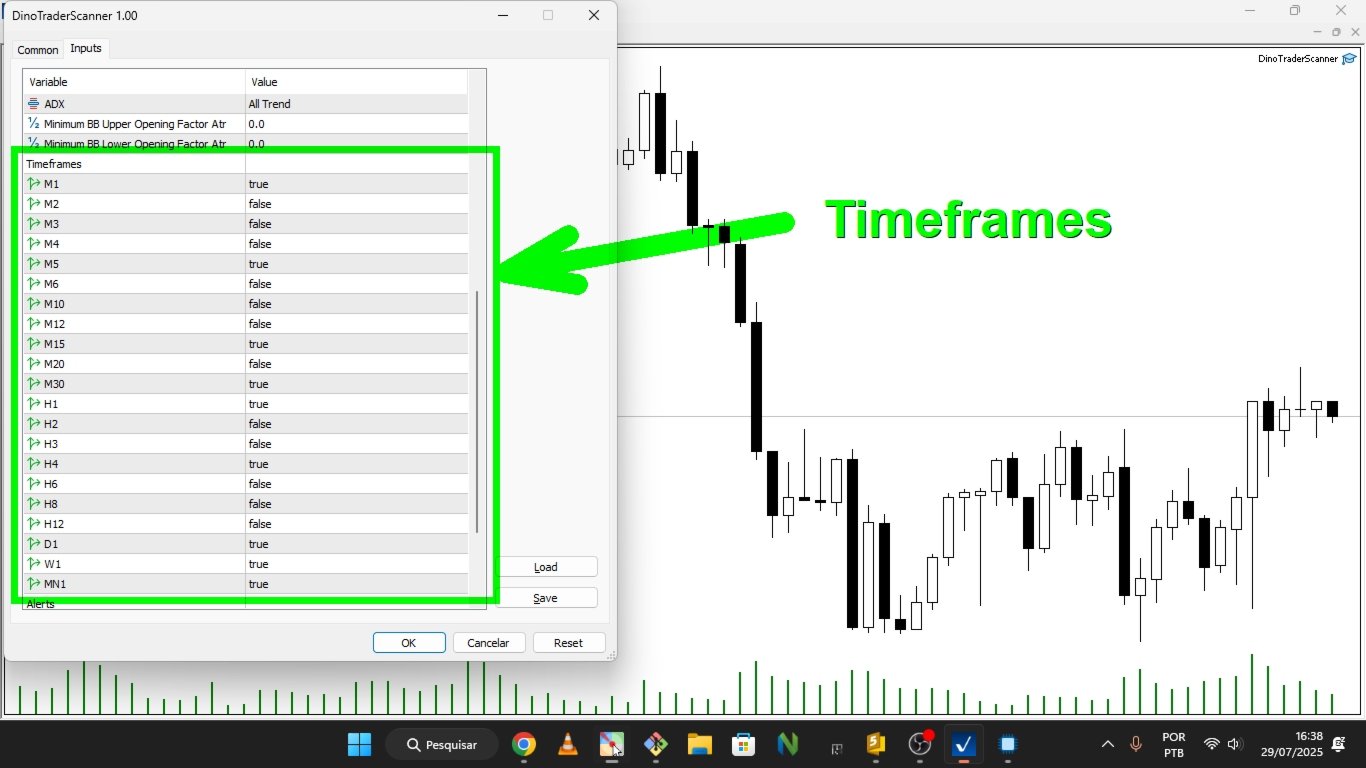
The scanner analyzes multiple assets in real-time, looking for buy or sell signals based on specific combinations of technical indicators. When it finds a complete setup (or partial, if you prefer), the asset is displayed on the results panel, making decision-making faster and more confident.
Criteria Used
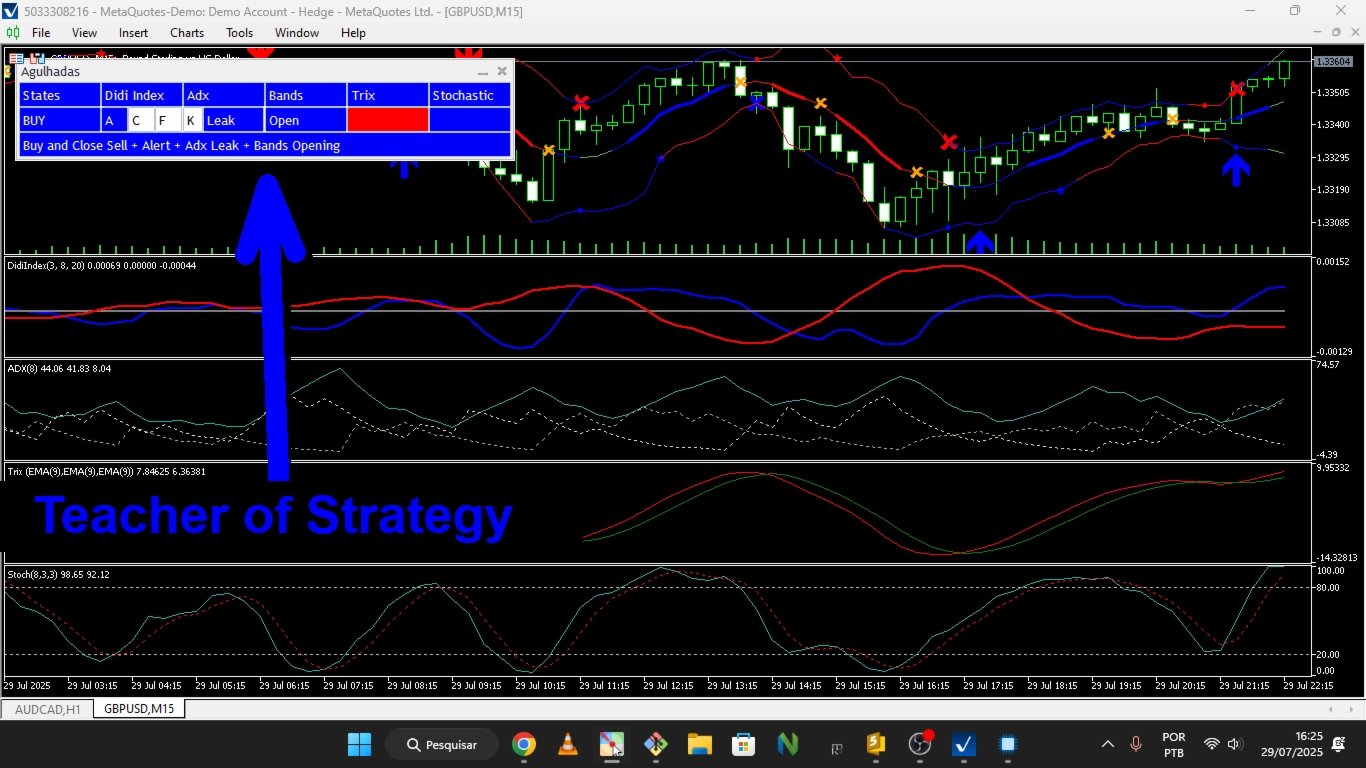
The scanner operates based on the combination of five well-known technical indicators in the market:
- Moving Averages (3/8/20) — Short moving average crossing above the intermediate moving average
- ADX — Presence of a trend with predominance of DI+ or DI-
- Bollinger Bands — Expansion indicating increased volatility
- Trix — Defined trend (above or below its average)
- Stochastic — Consistent direction confirming the movement
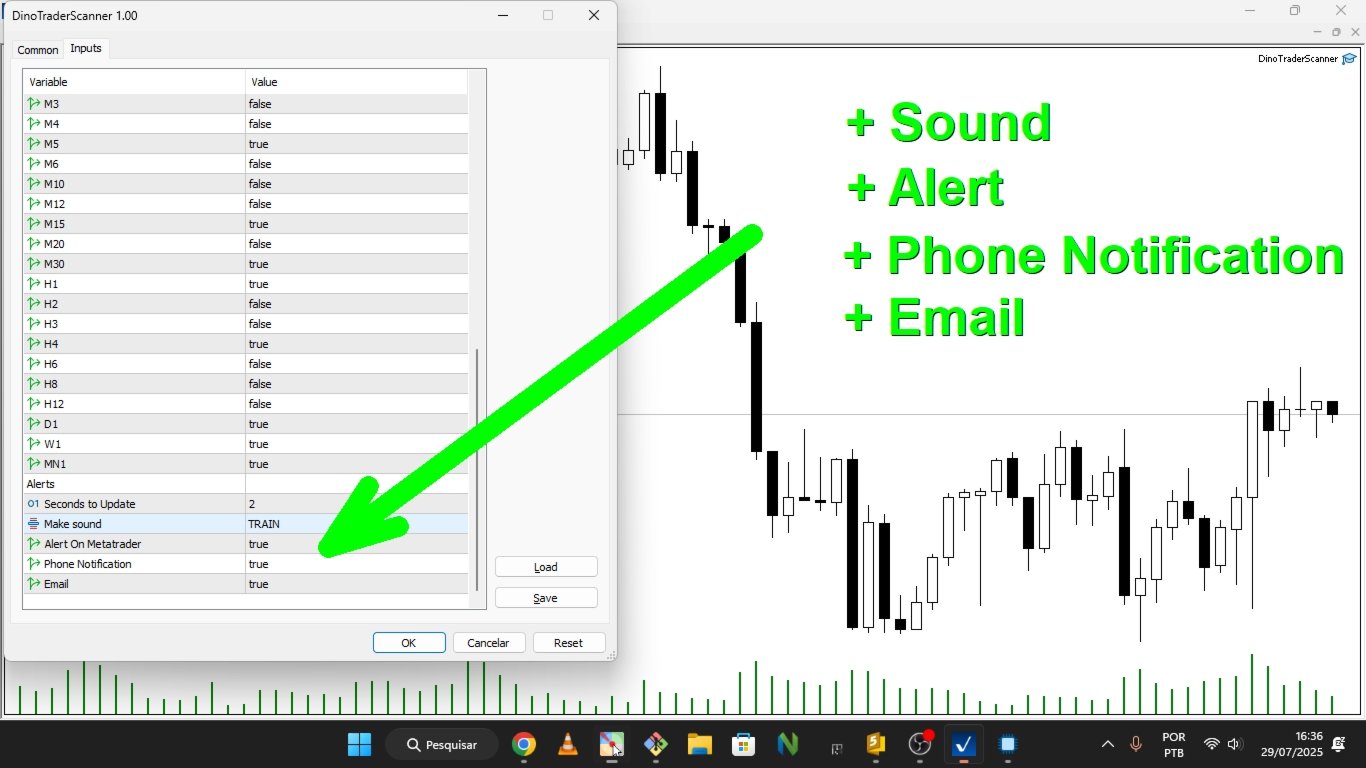
You can configure the scanner to alert only when all criteria are met or allow alerts based on a minimum number of confirmations (for example, 3 out of 5).
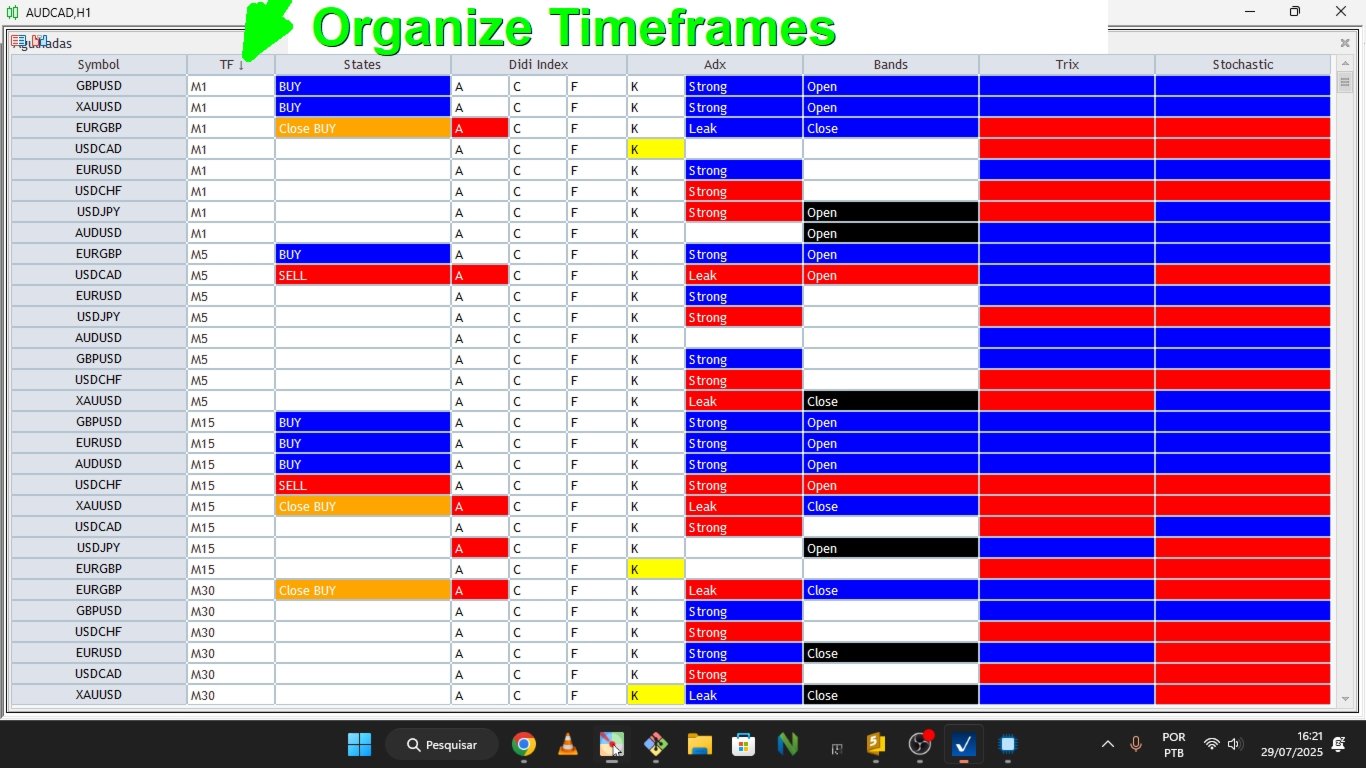
Scanner Panel
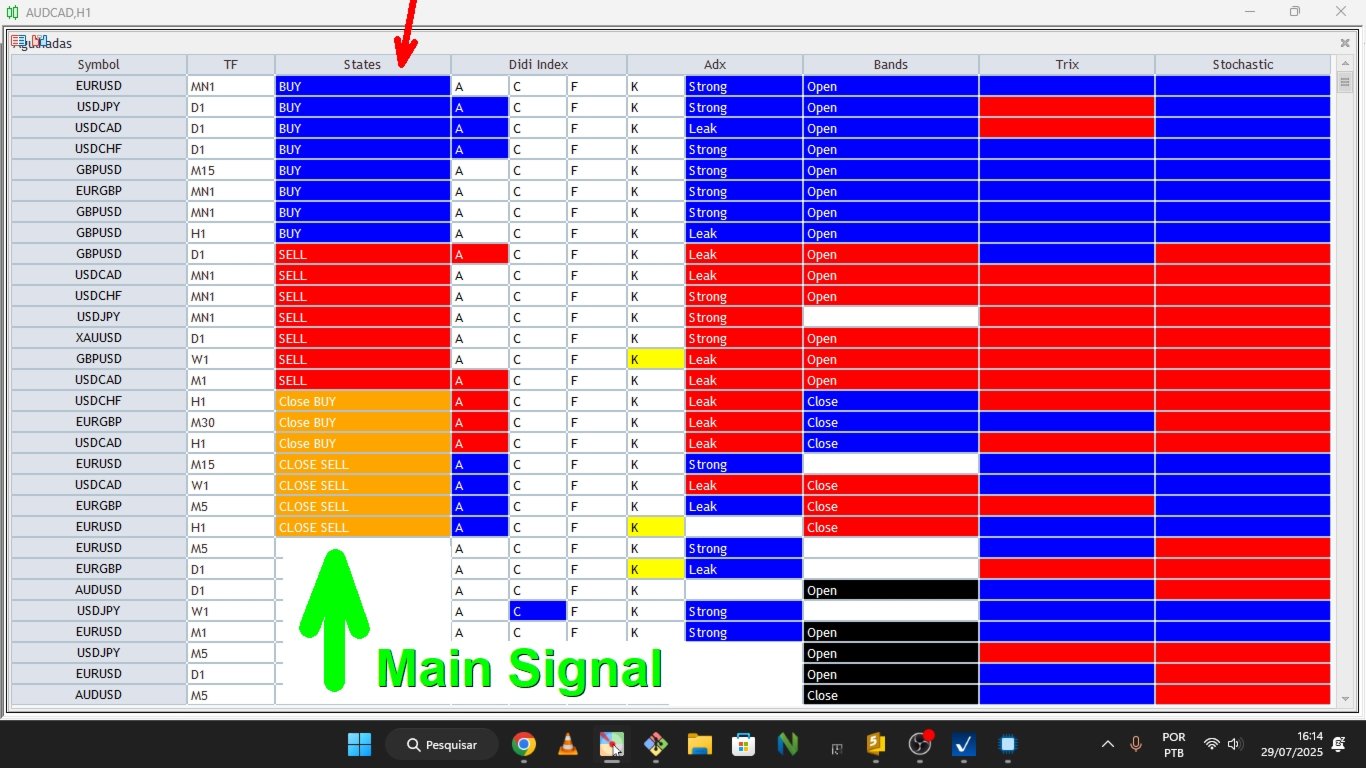
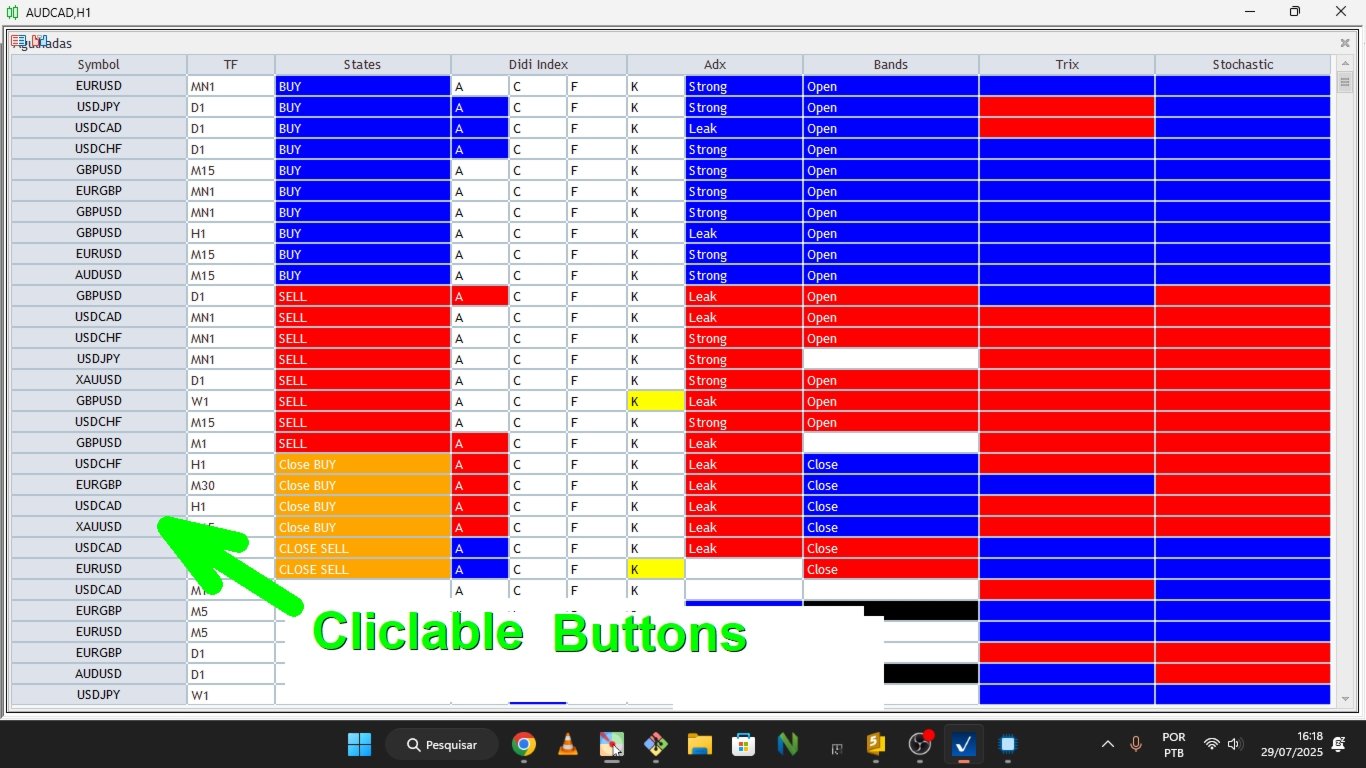
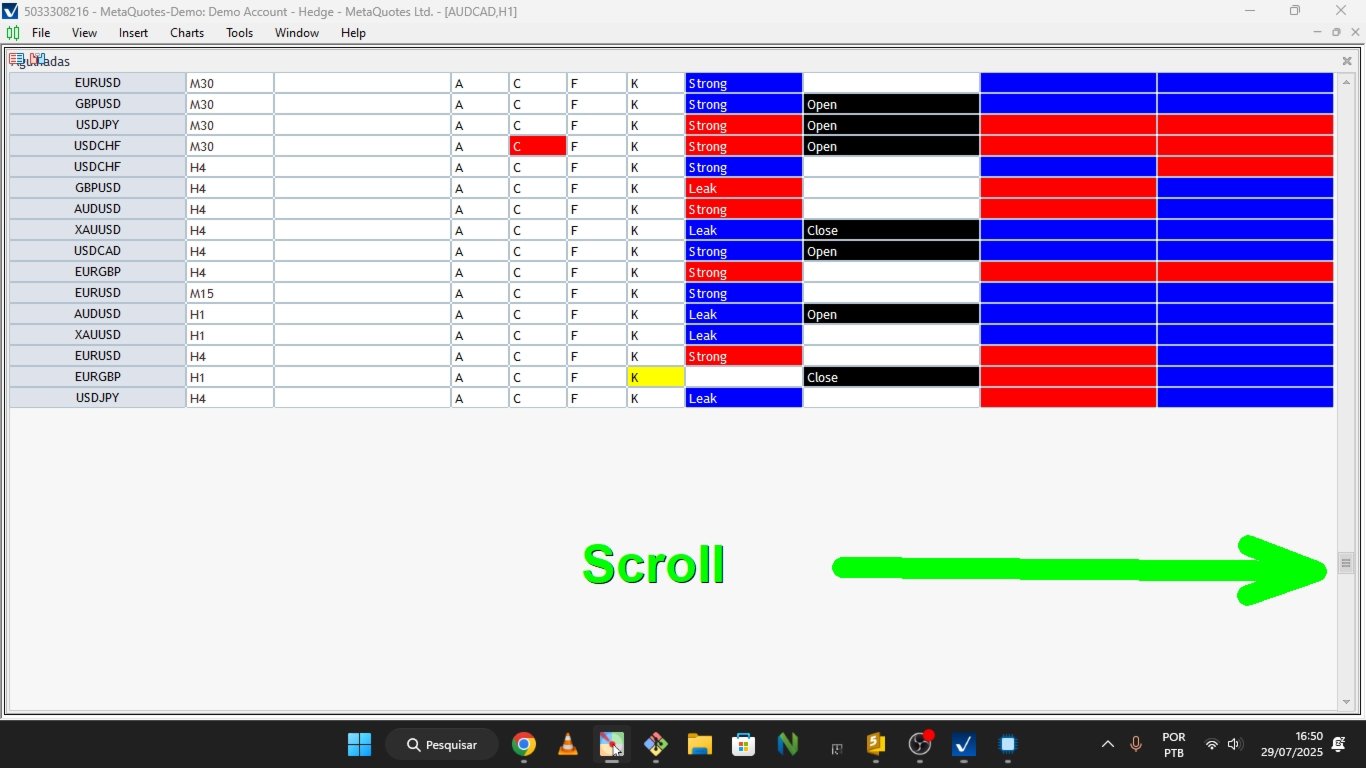
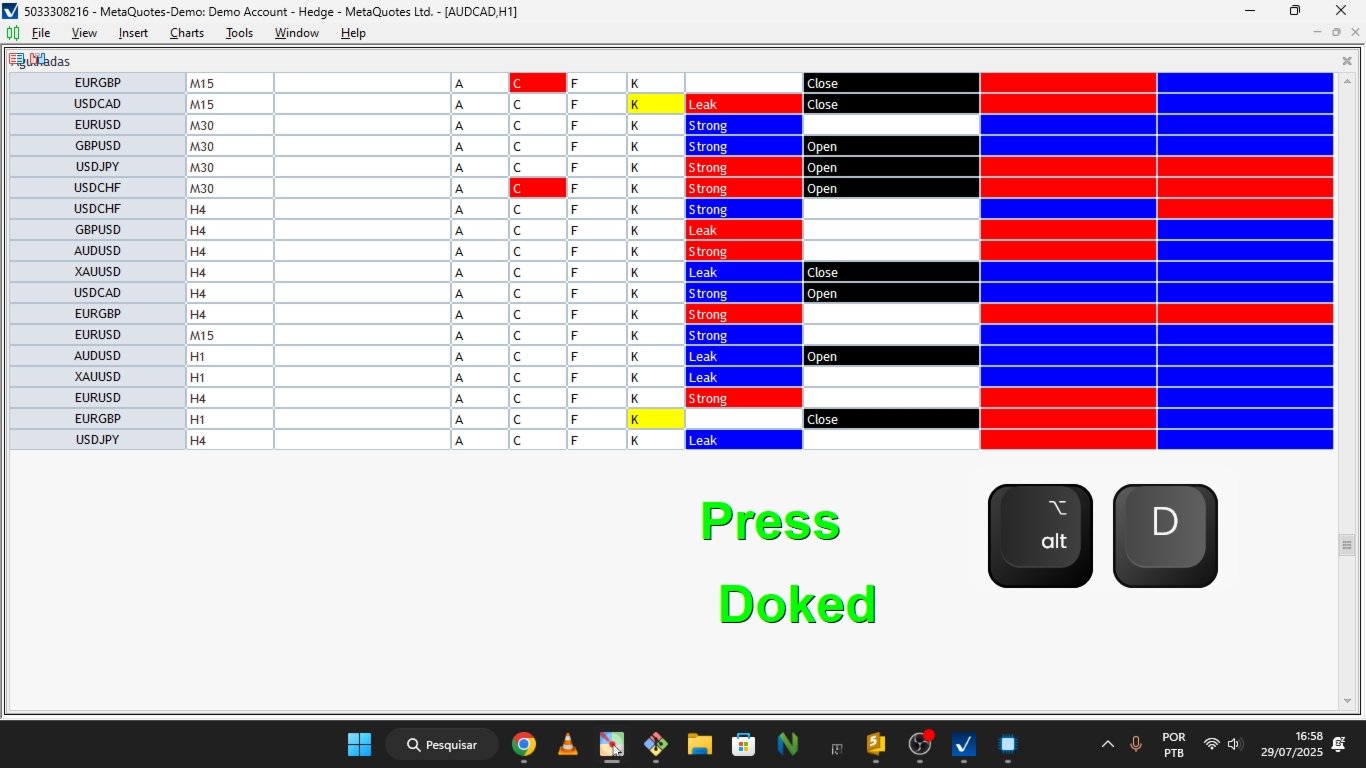
The viewing panel displays, for each monitored asset:
- Color: Blue for buy signals and red for sell signals
- Status: Entry identified, suggested exit, or partial alert
- Activated indicators: Visually shows which filters were met
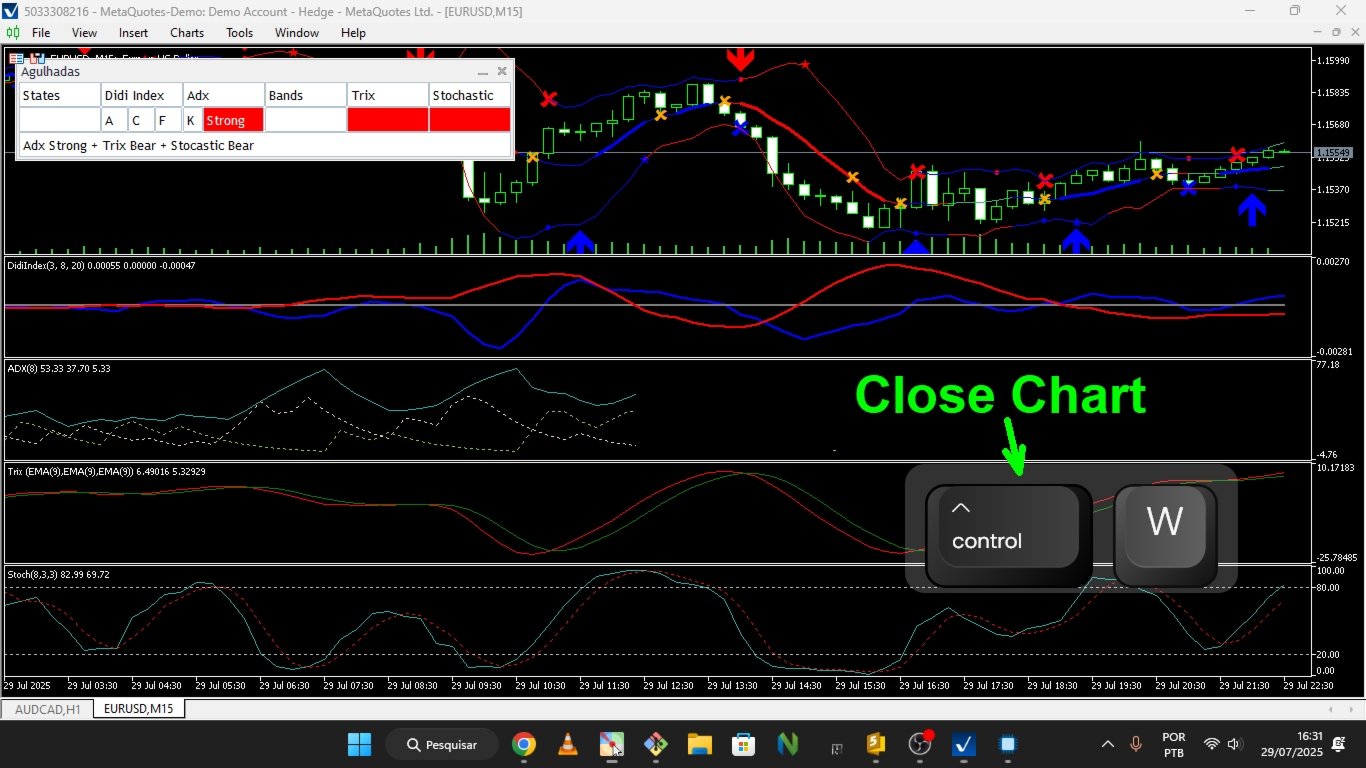
Clicking on a listed asset will automatically open the chart with the configured indicators, showing the signals exactly when they occurred.
Scanner Applications
Ideal for those who use this technical analysis approach with moving averages and want to automate the screening process of assets. The tool saves time, reduces noise, and allows focus on assets that truly present setups compatible with the chosen methodology.
Default Settings
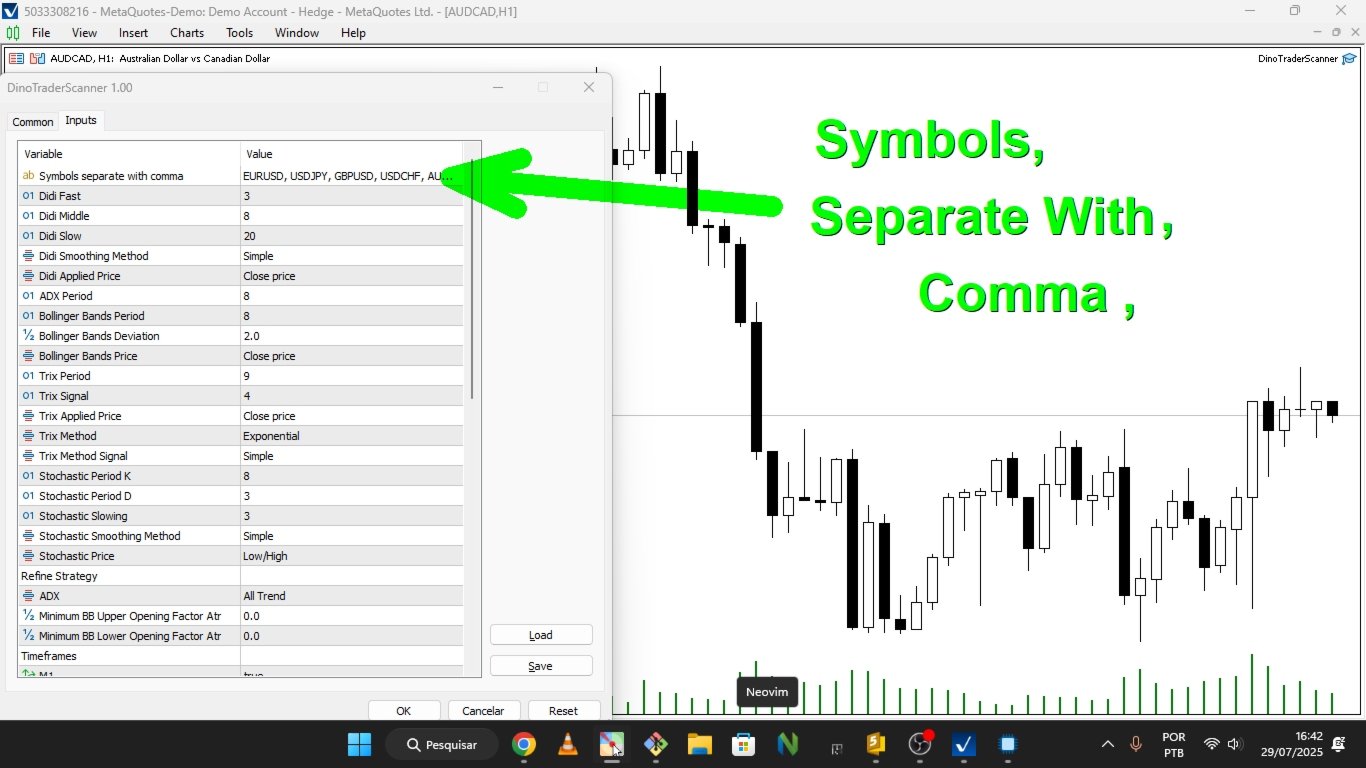
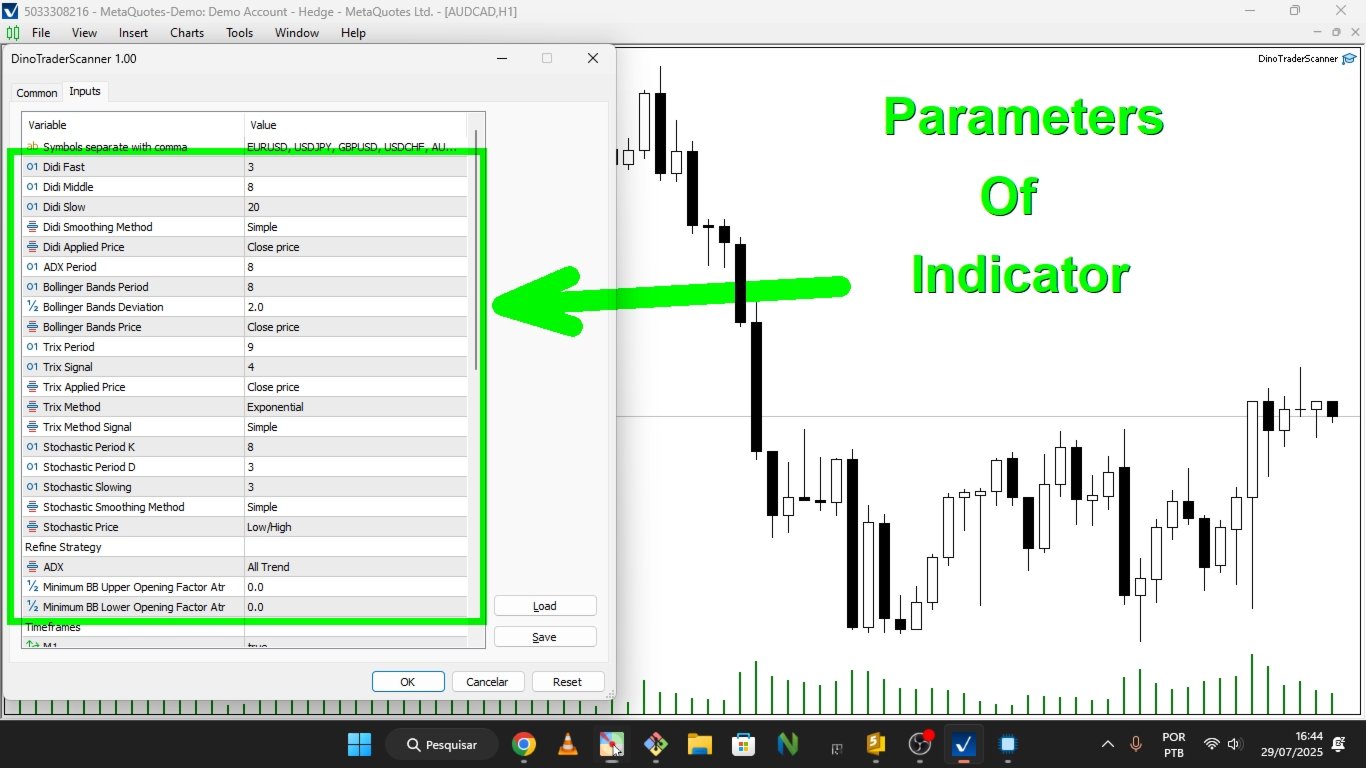
The scanner uses the following parameters by default, all adjustable by the user:
- Moving Averages: 3 / 8 / 20
- ADX: 8 periods
- Bollinger Bands: 8 periods, deviation 2
- Trix: 9 periods with a 4-period average
- Stochastic: 8 / 3 / 3
Important Note
This scanner was developed independently and uses only the main filters widely discussed in public and educational communities. It does not include advanced elements specific to any proprietary methodology, such as named visual patterns, subjective interpretations, or proprietary teachings. For comprehensive study of any strategy, official sources are recommended.