WaveTheory Fully automatic calculation
- Indicators
-
Kaijun Wang
 Cooperation contact QQ: 556024
Cooperation mailbox: 556024@qq.com
Cooperation WeChat: 556024
TGGOUP: https://t.me/+qmlWO6RSTPY1ODc1 - Version: 7.10
- Updated: 11 April 2023
- Activations: 5
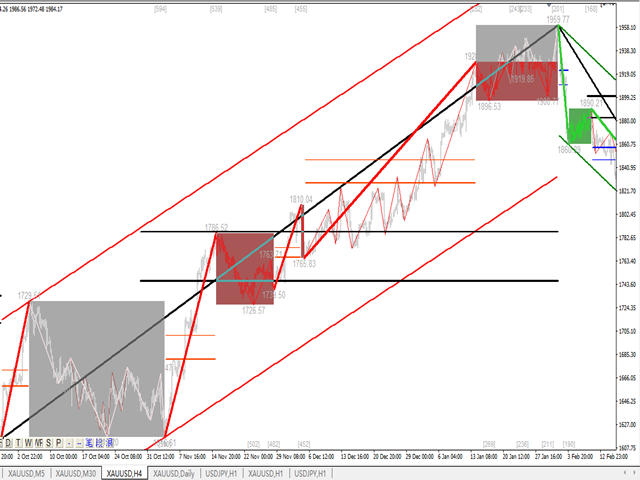
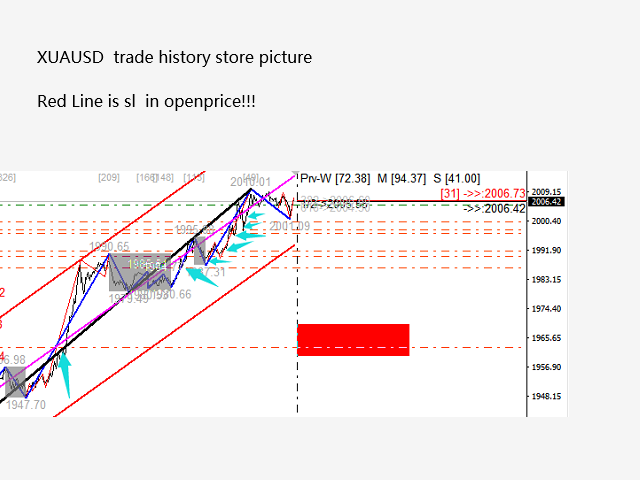
This indicator is an indicator for automatic wave analysis that is perfect for practical trading!
Note: I am not used to the Western name for wave classification. Influenced by the naming habit of Chaos Theory (Chanzhongshuochan), I named the basic wave as pen , the secondary wave band as segment , and the segment with trend direction as main trend segment (this naming method will be used in future notes, let me tell you in advance), but the algorithm is not closely related to Chaos Theory, so please do not confuse it. It reflects the ever-changing and complex operating rules summarized by my analysis of the market.
The bands are standardized and defined, so that different people no longer have different bands. The drawing methods that cause human interference are eliminated, which plays a key role in the strict analysis of the entry.
Using this indicator is equivalent to improving the aesthetics of the trading interface, abandoning the most primitive K-line trading and taking you to a new trading level. If it is not for trading, it will also improve the customer's perception in publicity.
Indicator content:
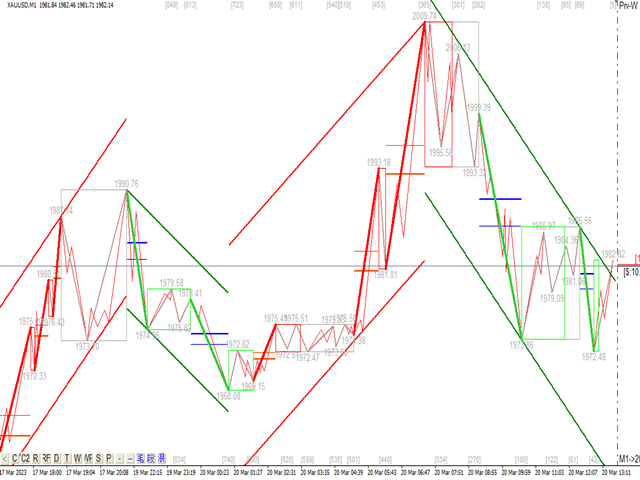
1. Basic wave (pen) : First, we find out the basic wave turning point in the price fluctuation process. Of course, its orderliness is low, which provides a basis for the next step of calculation.
2. Secondary bands : Based on the basic waves, the algorithm analysis is used to obtain more obvious secondary bands, which provide the analysis basis for the waves.
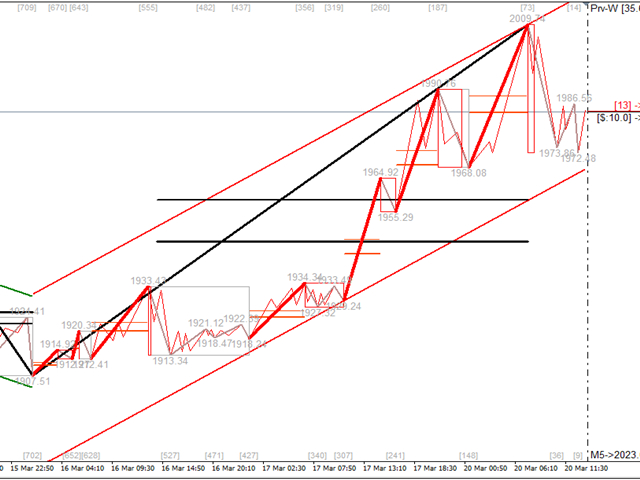
3. Waves : have clearer trends and more intuitive directions. To analyze whether a wave continues, we need to look at the secondary band shape. By analyzing the secondary composition, we can get a prediction of the subsequent wave.
4. Channel: Channel calculation uses linear regression method for calculation.
5. Retracement: Two important retracements in the wave will be shown at the end of each wave. The relative strength of these important retracements and the actual retracements obtained in actual combat determines the momentum of the trend.
6. Oscillation range: The oscillation range is marked in the indicator
Indicator practice:
1. The practical theory comes from the basic wave theory and Tao theory.
2. Practical theory comes from practical practice. You can always gain something by reading the pictures a thousand times.
3. I wanted to write some practical experience, but I found that the operation plan has been slightly adjusted for different varieties and strengths. Trading is constantly being written and updated. Trading is like a line buried in the sand. Even if you grab the rope, the sand keeps changing its shape.
4. After defining the waves quantitatively, trading will become simple and effective, the trend will become very clear, and with the general trend in mind, everything will become simple and effective.
5. Whether it is left-side trading or right-side trading, whether it is trend trading or shock trading, this set of indicators has its answer. Everyone needs to feel the rhythm, level, momentum and time point of the trend and shock, which are extremely important.
6. To understand and trade waves, you must analyze at multiple levels and periods.
Practical experience:
1. Although the Wave Theory and the Dow Theory are written into books, they are not completely in line with the natural wave law. In the actual transaction analysis process, many difficult situations will be found.
2. Below we can divide the market into two types, orderly and analyzable market and disordered market.
3. Orderly and analyzable market trends and fluctuations can be analyzed by us, that is, the part that can be plotted and traded. Once the orderliness of this part is established, it will continue to have the orderly characteristics, so we can get enough profit from it.
4. In a disorderly market, fluctuations will appear disorderly. Different from shocks, you cannot participate in a disorderly market. Make money in an orderly market and avoid it in a disorderly market.
It is more suitable for gold, crude oil, pound sterling, bitcoin and other trend-oriented products.


User didn't leave any comment to the rating