Supports And Resistances Lines MTF MT4

4.55

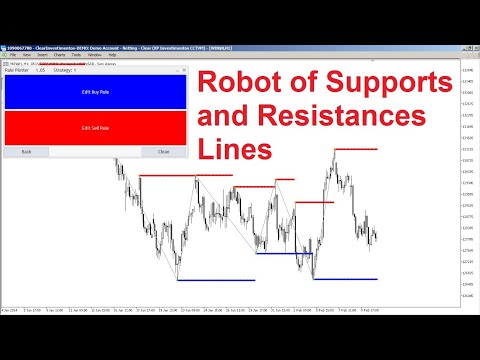
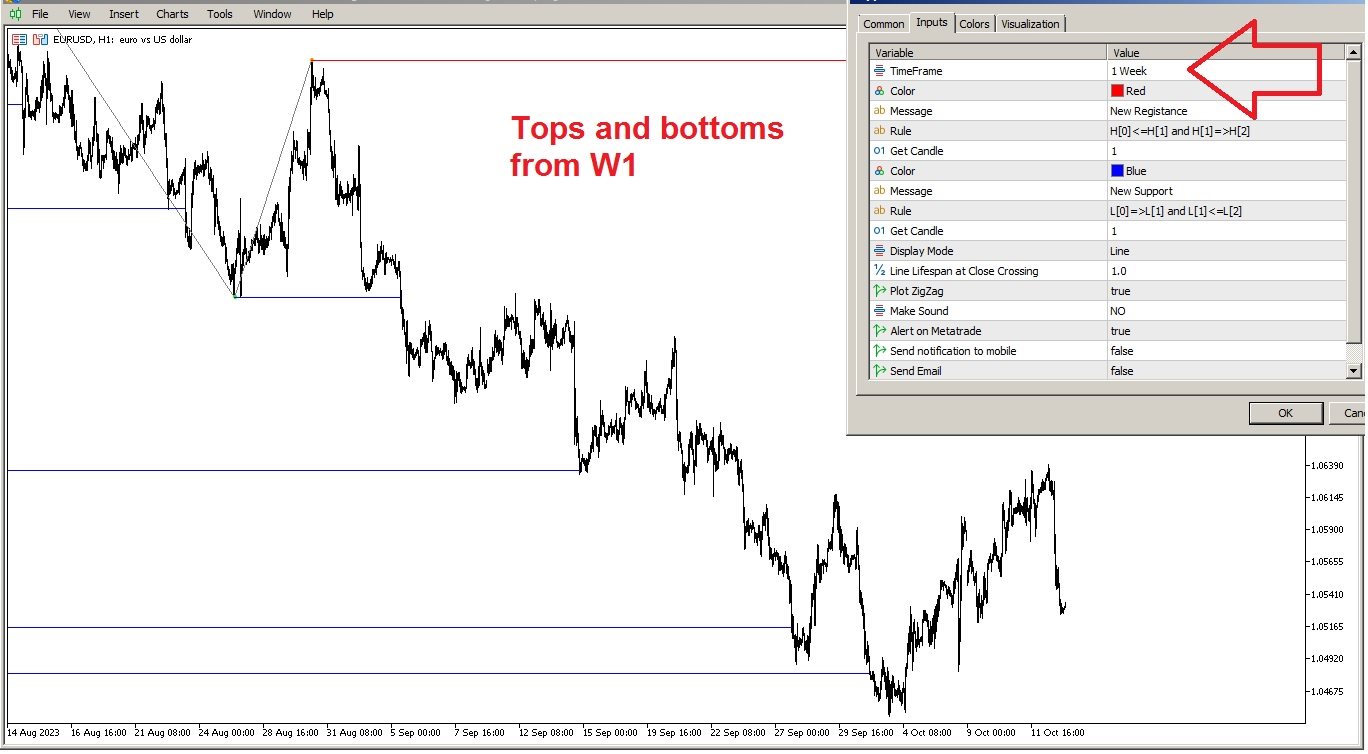
Supports and Resistances, was created to help you identify tops and bottoms automatically on several different timeframes and thus plot these tops and bottoms on the current chart.

Let's go to the explanation of the creation of resistances

There is a rule field, which you can define what is a top and bottom the top rule is set by default like this:

H[0]<=H[1] and H[1]=>H[2]

Where:


Element Description
H  means High
[0]  means current candle
[1]  means previous candle
<=  means lower or equal
=>  means higher or equal

So in this expression we first check if the current High is less than or equal to the Previous High using the rule:

H[0]<=H[1]

And then we check if the Previous High is greater than or equal to the Previous High, with the expression:

H[1]=>H[2]

The "And" joins the two expressions, and if true it means we have a new resistance:

and

However, we still have to pick the correct candle to make the mark, and the correct candle is not the current candle, but the previous candle, that is candle [1]

Then we use this second parameter to get the correct candle

Get Candle = 1

And now we have the correct point of resistance


Now let's move on to creating Supports

To create funds we have the following standard rule:

L[0]=>L[1] and L[1]<=L[2]

Where the Symbols are similar to the tops rule, just change the L to Low


Element Description
L  means Low
[0]  means Current Candle
[1]  means Previous Candle
<=  means lower or equal
=>  means higher or equal

In this rule to create the background we first check if the Current Low is greater than or equal to the previous Low with the expression.

L[0]=>L[1]

And then we check if the Previous Low is greater than or equal to the Before Low using the expression.

L[1]<=L[2]

And join the two bottom rules with the "and" operator.

and

With that we have a new bottom signal, but we still need to get the correct candle that is the previous candle that is the candle [1] we get the correct candle with the parameter:

Get Candle = 1

And that's it now we have a new bottom correctly configured


Create rules for tops and bottoms

To create your bottoms and tops rules you must create a logical or mathematical formula that returns a true or false value

If the result of your Mathematical expression is true it means you have a new top or a new bottom

Your expression can also return any non-zero number to indicate that there is a new support or a new residency, because in programming a non-zero number means true too

Rule to create the Rule

Your rule should always follow the following logic:

value + operator + value + operator + value + operator + value + operator ...

See that always after a value comes an operator, and so on, but there is still an exception, the only operators you can use after another operator is the minus sign, to indicate that the next value is negative, and the logical operator not which is a little more complex but serves to expect a false result of a value that is in front of it, below we will see the lists of all available operators.


Mathematical Operators for creating tops and bottoms

Operator Description
+  Sum
-  Subtraction
*  Multiplication
/  Division

Relational Operators for creating resistances and supports

Operator Description
<  Lower
>  Higher
=  Equal
!=   Not Equal
<=  Lower or Equal
>=  Higher or Equal

Logical Operators for creating supports and resistances

Operator Description
and  &  And
or |  Or
not !  Not

And now let's go to the values you can use in your tops and bottoms rules

Price values for creating bottoms and tops

Value Description
O Open
H High
L Low
C Close

Indices to select which candle you want to use in calculating tops and bottoms

You can select the candlestick by its displacement, 0 means the current candlestick, 1 means the previous candlestick and so on...

Bar Description
[0] Current Candle
[1] Previous Candle
[2] Previous Candle to Previous Candle
[3]  ...

Numerical values for creating top and bottom

You can use integer or real values, however you should not use a comma but a point to define the fruiting point of the real number.

Characters Description
. 0 1 2 3 4 5 6 7 8 9 Numbers

Values resulting from another expression to create bottom and top

You can use parentheses to isolate an expression and create a value with it.

Example:

(value + operator + value) operator (operator + value + operator) operator ...
Symbol  Description
( ) Parentheses to create new Values

Maximum size of tops and bottoms rule

Due to a limitation of the metatrade, the maximum length of the rule is 254 characters, but this still makes a very long rule, see an example of a rule within the limit of the metatrade with 251 characters.

O[1] = C[1] and O[1] = C[1] and O[1] = C[1] and O[1] = C[1] and O[1] = C[1] and O[1] = C[1] and O[1] = C[1] and O[1] = C[1] and O[1] = C[1] and O[1] = C[1] and O[1] = C[1] and O[1] = C[1] and O[1] = C[1] and O[1] = C[1] and O[1] = C[1] and O[1] = C[1]

See that this rule checks if the previous candle is a doji several times, there is no need for that, this example is just for you to see the size of the rule you can create for tops and another rule like that for bottoms.

But anyway, if your rule doesn't fit you can remove the whitespace and use the shorthand forms of the logical operators:


Logical Operators in abbreviated form

Operator Short Form Operator
and &
or |
not !

With this you can create very large tops and bottoms rules using that space available for them.


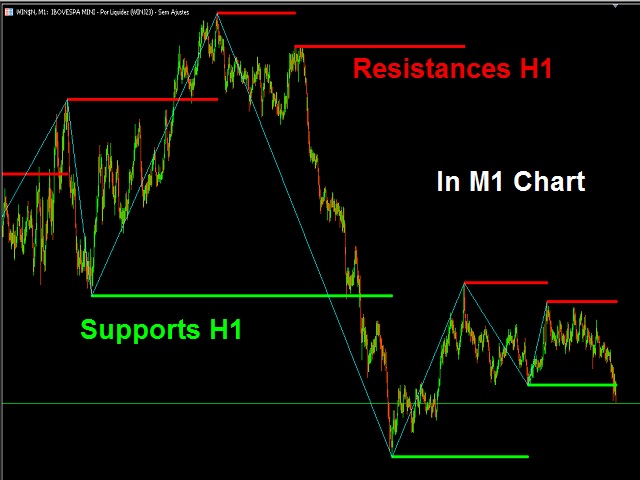
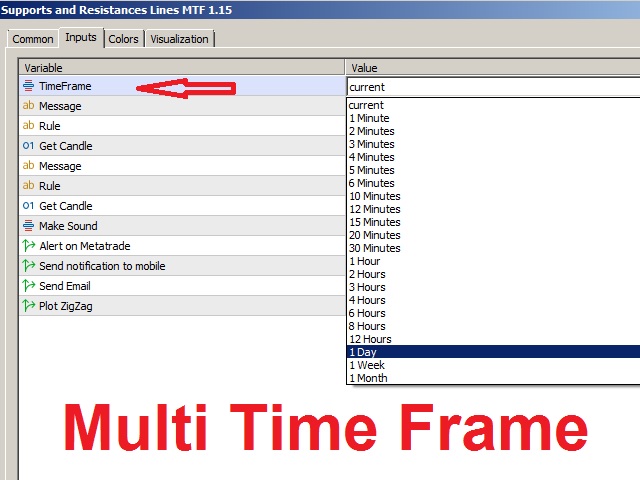
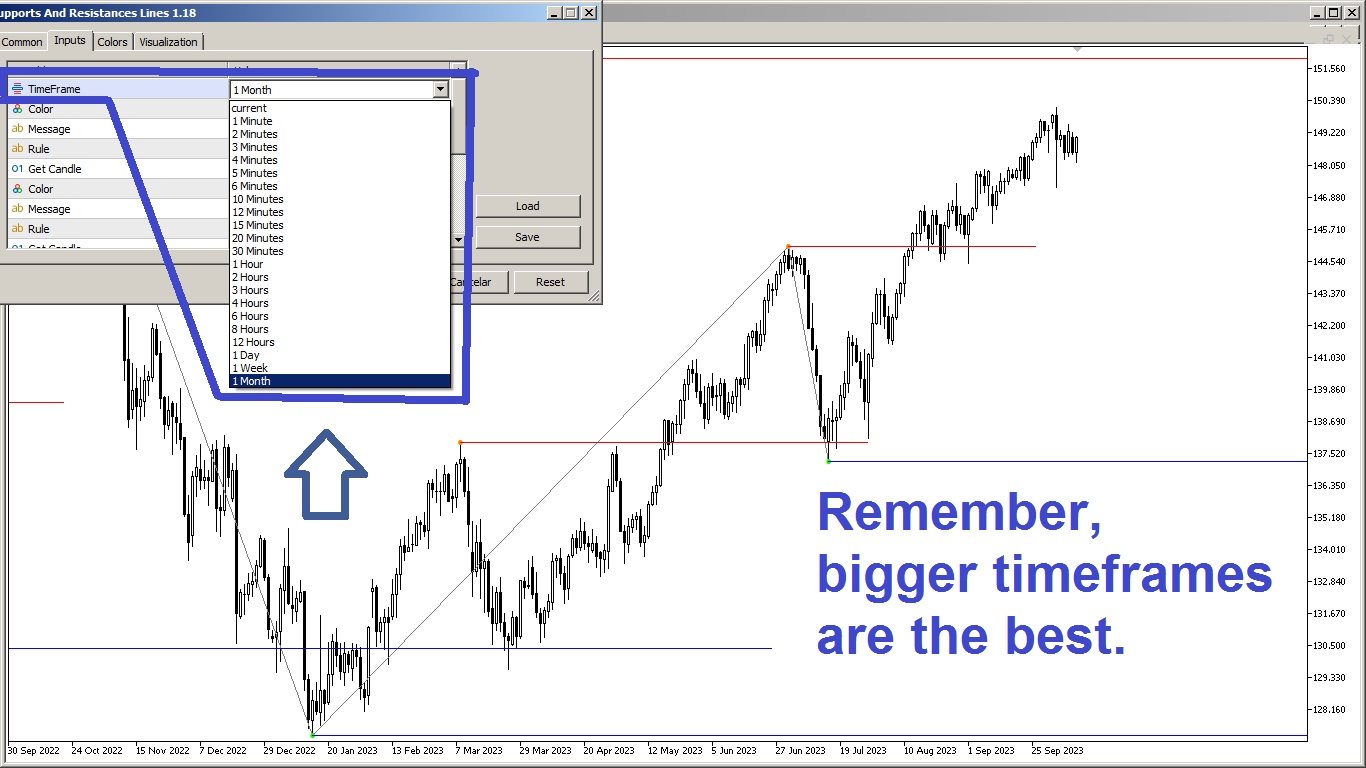
This indicator is an MTF

This means Multi Time Frame, which means that in addition to the tops and bottoms of the current chart you are using, it can also show the tops and bottoms of larger timeframes and thus plot on your current chart, this brings much more security when trading. , because you are seeing where the major chart timeline resistances and supports are passing before you enter your trades.


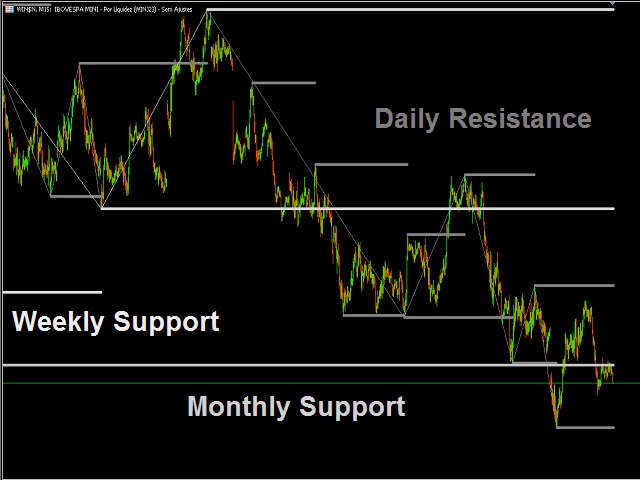
Advantages of the Paid Indicator


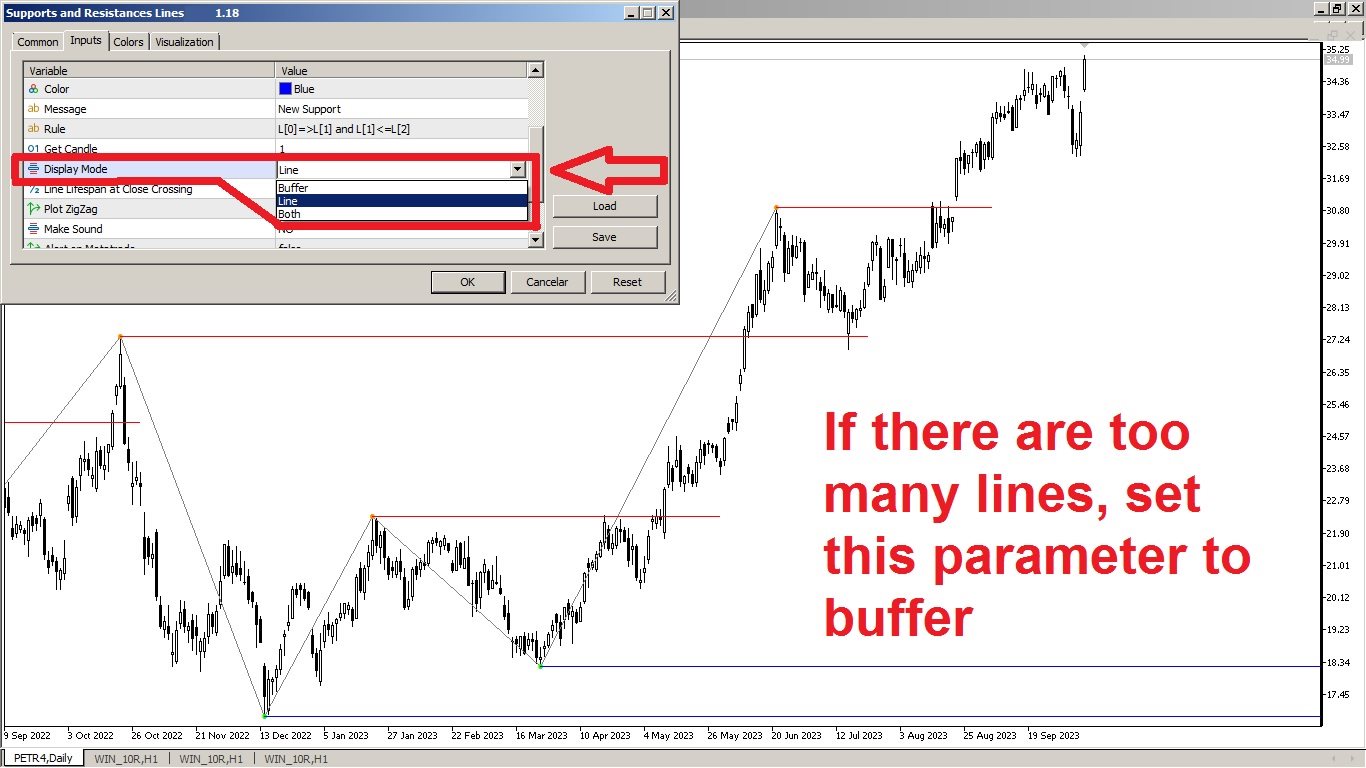
As this is a paid version, you can use all support and resistance from other timeframes on your current chart, this has advantages as you can select the support or resistance color from a weekly, monthly, or whatever chart you choose. , so you know the strength of the support and resistance point by the color you see plotted on your screen, but if you don't want to buy now, you can test the free version here:Download free support and resistance indicator for metatrade 5 or you can download the paid version from this link: download multi time frame support and resistance indicator for metatrade 5


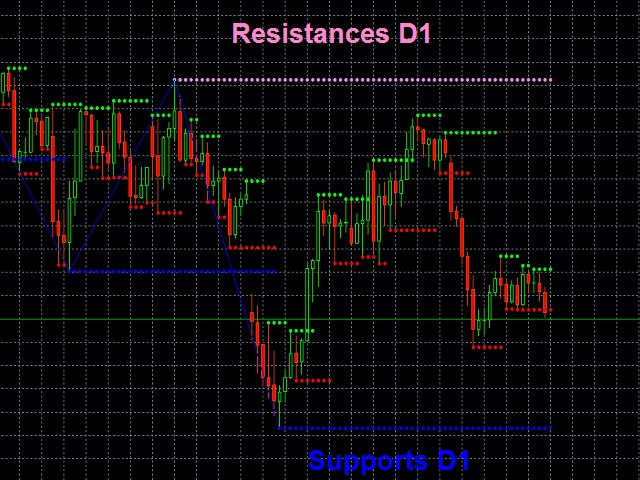
The difference between them is that in the free one, in addition to the option to plot tops and bottoms of the current chart as in the paid one, it will only have the MTF option to plot the tops and bottoms of the Daily chart, while in this paid version you have the MTF option of all the timeframes that are available for the metatrade, so this is a more complete version for professionals who need more confidence to know if the point where they are entering or exiting a trade is a point where there is a relevant resistance or support where the market usually makes a reversal and ends up stopping the trade without him knowing that there was a top or bottom of a different timeframe than the one he was using.


With this indicator you can monitor the tops and bottoms of all timeframes at the same time, and this will give you more clarity and certainty of where you can or cannot trade, as you know which points the market can run more and which points and which points there may be a reversal or a congestion between a support and a resistance.


Appearing to be an indicator, this indicator is price action, that is, it is not lagging behind the price as technical analysis indicators normally are.


This indicator analyzes the price movement and instantly gives you the points where you can operate with the statistics in your favor that are at the support and resistance points, using the price action in your favor in a fully automatic way.


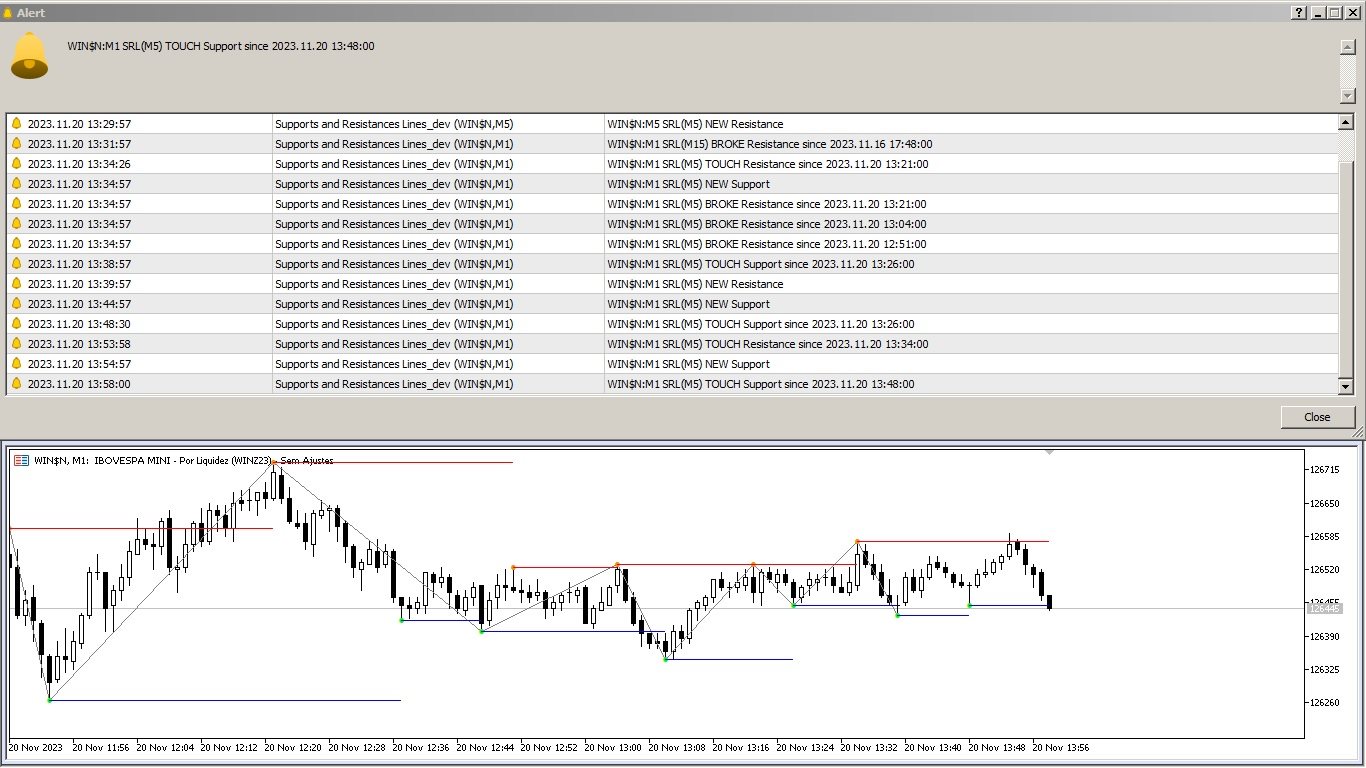
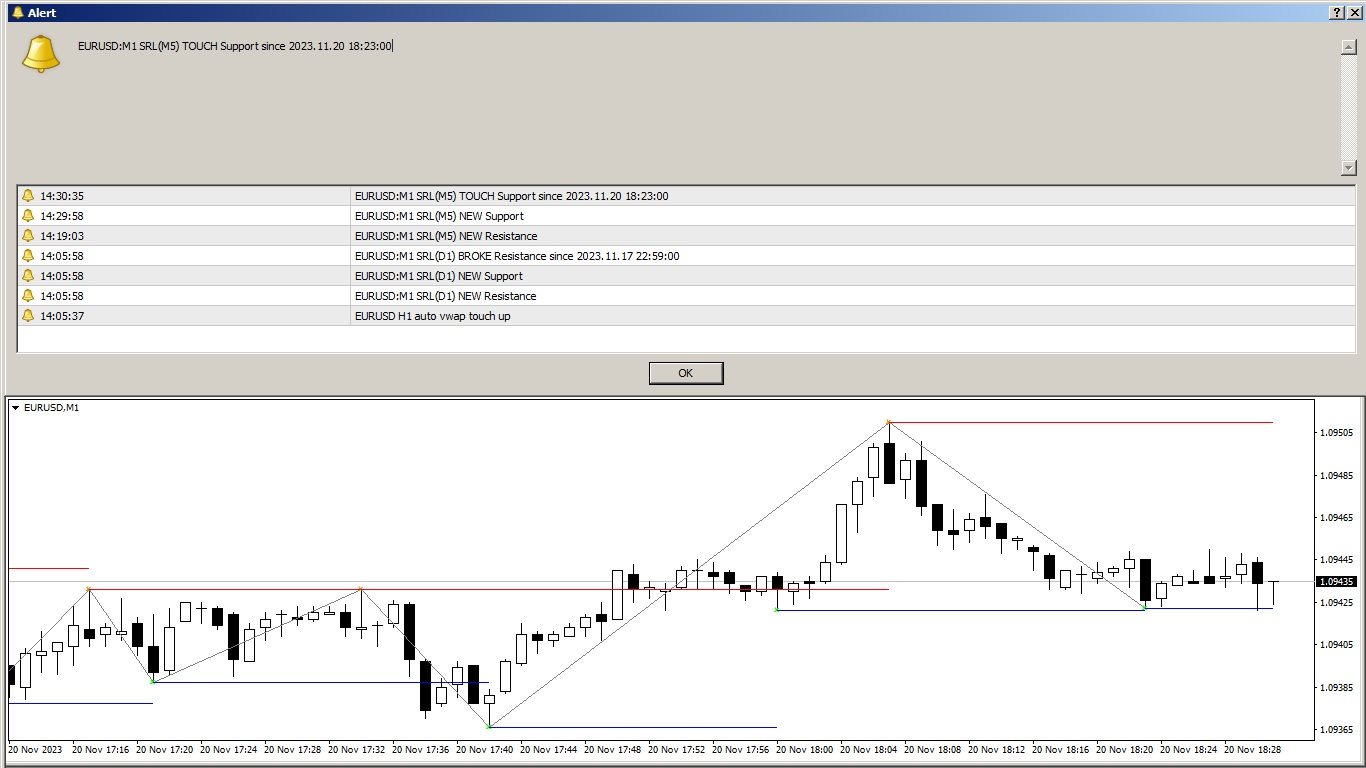
Tops and Bottoms Alerts

You can also configure alerts with a custom message when your tops and bottoms rule occurs. The available alerts are:


  1. Sound Alerts
  2. Message alerts in metatrade itself
  3. Notification messages alert on your Mobile
  4. Message alert for your email

Upcoming Updates of Bottoms and Tops

In the next updates, I intend to bring a zig zag that connects the tops and bottoms of supports and resistances, to show the market movement of different fractals since it is an indicator in MTF we will be able to make a very good zigzag display in MTF, however, to make the market movement, the top and bottom cannot be on the same candle, if they are, the zigzag MTF itself will select which one will be considered for the market movement and will ignore the other.


But since you are in control of deciding what is a top and what is a bottom, you can create a rule to ignore the top that is not relevant to market movement.


Create your rules and Post here

Post your rules here in the comments, in case they are not working I or other members of the community can test it and to help other users who are having the same problem or who don't have a good strategy for creating tops and bottoms, if your strategy has an interpretation problem within the indicator, with your post I can detect the error and correct it so that the indicator can understand and translate it into logical and mathematical language.


Supports and Resistances for Metatrader 5
Reviews 20
cherryann gibbons
96
cherryann gibbons 2025.03.25 02:57 
 

Wonderful thank you Francisco really do appreciate it.

Heiner G.
710
Heiner G. 2024.08.03 11:24 
 

Very accurate indicator. I like to use S/D indicators that show me which zones exist in higher TF. The VWAP indicator also does a very good job! Update: I have been using this indicator in the chart for 3 days. It is by far the best S/D indicator I have ever had. I use the lines from TF: H4 and D and trade in smaller units. Absolutely perfect! Great work!

Mfathi
73
Mfathi 2024.05.25 13:28 
 

Did you make an EA base on this indicator

Recommended products
Free automatic Fibonacci is an indicator that automatically plots a Fibonacci retracement based on the number of bars you select on the BarsToScan setting in the indicator. The Fibonacci is automatically updated in real time as new highest and lowest values appears amongst the selected bars. You can select which level values to be displayed in the indicator settings. You can also select the color of the levels thus enabling the trader to be able to attach the indicator several times with differe
FREE
The Auto Fibonacci Indicator is a professional technical analysis tool that automatically draws Fibonacci retracement levels based on the most recent closed Daily (D1) or 4-Hour (H4) candle. These levels are widely used by traders to identify key support , resistance , and trend reversal zones . This version is designed for manual trading and supports a powerful trading strategy using Fibonacci levels combined with a 50-period EMA (Exponential Moving Average) , which you can easily add from MT4
FREE
Pivot Point Fibo RSJ is an indicator that traces the support and resistance lines of the day using Fibonacci rates. This spectacular indicator creates up to 7 levels of support and resistance through Pivot Point using Fibonacci rates. It is fantastic how the prices respect each level of this support and resistance, where it is possible to perceive possible entry/exit points of an operation. Features Up to 7 levels of support and 7 levels of resistance Set the colors of the levels individually
FREE
Description: The indicator measures, through the zigzag indicator, the levels of trend or correction. It shows in the chart the levels of each low or high detected. KEY LINKS:   How to Install  –  Frequent Questions  -  All Products  How is this indicator useful? This indicator determines, depending on Zigzag parameter if a trend is beginning, developing, or ending This indicator determines the direction of the trend Components Levels as positive or negative numbers, depending on the direction
FREE
Follow The Line
Oliver Gideon Amofa Appiah
3.94 (16)
FOLLOW THE LINE GET THE FULL VERSION HERE: https://www.mql5.com/en/market/product/36024 This indicator obeys the popular maxim that: "THE TREND IS YOUR FRIEND" It paints a GREEN line for BUY and also paints a RED line for SELL.  It gives alarms and alerts of all kinds. IT DOES NOT REPAINT and can be used for all currency pairs and timeframes. Yes, as easy and simple as that. Even a newbie can use it to make great and reliable trades. NB: For best results, get my other premium indicators for more
FREE
Necessary for traders: tools and indicators Waves automatically calculate indicators, channel trend trading Perfect trend-wave automatic calculation channel calculation , MT4 Perfect trend-wave automatic calculation channel calculation , MT5 Local Trading copying Easy And Fast Copy , MT4 Easy And Fast Copy , MT5 Local Trading copying For DEMO Easy And Fast Copy , MT4 DEMO Easy And Fast Copy , MT5 DEMO The homeopathic indicator is also called the CCI indicator. The CCI indicator was proposed
FREE
High Low Open Close MT4
Alexandre Borela
4.81 (21)
If you like this project, leave a 5 star review. This indicator draws the open, high, low and closing prices for the specified period and it can be adjusted for a specific timezone. These are important levels looked by many institutional and professional traders and can be useful for you to know the places where they might be more active. The available periods are: Previous Day. Previous Week. Previous Month. Previous Quarter. Previous year. Or: Current Day. Current Week. Current Month. Current
FREE
Rainbow MT4
Jamal El Alama
Rainbow MT4 is a technical indicator based on Moving average with period 34 and very easy to use. When price crosses above MA and MA changes color to green, it’s a signal to buy. When price crosses below MA and MA changes color to red, it’s a signal to sell. The Expert advisor ( Rainbow EA MT4) based on Rainbow MT4 indicator, as you can see in the short video below is now available here .
FREE
Smart FVG Indicator MT4   delivers professional Fair Value Gap (FVG) detection, monitoring, and alerting directly on your charts. It combines   ATR-based filtering   with structure-aware logic to remove noise, adapt to liquidity, and keep only the most relevant imbalances for precise decisions. Key Advantages Accurate FVG detection:   Identifies genuine inefficiencies, not just simple candle gaps. ATR-based precision:   Adaptive sensitivity filters out low-quality signals across markets and time
FREE
SX Supply Demand Zones accurately identifies and draws high-probability Supply and Demand zones using a sophisticated algorithm. Unlike traditional indicators that clutter your chart, this indicator is designed with a focus on performance and a clean user experience. New Unique Feature: Interactive Legend System What truly sets this indicator apart from everything else is the Interactive Control Legend. You have a professional dashboard directly on your chart that allows you to: Show/Hide: Ins
FREE
Auto Supply and Demand Oscillator is an indicator for MetaTrader 4 and MetaTrader 5 that detects supply and demand zones automatically and displays them as a single oscillator value at the bottom of the chart, instead of drawing rectangles directly on price. Concept Supply zones are price areas where strong selling created a sharp downward move away from a balance area. Demand zones are price areas where strong buying created a sharp upward move. Traditional implementations draw boxes on the
FREE
Double HMA lines MTF
Pavel Zamoshnikov
5 (1)
This is a multi-timeframe version of the popular Hull Moving Average (HMA). The Double HMA MTF Light indicator combines two timeframes on a single chart. The HMA of the higher timeframe defines the trend, and the HMA of the current timeframe defines short-term price movements. The indicator is freely distributed and hasn't audio signals or messages. Its main function is the visualization of price movements. If you need advanced functionality of the HMA multi-timeframe indicator (information ab
FREE
The free version of the Hi Low Last Day MT4 indicator . The Hi Low Levels Last Day MT4 indicator shows the high and low of the last trading day . The ability to change the color of the lines is available . Try the full version of the Hi Low Last Day MT4 indicator , in which additional indicator features are available : Displaying the minimum and maximum of the second last day Displaying the minimum and maximum of the previous week Sound alert when crossing max . and min . levels Selecting an arb
FREE
UPD1 X00 Levels
Vitaliy Kuznetsov
5 (10)
The indicator shows   round levels   on the chart. They are also called   psychological , banking, or levels of major players. At these levels, there is a real fight between bulls and bears, the accumulation of many orders, which leads to increased volatility. The indicator   automatically   adjusts to any instrument and timeframe. When the   level 80   is broken through and then tested, we   buy. When   level 20   is broken through and then tested, we   sell. The target is 00. Attention. Due t
FREE
PZ Penta O MT4
PZ TRADING SLU
2.33 (3)
The Penta-O is a 6-point retracement harmonacci pattern which usually precedes big market movements. Penta-O patterns can expand and repaint quite a bit. To make things easier this indicator implements a twist: it waits for a donchian breakout in the right direction before signaling the trade. The end result is an otherwise repainting indicator with a very reliable trading signal. The donchian breakout period is entered as an input. [ Installation Guide | Update Guide | Troubleshooting | FAQ | A
FREE
This indicator shows the latest untouched support and resistance as horizontal lines. The indicator can show support/resistance from higher timeframes. With this indicator you can e.g. easily see the support/resistance of the timeframes H4, D1 and W1 on a H1 chart, which can be a big advantage while time your entry on H1. This is the FREE version of the indicator: Support Resistance Multi Time Frame The free version works only on EURUSD and GBPUSD! Parameters referenceTF: the timeframe from whi
FREE
Email Drawdown Alert
Roman Starostin
5 (12)
Free informative Indicator-helper. It'll be usefull for traders who trade many symbols or using grid systems (Averaging or Martingale). Indicator counts drawdown as percent and currency separate. It has a number of settings: Count deposite drawdown according equity value and send e-mail or notifications to user if DD more than set; Sending e-mail when max open orders reached; Shows price and remaining pips amount before MarginCall on current chart and Account generally; Display summary trade lot
FREE
SC MTF Rsi MT4
Krisztian Kenedi
5 (1)
Relative Strength Index (RSI) indicator with multi-timeframe support, customizable visual signals, and configurable alert system. Freelance programming services, updates, and other TrueTL products are available on my MQL5 profile . Feedback and reviews are highly appreciated! What is RSI? Relative Strength Index (RSI) is a momentum oscillator that measures the speed and magnitude of price changes. The indicator oscillates between 0 and 100, comparing the magnitude of recent gains to recent lo
FREE
Aroon Classic
Etsushi Ishizuka
Overview of the Aroon Classic Indicator The Aroon Classic indicator is a technical tool that quantitatively identifies the emergence and persistence of trends on a chart. It uses two lines—“Aroon Up” and “Aroon Down”—to display trend strength and turning points within a range of 0–100. A higher Aroon Up value indicates a stronger uptrend, while a higher Aroon Down value indicates a stronger downtrend. Key Features Visually distinguishes trend initiation and reversal Customizable calculation peri
FREE
-- Simple but effective. Inversion Indicator -  What is it? A trend-following overlay indicator that combines SuperTrend logic with exponential curve technology. It detects trend direction, draws a dynamic channel on the chart, and sends real-time alerts when the trend reverses. How does it work? The indicator calculates an exponential baseline using ATR and a SuperTrend factor. When price closes above or below this baseline, a trend reversal is confirmed. A green arrow marks the start of a
FREE
Persian Ichimoku: The Next Generation of Fibonacci-Enhanced Trading Elevate your Ichimoku strategy with the most advanced and customizable Ichimoku indicator on the Market. The Persian Ichimoku is not just another Ichimoku cloner; it is a professional-grade trading powerhouse designed for traders who demand precision, flexibility, and deeper market insights. By merging classic Ichimoku Kinko Hyo logic with Fibonacci ratios and the innovative Quality Line , this tool redefines trend analysis. ###
Check my paid tools they work great and I share Ea's based on them for free please r ate The Dual Timeframe RSI (Relative Strength Index) indicator is a novel trading tool that allows traders to monitor RSI readings from two different timeframes on a single chart. This dual perspective enables traders to identify potential trend confirmations and divergences more effectively. For instance, a trader might use a 1-hour RSI alongside a daily RSI to ensure that short-term trades align with the broa
FREE
FlatBreakout
Aleksei Vorontsov
FlatBreakout (Free Version) Flat Range Detector and Breakout Panel for MT4 — GBPUSD Only FlatBreakout is the free version of the professional FlatBreakoutPro indicator, specially designed for flat (range) detection and breakout signals on the GBPUSD pair only. Perfect for traders who want to experience the unique fractal logic of FlatBreakout and test breakout signals on a live market without limitations. Who Is This Product For? For traders who prefer to trade breakout of flat ranges (breakout,
FREE
Trendline indicator
David Muriithi
2 (1)
Are you tired of drawing trendlines every time you're analyzing charts? Or perhaps you would like more consistency in your technical analysis. Then this is for you. This indicator will draw trend lines automatically when dropped on a chart. How it works Works similar to standard deviation channel found on mt4 and mt5. It has 2 parameters: 1. Starting Bar 2. Number of bars for calculation The   starting bar   is the bar which drawing of the trend lines will begin, while the   number of bars for c
FREE
Head and Shoulders Pattern Indicator - Your Key to Recognizing Trend Reversals Unlock the power of pattern recognition with the "Head and Shoulders Pattern Indicator." This cutting-edge tool, designed for MetaTrader, is your trusted ally in identifying one of the most powerful chart patterns in technical analysis. Whether you're a novice or an experienced trader, this indicator simplifies the process of spotting the Head and Shoulders pattern, allowing you to make informed trading decisions. Key
FREE
Wavetrend Oscillator Indicator — Version 1.0 The Wavetrend Oscillator is a momentum-based technical analysis tool. It is designed to highlight potential momentum shifts, areas that may be overbought or oversold, and the prevailing bias when confirmed by a higher timeframe filter. How it works WT1 and WT2 Lines : Crossovers between these lines are used to indicate changes in momentum. WT1 crossing above WT2 suggests bullish conditions. WT1 crossing below WT2 suggests bearish conditions. WT3 High
FREE
AdvanceZigZag
Gholamreza Mohammad Mojaveri
5 (1)
AdvaneZigZag Indicator Are you tired of the limitations of the traditional ZigZag indicator? Meet AdvaneZigZag, the ultimate tool to simplify your market structure analysis and enhance your trading strategies. Designed with flexibility and precision in mind, AdvaneZigZag brings you advanced features to navigate the market with confidence. Key Features: 1. Enhanced Flexibility:    - While maintaining the familiar simplicity of the conventional ZigZag indicator, AdvaneZigZag offers superior a
FREE
SMA Indicator
Nitu Brijesh Yadav
Arrow Indicator (Buy/Sell Alerts) – Simple Yet Powerful Tool!             Product Version: 1.01           Indicator Type: Trend Reversal Signals           Timeframes Supported: All (Recommended: H1, H4, D1)           Key Features: Buy Signal: Green upward arrow () appears below the candle  Sell Signal : Red downward arrow () appears above the candle Accurate Trend Reversal Detection – Based on tried and tested SMA strategy. ️ Clean Chart View – Minimalist, non-i
FREE
Quantum Falcon Signal Free is a smart visual trading indicator for MetaTrader 4 designed for Forex and Gold traders. The indicator combines: • Trend analysis • RSI momentum confirmation • MACD momentum filtering • ATR volatility filtering • Higher timeframe confirmation • Smart exit signal detection Main Features: • Smart Buy and Sell signals • Exit Buy / Exit Sell alerts • Real-time dashboard on chart • Professional candle arrows • Multi-timeframe trend confirmation • ATR market volatility filt
FREE
The indicator uses the Chester W. Keltner's channel calculation method, modified by the well-known trader Linda Raschke. Due to the modification, the calculated channel contains a much more complete overview of the price movements, which allows increasing the probability of an accurate prediction of the upcoming price movement. Unlike the classic Keltner method, the base line of the channel is plotted based on the Exponential Moving Average, and the Average True Range is used to calculate the up
FREE
Buyers of this product also purchase
Genesis Matrix Pro is a professional multi-timeframe trend detection indicator designed to help traders identify high-quality market alignment with clarity and structure. It combines 12 different technical indicators into one visual alignment matrix, allowing traders to quickly see when market conditions are bullish, bearish, or neutral. A signal is generated only when the selected strategies are aligned, helping reduce noise and improve decision-making. PLEASE CONTACT ME AFTER PURCHASE TO GET
Gann Made Easy
Oleg Rodin
4.83 (163)
Gann Made Easy is a professional and easy to use Forex trading system which is based on the best principles of trading using the theory of W.D. Gann. The indicator provides accurate BUY and SELL signals including Stop Loss and Take Profit levels. You can trade even on the go using PUSH notifications. PLEASE CONTACT ME AFTER PURCHASE TO GET TRADING  INSTRUCTIONS AND GREAT EXTRA INDICATORS   FOR FREE! Probably you already heard about the Gann trading methods before. Usually the Gann theory is a ve
The Propfolio Master Suite is the ultimate all-in-one analytical workstation for professional traders. Combining the power of the Beat The Market Maker (BTMM) methodology, Smart Money Concepts (SND/Liquidity), and Advanced Volume Profile, this suite replaces multiple different indicators with one optimized engine. Monitor up to 14 pairs simultaneously from a single chart, instantly identify market cycles, and seamlessly map institutional footprints with the click of a button. The Command Center
Scalper Inside PRO
Alexey Minkov
4.74 (68)
Scalper Inside PRO Scalper Inside PRO is an intraday trend and scalping indicator for MetaTrader 4 that uses an exclusive algorithm to quickly detect market direction and key target levels. It automatically calculates entry, exit and multiple profit targets, and shows detailed performance statistics so you can see how different instruments and strategies performed. This helps you choose the most suitable trading instruments for the current market conditions. Additionally, you can easily integrat
M1 Sniper
Oleg Rodin
5 (23)
M1 SNIPER is an easy to use trading indicator system. It is an arrow indicator which is designed for M1 time frame. The indicator can be used as a standalone system for scalping on M1 time frame and it can be used as a part of your existing trading system. Though this trading system was designed specifically for trading on M1, it still can be used with other time frames too. Originally I designed this method for trading XAUUSD and BTCUSD. But I find this method helpful in trading other markets a
PRO Renko System
Oleg Rodin
5 (30)
PRO Renko System is a highly accurate trading system specially designed for trading RENKO charts. The ARROWS and Trend Indicators DO NOT REPAINT! The system effectively neutralizes so called market noise giving you access to accurate reversal signals. The indicator is very easy to use and has only one parameter responsible for signal generation. You can easily adapt the tool to any trading instrument of your choice and the size of the renko bar. I am always ready to provide extra support to help
NAM Order Blocks
NAM TECH GROUP, CORP.
3.67 (3)
MT4 Multi-timeframe Order Blocks detection indicator. Features - Fully customizable on chart control panel, provides complete interaction. - Hide and show control panel wherever you want. - Detect OBs on multiple timeframes. - Select OBs quantity to display. - Different OBs user interface. - Different filters on OBs. - OB proximity alert. - ADR High and Low lines. - Notification service (Screen alerts | Push notifications). Summary Order block is a market behavior that indicates order collection
First of all Its worth emphasizing here that this Trading Tool is Non-Repainting Non-Redrawing and Non-Lagging Indicator Which makes it ideal for professional trading . [Online course] ,   and   [manual] The Smart Price Action Concepts Indicator is a very powerful tool for both new and experienced traders . It packs more than 20 useful indicators into one combining advanced trading ideas like Inner Circle Trader Analysis and Smart Money Concepts Trading Strategies . This indicator focuses on Sm
Quants HL Break
Ferhat Mutlu
5 (2)
Advanced calculation made by pure price action to find LH and HL breakouts. It will give you a great reversal points in the market. LH and HL signals can used for the traingle breakouts as well. Once breakout happens its indicate strong reversal. Nice filter for Moving Averages. I highly suggest to use that with trend indicators. Can be used as an extra confirmation for support and resistance , supply demand indicators. The indicator is not repainting. Buffers :   SetIndexBuffer ( 0 ,UpBar);
Dynamic Forex28 Navigator
Bernhard Schweigert
4.43 (7)
Specials Discount now. The Next Generation Forex Trading Tool. Dynamic Forex28 Navigator is the evolution of our long-time, popular indicators, combining the power of three into one: Advanced Currency Strength28 Indicator (695 reviews) + Advanced Currency IMPULSE with ALERT (520 reviews) + CS28 Combo Signals (recent Bonus) Details about the indicator  https://www.mql5.com/en/blogs/post/758844 What Does The Next-Generation Strength Indicator Offer? Everything you loved about the originals, now
Auto Optimized Parabolic RSI: Advanced 3D Momentum Engine Most retail indicators fail because they rely on static inputs that break the moment market volatility shifts. Auto Optimized Parabolic RSI solves the problem of "indicator decay" by continuously recalculating its own mathematical edge, bringing institutional-grade quantitative adaptation directly to your MT5 terminal. The Core Advantage: Custom In-Memory 3D Optimization   Standard auto-optimizers often freeze the MT5 platform because the
RFI levels PRO
Roman Podpora
5 (1)
The indicator accurately shows the reversal points and price return zones where the   Major players . You see where new trends are forming and make decisions with maximum precision, maintaining control over every trade. VERSION MT5     -     Reveals its maximum potential when combined with the   TREND LINES PRO   indicator What the indicator shows: Reversal structures and reversal levels with activation at the beginning of a new trend. Display of   TAKE PROFIT   and   STOP LOSS   levels with mi
Trend Catcher ind
Ramil Minniakhmetov
TREND CATCHER INDICATOR Trend Catcher Indicator analyzes market price movements, using a combination of the author’s proprietary and customized adaptive trend-analysis indicators.  It identifies the true market direction by filtering out short-term noise and focusing on underlying momentum strength, volatility expansion, and price structure behavior.  It also uses a combination of smoothing and trend-filtering customized indicators such as moving averages, RSI, and volatility filters.   Real ope
Apollo SR Master is a Support/Resistance indicator with special features which make trading with Support/Resistance zones easier and more reliable. The indicator calculates Support/Resistance zones in real-time without any time lag by detecting local price tops and bottoms. Then to confirm the newly formed SR area, the indicator shows special signal which signalizes that the SR zone can be taken into consideration and used as an actual SELL or BUY signal. In this case the strength of the SR zone
Grabber System
Ihor Otkydach
5 (2)
Let me introduce you to an excellent technical indicator – Grabber, which works as a ready-to-use "All-Inclusive" trading strategy. Within a single code, it integrates powerful tools for technical market analysis, trading signals (arrows), alert functions, and push notifications. Every buyer of this indicator also receives the following for free: Grabber Utility for automatic management of open orders Step-by-step video guide: how to install, configure, and trade with the indicator Custom set fi
Advanced Supply Demand
Bernhard Schweigert
4.91 (300)
Trading Special – 40% OFF Best Solution for any Newbie or Expert Trader! This indicator is a unique, high quality and affordable trading tool because we have incorporated a number of proprietary features and a new formula. With this update, you will be able to show double timeframe zones. You will not only be able to show a higher TF but to show both, the chart TF, PLUS the higher TF: SHOWING NESTED ZONES. All Supply Demand traders will love it. :) Important Information Revealed Maximize the pot
GoldRush Trend Arrow Signal V1.6 The GoldRush Trend Arrow Signal indicator V1.6 continues to provide precise, real-time trend analysis tailored for high-speed, short-term scalpers in XAU/USD , but it now has additional features and improved efficiency and reliability. Built specifically for the 1-minute time frame, this tool displays directional arrows for clear entry points, allowing scalpers to navigate volatile market conditions with confidence. The indicator consists of PRIMARY and SECONDARY
Introduction to Fractal Pattern Scanner Fractal Indicator refers to the technical indicator that makes use of the fractal geometry found in the financial market. Fractal Pattern Scanner is the advanced Fractal Indicator that brings the latest trading technology after the extensive research and development work in the fractal geometry in the financial market. The most important feature in Fractal Pattern Scanner is the ability to measure the turning point probability as well as the trend probabi
Currency Strength Wizard is a very powerful indicator that provides you with all-in-one solution for successful trading. The indicator calculates the power of this or that forex pair using the data of all currencies on multiple time frames. This data is represented in a form of easy to use currency index and currency power lines which you can use to see the power of this or that currency. All you need is attach the indicator to the chart you want to trade and the indicator will show you real str
Trading Special –40% OFF Best Solution for any Newbie or Expert Trader! This Indicator is a unique, high quality and affordable trading tool because we have incorporated a number of proprietary features and a new formula. With only ONE chart you can read Currency Strength for 28 Forex pairs! Imagine how your trading will improve because you are able to pinpoint the exact trigger point of a new trend or scalping opportunity? User manual: click here That's the first one, the original! Don't buy a
Cycle Sniper
Elmira Memish
4.39 (36)
Please contact us after your purchase and we will send you the complimentary indicators to complete the system Cycle Sniper is not a holy grail but when you use it in a system which is explained in the videos, you will feel the difference. If you are not willing to focus on the charts designed with Cycle Sniper and other free tools we provide, we recommend not buying this indicator. We recommend watching the videos about the indiactor and system before purchasing. Videos, settings  and descri
Market Structure Patterns MT4
Samuel Manoel De Souza
5 (18)
Market Structure Patterns   is an indicator based on   smart money concepts   that displays   SMC/ICT   elements that can take your trading decisions to the next level. Take advantage of the   alerts ,   push notifications   and   email messages   to keep informed from when an element is formed on the chart, the price crosses a level and/or enters in a box/zone. Developers can access the values of the elements of the indicator using the   global variables  what allows the automation of trading d
Contact me after purchase to get Bonus EA based on this indicator. The Self Optimizing Double MA Strategy is a professional-grade trading tool designed to eliminate parameter guesswork. Powered by a built-in auto-optimization engine, it continuously adapts to shifting market conditions by simulating thousands of parameter combinations in the background to maintain a statistical edge. Instead of relying on static, outdated settings, the indicator dynamically updates its own logic to find the mos
Day Trader Master is a complete trading system for traders who prefer intraday trading. The system consists of two indicators. The main indicator is the one which is represented by arrows of two colors for BUY and SELL signals. This is the indicator which you actually pay for. I provide the second indicator to my clients absolutely for free. This second indicator is actually a good trend filter indicator which works with any time frame. THE INDICATORS DO NOT REPAINT AND DO NOT LAG! The system is
Candle Power Pro
Thushara Dissanayake
4.5 (8)
The   Candle Power Pro   is a sophisticated trading tool designed to decode   real volume pressure, tick data imbalances, and institutional order flow dynamics   by measuring the   battle between bull ticks and bear ticks   in real time. This indicator transforms raw   volume data into actionable insights , helping traders identify   Smart Money movements, liquidity hunts, and hidden market psychology   behind each price candle. By analyzing   buyer/seller volume percentages, divergence pattern
If you trade Forex, having detailed information about the currency strength and currency pairs correlation can take your trading to new heights. The correlation will help to cut your risk in half, and strength analysis will help to maximize the profits. This indicator provides a hybrid approach for selecting the most appropriate currency pairs using the strength analysis and currency pairs correlation. How to use the Currency Strength Analysis Suppose your trading strategy provides a buying opp
CRT Candle Range Theory HTF MT4.   Ultimate CRT Indicator: Advanced ICT Concepts and Malaysian SnR Trading System Discounted   Price   $50  !!     Secure your lifetime access   now   before it switches to   subscription-only ! Master the Market Maker's Footprints with the Most Advanced Candle Range Theory Indicator Unlock the true power of   Smart Money Concepts (SMC)   and trade precisely like the institutions with the   Ultimate CRT Indicator . Built exclusively for serious traders, this indic
Route Lines Prices is an indicator designed for finding price directions. Its simple interface contains multiple algorithms for price behavior and future direction calculations. These algorithms include volatility calculations and price smoothing based on the timeframes used. The indicator has a single parameter for changing the " Calculating Price Values " value. The default value of 1 provides a balanced automatic calculation, which can be used without manually configuring the indicator. By m
Master head and shoulders patterns for better trading decisions A head and shoulders pattern is a chart formation that resembles a baseline with three peaks, the outside two are close in height and the middle is highest. It predicts a bullish-to-bearish trend reversal and is believed to be one of the most reliable trend reversal patterns. It is one of several top patterns that signal, with varying degrees of accuracy, that a trend is nearing its end. [ Installation Guide | Update Guide | Trouble
CRYSTAL HEIKIN ASHI SIGNALS MT4 Professional Trend Detection Indicator with Smart Entry Signals See the Trend. Catch the Move. Trade with Confidence. The professional Heikin Ashi indicator built for traders who want clarity, precision, and EA-ready signal automation. WHAT IS CRYSTAL HEIKIN ASHI SIGNALS? Crystal Heikin Ashi Signals is a professional-grade MetaTrader 4 indicator that combines pure Heikin Ashi candle visualization with an advanced momentum-shift detection system. Designed for both
More from author
Supports And Resistances Lines
Francisco Gomes Da Silva
4.65 (46)
Support and Resistance zones Indicator MT5 this indicator knows how to identify tops and bottoms automaticly. This support and resistance indicator creates support lines and resistance lines based on tops and bottoms. how to make support and resistance lines. this is an indicator to make automatic support and resistance lines. how to find support level with indicator. this indicator finds tops and bottoms automaticly. The Indicator automatically creates support lines every time “Fractals” create
FREE
VWAP With Alerts
Francisco Gomes Da Silva
5 (6)
This VWAP is a simple VWAP, but we have added alerts to let you know when the price touches the simple VWAP or when the price crosses the VWAP. This indicator is a traditional VWAP indicator for MetaTrader 5 (MT5). The default parameters are those of the normal VWAP, but you have the ability to use new calculations and the best part: When the price touches or crosses the VWAP, you will be notified through alerts, mobile notifications, email, or sound events. Free anchored VWAP indicator for MT5
FREE
Sweet VWAP Anchored MT5
Francisco Gomes Da Silva
5 (6)
Save time and make more accurate decisions with Anchored VWAPs If you want to test the power of this tool, you can download the free Anchored VWAPs indicator for MT5 . In addition to this indicator working independently, it is also an extension for the free Sweet VWAP version. This is because when you click in the free version, the VWAP you see at the mouse pointer will be anchored. And for better understanding, what will be anchored there is this indicator, with all its functionalities. This in
Bar Number
Francisco Gomes Da Silva
5 (7)
Candle counter This indicator counts and identifies candles based on a longer time frame Bigger Timeframe You can choose the daily timeframe as " Bigger Timeframe ", and run it within any smaller chart. that it will count the bars based on the daily chart . If you pass as a parameter the timeframe " H1 " then the indicator will know how to count the bars inside the H1 chart you just need to run it on smaller charts. The main parameter is the " Bigger Timeframe " which is a larger timeframe than
FREE
VWAP With Alerts MT4
Francisco Gomes Da Silva
5 (8)
This VWAP is a simple VWAP, but we've incorporated notifications that inform you when the price hits or crosses the VWAP line. This indicator is a traditional VWAP indicator for MetaTrader 4 (MT4). The default parameters are those of the normal VWAP, but you have the ability to modify the VWAP calculation, and the best part: When the price touches or crosses the VWAP, you will be notified through alerts, mobile notifications, email, or sound events. Anchored VWAP indicator for MT4 . Parameters:
FREE
Dino Trader Scanner
Francisco Gomes Da Silva
Scanner for the Agulhadas Strategy This scanner was developed to automate the identification of signals from one of the most popular strategies among Brazilian traders — informally known as “Agulhadas.” The technique uses five main indicators with clear visual rules to identify potential entry and exit points on the chart. With the scanner, you save time and avoid the manual work of finding these opportunities. Download this Scanner Indicator for free here How the Scanner Works The scanner analy
RSI abcd
Francisco Gomes Da Silva
4.33 (3)
RSI ABCD Pattern Finder: Technical Strategy 1. How the Indicator Works Combines the classic RSI with automatic detection of ABCD harmonic patterns . Key Components Standard RSI (adjustable period) Peak and Trough Markers (arrows) ABCD Patterns (green/red lines) Overbought (70) and Oversold (30) Filters 2. MT5 Setup period = 14 ; // RSI period size = 4 ; // Maximum pattern size OverBought = 70 ; // Overbought level OverSold = 30 ; // Oversold level Filter = USE_FILTER_ YES ; // Confirmation filte
FREE
Rule Plotter Expert
Francisco Gomes Da Silva
5 (3)
This Expert Advisor has been designed to test and execute your strategies created within the Rule Plotter indicator. How to use: Download the indicator Rule Plotter - a tool for creating trading systems without the need for programming . Next, develop your strategies within the Rule Plotter indicator. Finally, execute your created strategies using this Expert Advisor. Parameters: Strategy: Your trading system created within the Rule Plotter indicator, allowing you to test and execute your custom
Dino Trader
Francisco Gomes Da Silva
5 (1)
Discover the "Agulhadas" Strategy Inspired by popular concepts in the Brazilian market, this strategy combines five technical indicators to identify potential entry and exit points based on trends, market strength, and momentum. Among the indicators used is the famous Didi Index, developed by Odair Aguiar, widely known for representing moving average crossovers. Download the Stock Scanner Here Indicators Used Didi Index ADX Bollinger Bands Trix Stochastic How This Strategy Works The indicator di
FREE
OHLC Shifted
Francisco Gomes Da Silva
4.8 (5)
Previous Day's Close and Bar Shift Indicator for MetaTrader! The Previous Day's Close and Bar Shift Indicator is a tool designed to enhance technical analysis and decision-making in trading. With this indicator, you will have access to detailed information about the opening, high, low, and closing levels of any bar, allowing for precise and comprehensive analysis of market movements. Imagine having the ability to nest one timeframe within another, enabling detailed analysis of each bar across di
FREE
Rule Plotter
Francisco Gomes Da Silva
5 (14)
Build Your Strategy Yourself This tool allows you to develop your strategies using all the indicators available natively in MetaTrader and any indicators downloaded from the internet that use buffers to display data on the screen. This tool is another reason for you to consider MetaTrader to automate your trading strategies. With it, you can create your own strategy signals in a simple and intuitive way, using any MetaTrader indicator. How Do I Know If My Internet-Downloaded Indicator Uses Buffe
FREE
OHLC Shifted MT4
Francisco Gomes Da Silva
5 (3)
Previous Day's Close and Bar Shift Indicator for MetaTrader! The Previous Day's Close and Bar Shift Indicator is a tool designed to enhance technical analysis and decision-making in trading. With this indicator, you will have access to detailed information about the opening, high, low, and closing levels of any bar, allowing for precise and comprehensive analysis of market movements. Imagine having the ability to nest one timeframe within another, enabling detailed analysis of each bar across di
FREE
Fibonacci on ZigZag
Francisco Gomes Da Silva
4.93 (14)
Mouse You can draw fibonaccis moving the mouse over the zigzag indicator Pin them You can click on fibonacci with this option and it will no longer be deleted unless you click on it again :) Precision The tuned fibonacci gets the precise point in lower timeframes Enjoy it You can ask me for add more features, so please comment and leave your ranting for me to be happy, thank you :)
FREE
Bar Counter MT4
Francisco Gomes Da Silva
5 (5)
candlestick counter indicator this indicator counts candles that are on the chart of any timeframe a free bar counter for you to download on mt4 the candlestick counter counts how many candles there are inside a larger chart with this candle counter you can do the automatic candlestick count free candlestick count indicator for you to download and count bars automatically bar counter to count the bars count candle counter indicator mt4 count candle bar counter for MT5 If you are interested in th
FREE
Sweet VWAP Aux
Francisco Gomes Da Silva
4.5 (6)
Save time and make more informed decisions with Sweet VWAP Aux If you haven't already downloaded our free VWAP indicator for Metatrader 4 , do it now and experience its incredible capabilities for visualizing anchored vwap. Then come back here and get to know Sweet VWAP Aux - the perfect extension for your Sweet VWAP indicator. With just one click, Sweet VWAP allows you to anchor the VWAP indicator at the point of your choice, saving time and eliminating the need to set it up manually. In additi
My Candle Patterns
Francisco Gomes Da Silva
5 (1)
This indicator is a demo version of the complete My candle, which can be downloaded here: Candle Patterns Creator With the full version, you can create your own candle rules and modify a traditional candle pattern to be more accurate according to your strategy. The indicator includes several example candle rules, but here I will demonstrate only a few: Pattern Rule Candle Green C > O Candle Red C < O Doji C = O Hammer (C > O and (C-O) *2 < O-L and (C-O) *0.5 > H-C) or (C < O and (O-C) *2 < C-L a
FREE
Paula Bollinger Bands Strategy
Francisco Gomes Da Silva
3.67 (3)
Bollinger bands out/in strategy A strategy created by Joe Ross, and very useful for finding trades when the market is overloaded. Indicator You don't need to find where there are entries on the chart, this indicator shows them for you. The entrance The trade is confirmed when the price closes outside the bollinger bands on a candle and the candle after the price closes inside the bands. comment I want to improve this indicator, so you can help me sending me your reviews and comments, thanks :).
FREE
Rule Plotter Scanner
Francisco Gomes Da Silva
5 (1)
Have you ever thought about having a scanner that scans all strategies and shows the buy and sell points for all timeframes of that asset, all at the same time? That's exactly what this scanner does. This scanner is designed to display the buy and sell signals you created in the Rule Plotter: strategy creator without programming and run them within this scanner on various assets and different timeframes. The default strategy for Rule Plotter is only bullish and bearish candles. This means that i
FREE
First Bar
Francisco Gomes Da Silva
Trade System You choose a bar on the day to trade, when this bar closes the robot will send two orders a at the high other at the low of the candle, which gets again the other will be canceled Stop the stop will be one tick under the low on case of the buy, or one tick above the high on case of the sell Take The take can be setted how much you wants of the stop range, it can be costumized in the strategy otimization Otimization This robot have the input to get risck return, so you can run int in
FREE
Hide Scale
Francisco Gomes Da Silva
5 (1)
Hide Scale - Tool for Traders Who Want More Screen Space Instructions Press "T" to hide the time scale and "P" to hide the price scale. You can customize these keys by clicking the corresponding button and typing a new key on your keyboard. To hide both scales at the same time, you can assign the same key to both options. To show the scales again, simply press the corresponding key again. Why We Created This Tool We created this Hide Scale tool to help traders who use our Sweet VWAP indicator to
FREE
Rule Plotter MT4
Francisco Gomes Da Silva
4.25 (4)
How to Create an Automated Trading Robot Have you ever wondered how powerful it would be to automate your trading strategies with just a few clicks of the mouse? Imagine having the freedom to create and test different trading strategies without the need to dive into complicated code. With Rule Plotter, this vision becomes a reality. Here we will explore how you can create your own custom trading robot using Rule Plotter, a trade-system creation tool that simplifies the entire process. What is Ru
FREE
Pattern Wizard
Francisco Gomes Da Silva
5 (2)
Patterns Wizard is a tool for creating candlestick patterns. With it, you can create various patterns and add as many instances of this indicator as you want on your chart, each with a different pattern. To better understand how creation formulas work, you can refer to the examples of the My Candle indicator, which has over 70 examples of candlestick patterns The main difference with this indicator is that it has 30 rule parameters , meaning you can set a different rule for each of the last 30 c
FREE
Hide Scale MT4
Francisco Gomes Da Silva
5 (4)
Hide Scale - The ideal tool for traders who want to maximize chart space How to use Hide Scale Press "T" to hide the time scale and "P" to hide the price scale. You can customize the keyboard shortcuts by clicking on the corresponding buttons and choosing a new key for each function. If you want to hide both scales at the same time, you can assign the same key to both options. To display the scales again, simply press the corresponding key again. The reason behind creating this tool We developed
FREE
Pattern Wizard MT4
Francisco Gomes Da Silva
Patterns Wizard is a tool for creating candlestick patterns. With it, you can create various patterns and add as many instances of this indicator as you want on your chart, each with a different pattern. To better understand how creation formulas work, you can refer to the examples of the My Candle indicator, which has over 70 examples of candlestick patterns The main difference with this indicator is that it has 30 rule parameters , meaning you can set a different rule for each of the last 30 c
FREE
Discover the Power of Risk Management with Price Action to Position Your Stop Loss! Have you ever experienced the situation where you know exactly when to enter a trade, but you're unsure about the right time to exit? Don't worry, you're not alone! Many traders face this challenge on a daily basis. The good news is that our price action-based risk management tool is here to solve this problem. While you focus on identifying the optimal entry points, our tool takes control and handles the trade e
TrendPlator
Francisco Gomes Da Silva
TrendPlator: Empower Your Trading Strategies with an Advanced Trend Projection Indicator Explore the potential of our innovative indicator! With the ability to analyze and project trend lines from larger timeframes directly onto your current timeframe, it provides strategic support that catches the attention of traders across the board. These points become strategic levels of support or resistance for your trades, strengthening your trading strategy. Visualize the opportunity to add an indicator
Auto Anchored VWAPs MT4
Francisco Gomes Da Silva
Unveil Trading Insights with Auto Anchored VWAPs: Auto Anchored VWAPs serve as your guiding companion in the world of trading. These indicators pinpoint crucial market turning points and illustrate them on your chart using VWAP lines. This is a game-changer for traders who employ anchored VWAP strategies. How Does It Work? Identifying High Points: If the highest price of the current candle is lower than the highest price of the previous one, And the previous high is higher than the one before it
Rule Plotter Expert MT4
Francisco Gomes Da Silva
5 (1)
Trading Your Strategies Created with Rule Plotter Indicator with Rule Plotter Expert: Now that you have created your custom strategies using the Rule Plotter Indicator and visualized the arrows indicating entry and exit points on the chart, it's time to bring these strategies to life in the financial markets. With the Rule Plotter Expert, you can trade autonomously and accurately based on these arrows, making the most of the potential of your strategies Turning Arrows into Actions: The arrows ge
Paula Bollinger Bands
Francisco Gomes Da Silva
Transform your investment strategy with the Expert Advisor for MetaTrader investor robot. Based on the powerful Bollinger Bands strategy, created by Joe Ross and dubbed Paula by renowned Brazilian trader Rodrigo Cohen, you will have access to advanced technology that will maximize your profits and minimize your risks. Don't waste any more time with old and inefficient strategies. With our investor robot, you will have access to a highly accurate algorithm that combines technical analysis of ma
My Candle
Francisco Gomes Da Silva
Define your own candlestick pattern and this indicator will show on the screen when this pattern appears You can test it for free in the Strategy Tester and see how many times your candlestick pattern appears on the asset of your choice You can also paint all candles of your pattern or just one This indicator is useful for candlestick analysis, for you to use in price action and with naked trade strategies. It is an indicator that shows the movement you choose How to Use the Indicators: AC AC[1
Filter:
votija.63
406
votija.63 2025.09.04 08:43 
 

Pense que podría ser otra cosa, lo mismo!!

Nitin Suvarna
1573
Nitin Suvarna 2025.08.22 16:34 
 

User didn't leave any comment to the rating

cherryann gibbons
96
cherryann gibbons 2025.03.25 02:57 
 

Wonderful thank you Francisco really do appreciate it.

Francisco Gomes Da Silva
149223
Reply from developer Francisco Gomes Da Silva 2025.03.25 14:09
Thank you very munch for your review Cherryann, here has a tutorial to call indicators by rule https://www.mql5.com/en/market/product/94436?source=Site+Search#!tab=updates
Heiner G.
710
Heiner G. 2024.08.03 11:24 
 

Very accurate indicator. I like to use S/D indicators that show me which zones exist in higher TF. The VWAP indicator also does a very good job! Update: I have been using this indicator in the chart for 3 days. It is by far the best S/D indicator I have ever had. I use the lines from TF: H4 and D and trade in smaller units. Absolutely perfect! Great work!

Francisco Gomes Da Silva
149223
Reply from developer Francisco Gomes Da Silva 2024.08.05 16:12
Thank you very munch for your review Heiner
sunnychow
9043
sunnychow 2024.05.31 09:32 
 

User didn't leave any comment to the rating

Francisco Gomes Da Silva
149223
Reply from developer Francisco Gomes Da Silva 2024.05.31 19:23
Thanks for your review
Mfathi
73
Mfathi 2024.05.25 13:28 
 

Did you make an EA base on this indicator

Francisco Gomes Da Silva
149223
Reply from developer Francisco Gomes Da Silva 2024.05.25 14:04
Yes, on the video of the description we are creating an EA base on this indicator, thank you very munch for your review :)
gallard_a
255
gallard_a 2024.05.18 09:05 
 

User didn't leave any comment to the rating

Francisco Gomes Da Silva
149223
Reply from developer Francisco Gomes Da Silva 2024.05.18 21:34
Thank you very munch for your review.
rovinades
430
rovinades 2024.05.17 12:31 
 

User didn't leave any comment to the rating

Francisco Gomes Da Silva
149223
Reply from developer Francisco Gomes Da Silva 2024.05.18 01:54
Thanks for your review :)
Solene Clement
370
Solene Clement 2024.05.17 11:34 
 

User didn't leave any comment to the rating

Troy
224
Troy 2024.05.09 09:40 
 

User didn't leave any comment to the rating

Francisco Gomes Da Silva
149223
Reply from developer Francisco Gomes Da Silva 2024.05.10 19:47
Thank you for your worthy and gratifying review.
Calix Fujimoto
467
Calix Fujimoto 2024.05.08 09:16 
 

User didn't leave any comment to the rating

Francisco Gomes Da Silva
149223
Reply from developer Francisco Gomes Da Silva 2024.05.08 21:52
Thank you very munch for your review Calix :)
Allan Bundalian
53
Allan Bundalian 2024.01.11 01:23 
 

User didn't leave any comment to the rating

Francisco Gomes Da Silva
149223
Reply from developer Francisco Gomes Da Silva 2024.01.11 09:56
thanks for your review Allan
RUS2668 Иванов
654
RUS2668 Иванов 2023.11.27 04:55 
 

Отлично!

Francisco Gomes Da Silva
149223
Reply from developer Francisco Gomes Da Silva 2023.11.29 16:49
большое спасибо, что нашли время оставить мне свой отзыв :)
52282077
104
52282077 2023.11.21 17:20 
 

good

Francisco Gomes Da Silva
149223
Reply from developer Francisco Gomes Da Silva 2023.11.21 17:28
Thank you so much for taking the time to review. I wish this tool proves beneficial in your analyses, whether price action, counting Elliott waves, or alerts for potential breakthroughs in historical tops or bottoms :)
Jeffrey Levels
112
Jeffrey Levels 2023.11.21 08:53 
 

User didn't leave any comment to the rating

Francisco Gomes Da Silva
149223
Reply from developer Francisco Gomes Da Silva 2023.11.21 17:12
Hi Jeffrey, thanks for your review, are you referring to the input display "line"?
sinaj
24
sinaj 2023.10.30 18:24 
 

отлично

Francisco Gomes Da Silva
149223
Reply from developer Francisco Gomes Da Silva 2023.10.30 18:26
привет sinaj! Большое спасибо за отзыв.
lin z
283
lin z 2023.10.25 03:32 
 

A good indicator; I use it confirming direction. Thank you for sharing.

Francisco Gomes Da Silva
149223
Reply from developer Francisco Gomes Da Silva 2023.10.29 20:31
Thank you for your review Lin z, tell us how do you check the confirming direction, maybe it can be automatized by this free tool: https://www.mql5.com/en/market/product/107361
Evgeny Belyaev
92112
Evgeny Belyaev 2023.10.15 21:50 
 

Good Indicator.

Francisco Gomes Da Silva
149223
Reply from developer Francisco Gomes Da Silva 2023.10.16 14:34
thank you very munch Evgeny Belyaev
kufre peters
132
kufre peters 2023.10.06 18:33 
 

very best indicator i have ever used. i really appreciate this good work and i say a big thankyou to you

Francisco Gomes Da Silva
149223
Reply from developer Francisco Gomes Da Silva 2023.10.06 19:47
Thank you so much for your glowing review! I'm thrilled to hear that our indicator has had a positive impact on your trading experience. I'm currently actively working on improving this indicator and plan to release an update soon. Additionally, I'm also developing other special tools that I believe the community will find valuable. I encourage you to follow me to stay updated on the latest news and developments. And thank you again your review and support mean a lot to me, I truly appreciate you taking the time to provide such a special and gratifying review!
Franck Martin
186028
Franck Martin 2023.05.31 08:56 
 

Always such a good job Francisco, thank you. It helps me to confirm the signal strategy.

Francisco Gomes Da Silva
149223
Reply from developer Francisco Gomes Da Silva 2023.06.01 16:33
Thank you once again, Franck, for your invaluable feedback. It's fantastic to hear that this can be beneficial to your trading signals. It would be really exciting if other traders could become aware of and test your signals.
Reply to review