ATR data MTF
- Indicators
-
Makarii Gubaydullin
 Multifunctional Trade Assistant:
MT5: https://www.mql5.com/en/market/product/71145 - Version: 1.0
- Activations: 20
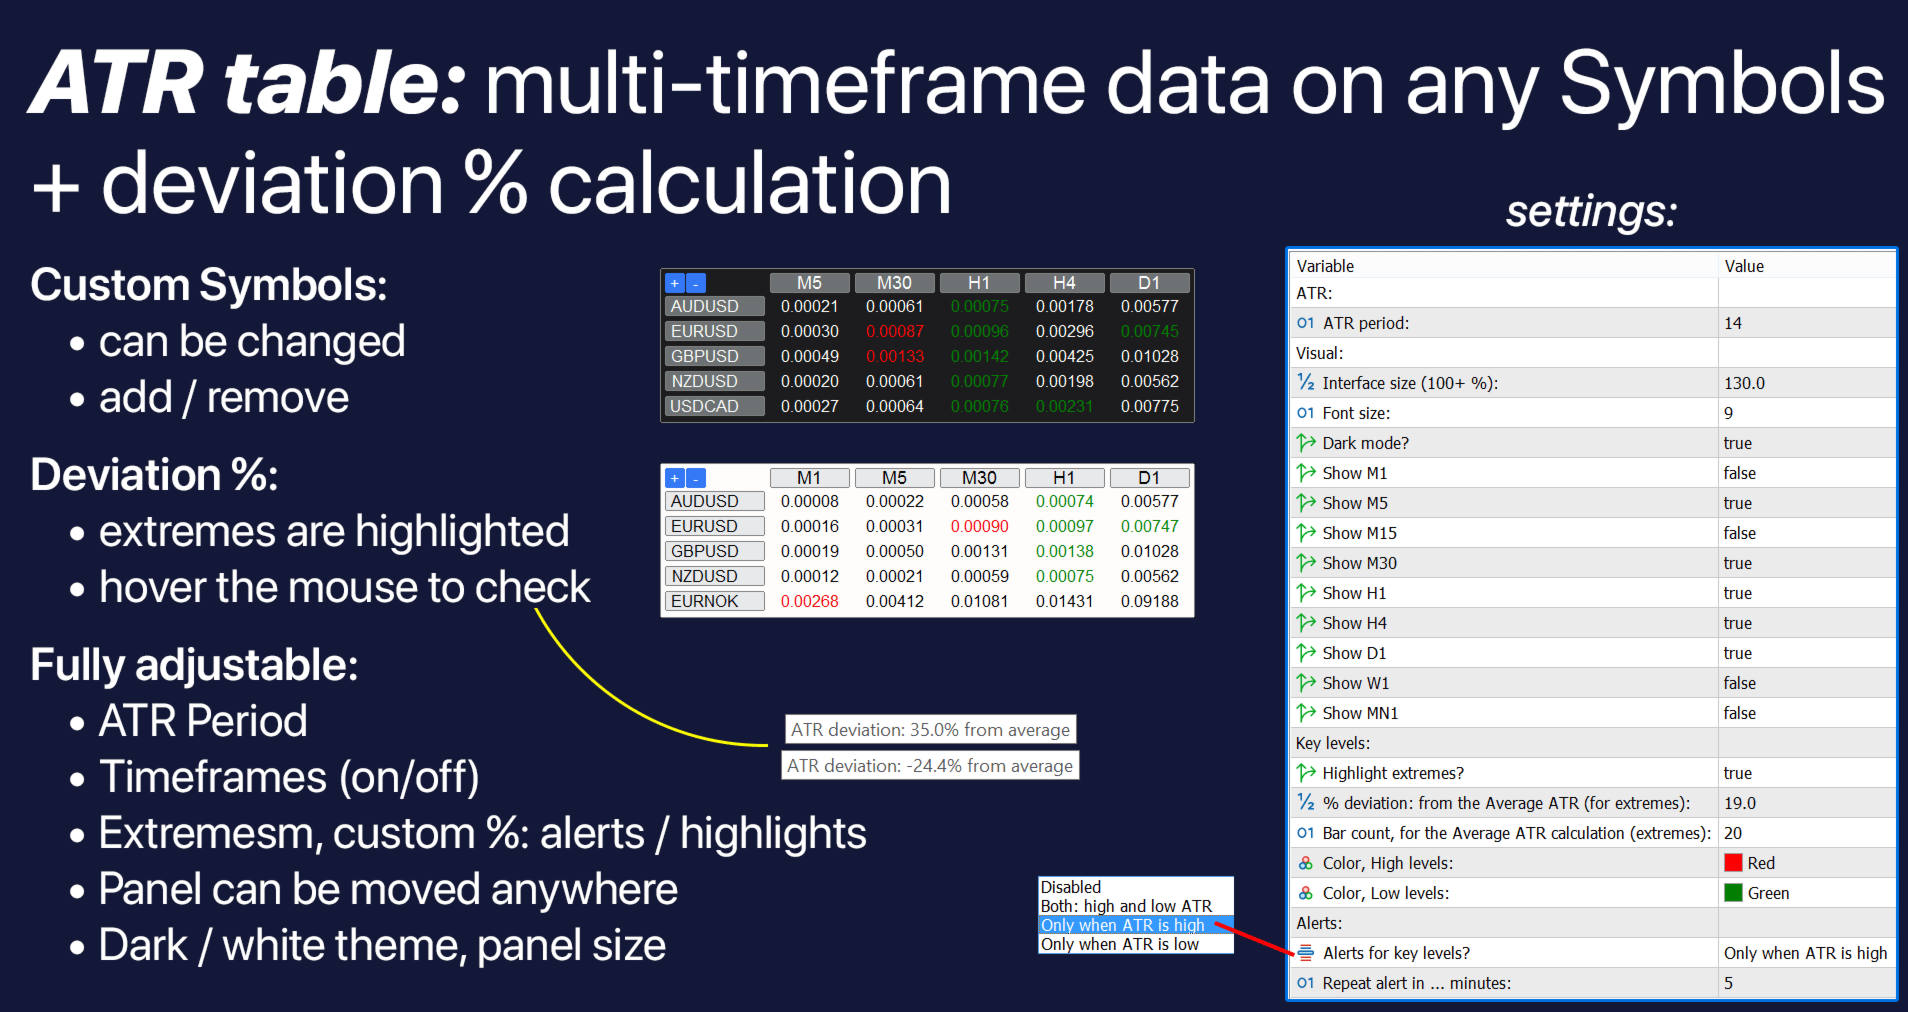
Multi-timeframe ATR values on the selected Symbols: compare the current market trends
Each Symbol can be customized: removed / replaced. You can add up to 40 Symbols.
The percentage of the current ATR deviation (compared to the average value): it can be checked at mouse hover.
Panel can be moved to any place of the chart (drag anywhere).
In the settings you can configure:
- ATR indicator settings: Period.
- Each timeframe may be enabled / disabled.
- Highlight option: if enabled - extreme levels will be highlighted in the custom colors.
- Extremes % value: e.g. if input is 25%:
- values 125%+ from the Average ATR will be considered as High;
- values 75%- from the Average ATR will be considered as Low;
- The number of bars that will be analyzed to calculate the average ATR value.
- Alerts: may be enabled for Extreme levels: high ATR / low ATR / both.
-
Visual styles: size, dark / white theme, highlight colors.
The Average True Range (ATR) is a technical analysis indicator that measures market volatility by analyzing the price range over a specified period.
-
True Range (TR) Calculation: the True Range is the greatest of the following:
-
Current High – Low
-
Absolute value of Current High – Previous Close
-
Absolute value of Current Low – Previous Close
-
TR=max(High−Low,∣High−Previous Close∣,∣Low−Previous Close∣)
-
-
ATR Calculation: the ATR is a smoothed moving average (usually 14 periods) of the True Range values.
-
The default smoothing method in MetaTrader is the Wilder's moving average (similar to an exponential moving average).
-
Formula for a 14-period: ATR = (Previous ATR × 13 + Current TR) / 14
-
-
Interpretation:
-
A higher ATR indicates higher volatility.
-
A lower ATR suggests lower volatility.
-
Traders use ATR to set stop-loss levels, position sizing, or to confirm trend strength.
-
-
Stop-Loss Adjustment: Traders place stops at 2×ATR or 3×ATR away from entry to avoid premature exits.
-
Breakout Confirmation: A rising ATR suggests strong momentum in breakouts.
-
Trend Strength: High ATR confirms strong trends; low ATR indicates consolidation.
The ATR does not indicate price direction—only volatility. It’s best used alongside trend-following indicators like Moving Averages or the ADX.