Volatility Scanner
- Indicators
- Version: 1.0
- Activations: 10

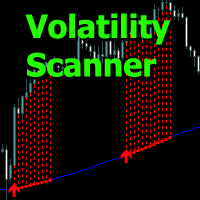
Volatility Scanner - the indicator analyzes the market condition and shows the zones of increasing volatility with histogram lines.
The indicator allows you to determine the moments for entering and holding positions, working in the trend direction or when to wait out the time without trading.
Input parameters allow you to independently configure the indicator for the desired trading instrument or time frame.
Any time frames for use from minute to daily.
There are several types of alerts.
All indicator signals are not redrawn and do not lag, appear at the close of the candle.
Will complement any trading system, from scalping to day trading.
How the indicator works
The indicator allows you to determine the moments for entering and holding positions, working in the trend direction or when to wait out the time without trading.
Input parameters allow you to independently configure the indicator for the desired trading instrument or time frame.
Any time frames for use from minute to daily.
There are several types of alerts.
All indicator signals are not redrawn and do not lag, appear at the close of the candle.
Will complement any trading system, from scalping to day trading.
How the indicator works
- The indicator contains a MA line relative to which it makes further calculations. The "Moving Average Period" parameter can be adjusted by changing the period of the trend direction.
- The vertical blue lines show an increase in volatility in a bear market.
- The vertical red lines show an increase in volatility in a bull market.
- The "Candles Calculation" parameter changes the number of candles used to calculate volatility.