Published products
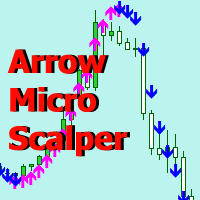
Arrow Micro Scalper - an indicator designed for scalping and short-term trading, integrated into any chart and financial instrument (currency, crypto, stocks, metals).
In its work, it uses wave analysis and a trend direction filter. It is recommended to use on time frames from M1 to H4.
How to work with the indicator.
The indicator contains 2 external parameters for changing the settings, the rest are already configured by default. Large arrows indicate a change in trend direction, blue - the
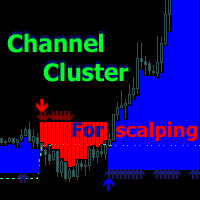
Cluster indicator working in the price channel. For operation, the indicator builds a channel line - (dashed line).
Inside the channel, cluster sections are determined that determine the direction of the price movement - (histograms in two directions),
start with large arrows. Small arrows are plotted above / below each histogram - indicator increase volatility.
The indicator does not redraw the values.
Works on any tools and timeframes. Entrances are made when large arrows appear, inside small
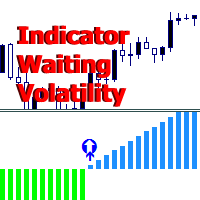
Indicator Waiting Volatility - an indicator for determining volatility zones and flat conditions.
Over time, the price on the chart is in different trends, goes down, goes up, or stays the same. The indicator helps the trader determine which trend the price is in.
In its work, it uses several tools for technical analysis; first, the direction of the trend is determined, then, in this direction, the indicator monitors changes in volatility.
If the price fluctuates within the noise, it is in track
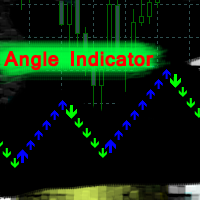
Angle Iindicator - is an indicator for identifying direction changes and trend confirmation.
It analyzes price behavior and identifies reversal points, identifying peaks and troughs on the chart.
It supports trend directions.
Suitable for use on any financial instruments and timeframes.
The internal parameters are already configured; all you need to do is place the indicator on the chart and set the "Multiplier" parameter for the desired result.
The indicator generates arrows on the current ca
Level Breakout Indicator is a technical analysis product that works from upper and lower boundaries, which can determine the direction of the trend. Works on candle 0 without redrawing or delays.
In its work, it uses a system of different indicators, the parameters of which have already been configured and combined into a single parameter - “ Scale ”, which performs gradation of periods.
The indicator is easy to use, does not require any calculations, using a single parameter you need to select
Volatility Trend System - a trading system that gives signals for entries. The volatility system gives linear and point signals in the direction of the trend, as well as signals to exit it, without redrawing and delays.
The trend indicator monitors the direction of the medium-term trend, shows the direction and its change. The signal indicator is based on changes in volatility and shows market entries.
The indicator is equipped with several types of alerts. Can be applied to various trading ins
Wave Reversal Indicator - determines the direction of trend waves and price reversals.
The indicator shows wave movements and trend directions. It gives recommendations where to follow the trader, helps to follow the trading strategy.
It is an addition to an intraday or medium-term strategy.
Almost all parameters are selected for each time frame and are changed automatically, the only parameter for manual adjustment is the wavelength.
Works on various trading instruments and timeframes, recomme
FREE
Linear Trend Predictor - A trend indicator that combines entry points and direction support lines. It works on the principle of breaking through the High/Low price channel.
The indicator algorithm filters market noise, takes into account volatility and market dynamics.
Indicator capabilities
Using smoothing methods, it shows the market trend and entry points for opening BUY or SELL orders. Suitable for determining short-term and long-term market movements by analyzing charts on any timeframes.

Bollinger Trend Signals - is a trend indicator based on Bollinger Bands. All signals are generated without repainting or lag. It identifies the directional trend channel, potential entry points, and possible exit points for trades.
How the indicator works
The indicator functions by combining a trend channel with a system that identifies price peaks and troughs.
The blue line represents the main smoothed trend line; when it is above the price, the trend channel is bearish, and when it is below
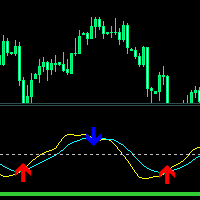
Crossing Line Indicator - An indicator designed for early detection of impulse movements in the direction of the trend.
Contains an oscillator built on the RVI indicator using smoothing and behavior modification. Two thin lines at the intersection of which a moment of price change occurs, the consequence of which may be an impulse or intensive movement.
The indicator for determining the trend direction is built on weighted MA indicators. A thick light green line, if it is below the central leve
FREE
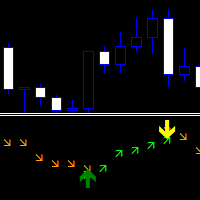
Direction Change Detector - A trend indicator that divides the balance between bullish and bearish movements. It has two lines of arrows with signals confirming their directions.
It can work as a standalone indicator for finding a trend or an additional tool for opening trades and following the directions of signals.
Adaptive to any Market and Time Frame. Does not repaint its readings on history. There are several types of alerts. Green arrows pointing up determine the bullish price direction. O
FREE
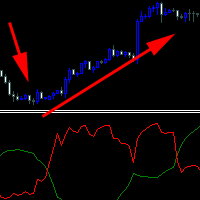
A trend indicator showing the strength of bulls and bears in a trading range.
Consists of two lines:
The green line is a balanced overbought/oversold condition. The red line is the direction of trading activity. Does not redraw calculations.
Can be used on all Symbols/Instruments/Time Frames.
Easy to use and set up.
How to use the indicator and what it determines.
The basic rule is to follow the direction of the red line:
if it crosses the green line from the bottom up, the market is dominat
FREE

Route Lines Prices is an indicator designed for finding price directions. Its simple interface contains multiple algorithms for price behavior and future direction calculations. These algorithms include volatility calculations and price smoothing based on the timeframes used.
The indicator has a single parameter for changing the " Calculating Price Values " value. The default value of 1 provides a balanced automatic calculation,
which can be used without manually configuring the indicator.
By m

Reversal Identifier MT5 - An indicator that can find reversal points on a chart.
It works without redrawing or delays, identifies fractal peaks and troughs, and marks reversals with arrows.
The indicator identifies early reversal points, after which a correction or change in trend direction occurs.
The best use case for this indicator is on two time frames, using the higher time frame to determine the trend and the lower time frame to receive entry signals.
The indicator can be used alone or in
The " Dynamic Scalper System " indicator is designed for the scalping method of trading within trend waves.
Tested on major currency pairs and gold, compatibility with other trading instruments is possible.
Provides signals for short-term opening of positions along the trend with additional price movement support.
The principle of the indicator.
Large arrows determine the trend direction.
An algorithm for generating signals for scalping in the form of small arrows operates within trend waves.
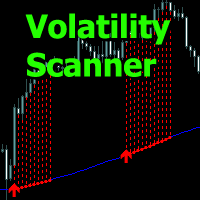
Volatility Scanner - the indicator analyzes the market condition and shows the zones of increasing volatility with histogram lines.
The indicator allows you to determine the moments for entering and holding positions, working in the trend direction or when to wait out the time without trading.
Input parameters allow you to independently configure the indicator for the desired trading instrument or time frame.
Any time frames for use from minute to daily.
There are several types of alerts.
All in
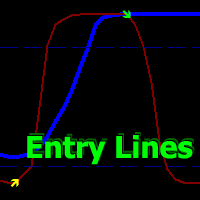
Volatility Trend System - a trading system that gives signals for entries. The volatility system gives linear and point signals in the direction of the trend, as well as signals to exit it, without redrawing and delays. The trend indicator monitors the direction of the medium-term trend, shows the direction and its change. The signal indicator is based on changes in volatility and shows market entries.
The indicator is equipped with several types of alerts. Can be applied to various trading ins
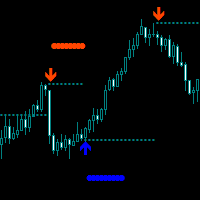
Max Min Reversal Arrows MT5 - an arrow reversal indicator for predicting price movement. The indicator is built on the support and resistance levels at the local lows and highs of the price. Product features
Arrows appear on the current candle. The indicator does not redraw.
Can be used on all time frames and trading instruments. Recommended timeframes to use M30, H1, H4.
The dotted lines are the support and resistance levels within the signal. Price movement from these levels means a reversa
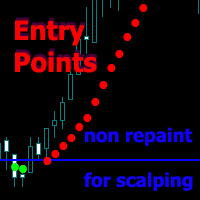
Scalping Entry Points - is a manual trading system that can adjust to price movements and give signals to open trades without redrawing. The indicator determines the direction of the trend by the central level of support and resistance. The dot indicator provides signals for entries and exits. Suitable for manual intraday trading, scalping and binary options. Works on all time frames and trading instruments.
The indicator gives several types of alerts.
How to use the product
The blue line det
Scalping and Binary Signal Detector - Scalping indicator that gives directional signals for opening positions along the trend.
The indicator is a complete trading system that can be used for Forex and binary options.
The system of algorithms allows you to recognize intense price movements in several consecutive bars.
The indicator provides several types of alerts for arrows.
Works on any trading instruments and time frames (M5 or Higher recommended).
How to use for trading
The appearance of a
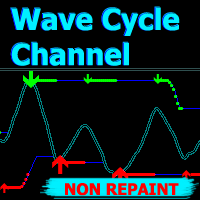
The " Wave Cycle Channel " indicator calculates price directions using a cyclic oscillator and a support and resistance channel.
Finds turning points in price movements and identifies possible reversal points, showing in which direction the market is moving.
Can be used to determine reversal points and to find entry signals.
How the indicator works
The oscillator wave line adjusts to price movements, is built based on market volatility and the specified " Oscillator Period " period from the inp

Scalping Lines System - is a scalping trading system specifically designed for trading the Gold, XAUUSD asset on M1-H1 timeframes.
It combines indicators for trend, volatility, and overbought/oversold market analysis, gathered into a single oscillator for identifying short-term signals.
The main internal parameters for the signal lines are pre-configured.
Some parameters remain for manual adjustment: "Trend Wave Duration," which regulates the duration of a series of signals in the trend directi
Indicator for manual trading and technical analysis for Forex.
It consists of a trend indicator with the opening level of the trading day and a arrow indicator for determining entry points.
The indicator does not recolor; it works when the candle closes.
Contains several types of alerts for signal arrows.
Can be configured to work on any chart, trading instrument or time frame.
The work strategy is based on searching for price movements along the trend.
To make " Buy " transactions: The tre
Scalper RS - is a trading and analytical indicator designed to identify the most probable reversal points on the price chart.
The indicator's algorithm that structures the price allows you to determine reversal price combinations on various trading instruments and time frames.
Using the variable " Structuring " parameter, you can select the optimal settings for the desired trading chart and time frame.
Initially, the indicator was created to receive signals on time frames M1 - M5 - M15, but by

Reversal Identifier MT5 - An indicator that can find reversal points on a chart.
It works without redrawing or delays, identifies fractal peaks and troughs, and marks reversals with arrows.
The indicator identifies early reversal points, after which a correction or change in trend direction occurs.
The best use case for this indicator is on two time frames, using the higher time frame to determine the trend and the lower time frame to receive entry signals.
The indicator can be used alone or in

Route Lines Prices MT5 - is an indicator designed for finding potential trading signals. Its simple interface contains multiple price behavior algorithms, as well as signal endpoint detection and calculations of completed trajectories. The algorithms include volatility and price smoothing calculations based on the timeframes used.
The indicator has a primary parameter for changing its values: " Calculating price values " The default value of 1 provides a balanced automatic calculation form,
wh

Cyclic Impulse MT5 — This technical indicator structures charts and identifies cyclical price movements. It allows you to find reversal cyclical price movements and entry signals.
How the indicator works
When a cyclical downward movement is detected, a blue downward bar is generated after the candle closes. It may flicker on the current candle, and the signal has not yet been confirmed. Blue arrows are duplicated on the price chart.
When an upward cyclical movement is detected, a red upward bar

Scalping Lines System MT5 - is a scalping trading system specifically designed for trading the Gold, XAUUSD asset on M1-H1 timeframes.
It combines indicators for trend, volatility, and overbought/oversold market analysis, gathered into a single oscillator for identifying short-term signals.
The main internal parameters for the signal lines are pre-configured.
Some parameters remain for manual adjustment: "Trend Wave Duration," which regulates the duration of a series of signals in the trend dir
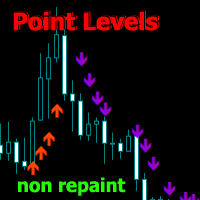
Point Directions MT5 - An indicator showing point levels of support and resistance when the price moves. The arrows show price bounces in the indicated directions.
The arrows are not redrawn, they are formed on the current candle. Works on all time frames and trading instruments. There are several types of alerts.
Has advanced settings to customize signals for any chart. Can be configured to trade with the trend and corrections.
For drawing arrows, there are 2 types of moving averages and an in
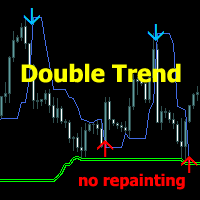
Trading System Double Trend MT5 - an independent trading system consisting of several indicators. Determines the direction of the general trend and gives signals in the direction of price movement.
Can be used for scalping, intraday or weekly trading.
Features
Works on any time frames and trading instruments (forex, cryptocurrencies, metals, stocks, indices.) Simple visual reading of information that does not load the chart The indicator does not repaint and does not complete signals Works onl
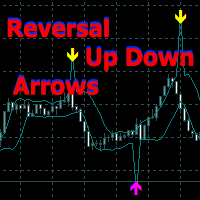
A complex of indicators of recognizing reversal moments. Detects the peaks and hollows according to the combinations of candles after they deduct from two MA. Applicable for trading systems when using early inputs. You can use a trend for scalping and intraday trade, and for detecting a trend in the early stages.
Possibilities
The parameters provide flexible settings for any time floms and trading tools. There are several types of warning for signals. Yellow arrow - Sell signal , pink arrow -
The " Dynamic Scalper System MT5 " indicator is designed for the scalping method of trading within trend waves.
Tested on major currency pairs and gold, compatibility with other trading instruments is possible.
Provides signals for short-term opening of positions along the trend with additional price movement support.
The principle of the indicator.
Large arrows determine the trend direction.
An algorithm for generating signals for scalping in the form of small arrows operates within trend wav
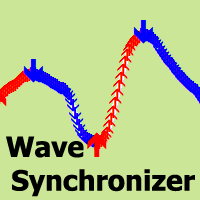
Wave Synchronizer is a visual indicator of wave analysis. Combines candlestick movement sequences and builds directional waves, producing synchronous movements together with the market.
The beginning of each wave begins with a signal arrow, there are also alerts.
The indicator will never redraw or move the arrows on the previous history. Signal arrows appear at the close of the candle. Adapts to work with any trading instruments and time frames. Easy to use and configure, contains only 2 input
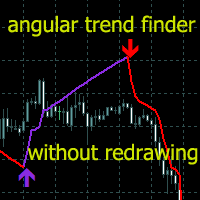
Trend indicators are one of the areas of technical analysis for use in trading on financial markets.
The Angular Trend Lines indicator comprehensively determines the trend direction and generates entry signals. In addition to smoothing the average direction of candles,
it also uses the slope of the trend lines. The principle of constructing Gann angles was taken as the basis for the slope angle.
The technical analysis indicator combines candlestick smoothing and chart geometry.
There are two ty
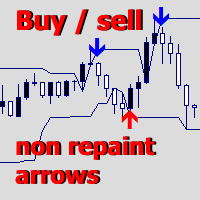
Upper and Lower Reversal - Early forecasting system for reversal points. Allows you to find price reversal points on the boundaries of the upper and lower price movement channels.
The indicator will never repaint or change the position of the signal arrows. Red arrows are a buy signal, Blue arrows are a sell signal.
Adapts to any time frames and trading instruments The indicator does not repaint, it works only when the candle closes. There are several types of alerts for signals The indicator i
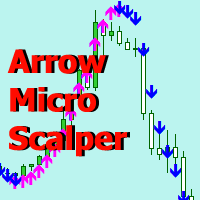
Arrow Micro Scalper - an indicator designed for scalping and short-term trading, integrated into any chart and financial instrument (currency, crypto, stocks, metals).
In its work, it uses wave analysis and a trend direction filter. It is recommended to use on time frames from M1 to H4.
How to work with the indicator.
The indicator contains 2 external parameters for changing the settings, the rest are already configured by default. Large arrows indicate a change in trend direction, blue - the
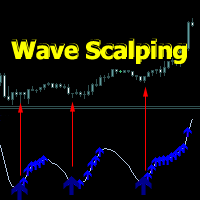
Wave Scalping indicator is a short-term trading strategy based on a wave system. It includes a wave line, entry points and position tracking.
Signal arrows appear when a candle closes.
It consists of a wave line along which signal arrows are built, and arrows - confirmation of directions after the signal arrows.
Signal arrows are built taking into account the direction of the trend direction. When confirming signal arrows, there are several types of alerts.
To configure the parameters, you can
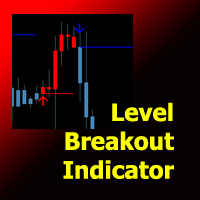
Level Breakout Indicator is a technical analysis product that works from upper and lower boundaries, which can determine the direction of the trend. Works on candle 0 without redrawing or delays.
In its work, it uses a system of different indicators, the parameters of which have already been configured and combined into a single parameter - “ Scale ”, which performs gradation of periods.
The indicator is easy to use, does not require any calculations, using a single parameter you need to select
Linear Trend Predictor - A trend indicator that combines entry points and direction support lines. It works on the principle of breaking through the High/Low price channel.
The indicator algorithm filters market noise, takes into account volatility and market dynamics.
Indicator capabilities
Using smoothing methods, it shows the market trend and entry points for opening BUY or SELL orders. Suitable for determining short-term and long-term market movements by analyzing charts on any timeframes.

The " ZigZag on Trend " indicator helps determine price movement direction, as well as a bar and pip calculator. It consists of a trend indicator, a trend line represented as a zigzag that tracks price direction, and a counter that calculates the number of bars passed in the trend direction and the number of pips on the vertical scale (calculations are based on the bar's opening). The indicator does not repaint. For convenience, it is presented as colored bars or lines. It can be used on all tim
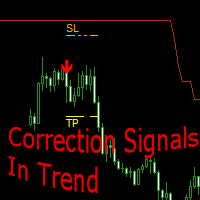
Correction Signals In Trend - a technical indicator that analyzes the market dynamics, helps the trader determine the trend direction and find points for opening orders.
The indicator follows the trend in the format of support and resistance lines and shows an upward or downward trend.
In the trend direction, after the end of the correction, a search for signals is performed. Arrows indicate potential moments for trading operations.
For each signal, the recommended SL and TP levels are displayed
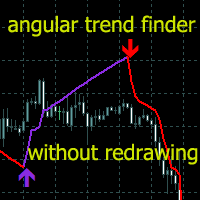
Trend indicators are one of the areas of technical analysis for use in trading on financial markets.
The Angular Trend Lines comprehensively determines the trend direction and generates entry signals. In addition to smoothing the average direction of candles,
it also uses the slope of the trend lines. The principle of constructing Gann angles was taken as the basis for the slope angle.
The technical analysis indicator combines candlestick smoothing and chart geometry.
There are two types of tre
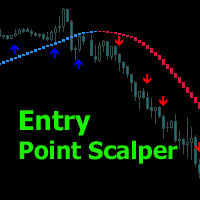
Arrow indicator with trend filter. Generates trend input without delays or delays - on the emerging candle. Suitable for use on any trading tools and timeframes. Easy to use, contains the direction of the trend in the form of a histogram lines and signal generator.
Input parameters
Period Trend Line - Period of the Histogram Line Signal Generator Period - If the period is longer, then the arrows are less Play sound Display pop-up message Send push notification Send email Sound file signal - Fi
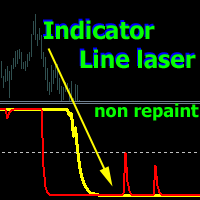
Linear indicator for trend trading together with scalping method. The yellow line is used to calculate the long-term price trend.
As the yellow line moves, a scalper signal line is applied - a thin red one.
A zero level is applied to confirm signals.
If the yellow line crossed the zero level upwards, the trend is up. If the yellow line crossed the zero level from top to bottom, the trend is down. The signal red line works in a similar way, only its sensitivity to price movements is higher. Re
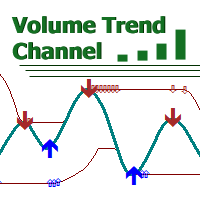
A technical indicator that calculates its readings based on trading volumes. It has an oscillatory line that follows the change in volumes.
Large arrows on the line indicate reversal values. A channel is built around the line with small arrows showing the strengthening of price movement in the direction of increasing volumes.
The indicator does not redraw values. Works on any instrument and timeframe. It can complement any trading strategy by finding a trend or make entries in the direction of a
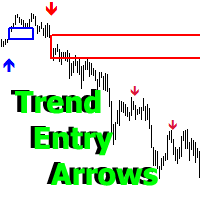
Developed methods for trading collected in one indicator. In the form of arrows, it defines entries in the direction of the trend.
It has 2 types of arrows - trend and signal guides, informing about the potential movement in the direction of the trend.
Works without redrawing, ready for use on all symbols/tools.
The most suitable time frames to use are M15, M30, H1, H4.
How to use
The indicator finds the direction of the trend in the form of a signal arrow, a graphic rectangle stretches along
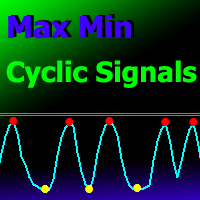
Cyclical indicator for trading and predicting the direction of the market. Shows the cyclical behavior of the price in the form of an oscillator.
Gives signals for opening deals when rebounding from the upper and lower boundaries of the oscillator. In the form of a histogram, it shows the smoothed strength of the trend.
Will complement any trading strategy, from scalping to intraday. The indicator does not redraw. Suitable for use on all symbols/instruments. Suitable time frames for short-term t
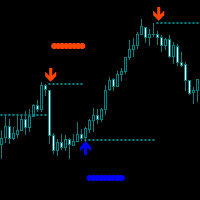
Max Min Reversal Arrows - an arrow reversal indicator for predicting price movement. The indicator is built on the support and resistance levels at the local lows and highs of the price. Product features
Arrows appear on the current candle. The indicator does not redraw.
Can be used on all time frames and trading instruments. Recommended timeframes to use M30, H1, H4.
The dotted lines are the support and resistance levels within the signal. Price movement from these levels means a reversal.
Pr
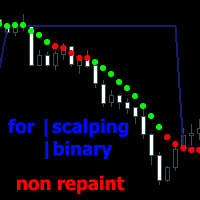
Scalping Entry Points - is a manual trading system that can adjust to price movements and give signals to open trades without redrawing. The indicator determines the direction of the trend by the central level of support and resistance. The dot indicator provides signals for entries and exits. Suitable for manual intraday trading, scalping and binary options. Works on all time frames and trading instruments.
The indicator gives several types of alerts.
How to use the product
The blue line det
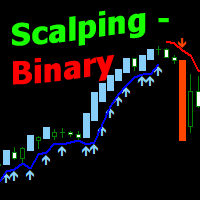
Candle Binary Scalper - is a technical analysis product for forex and binary options.
Includes several technical indicators combined into a trading system.
Suitable for manual trading within a trend, for scalping and binary options. Works on all time frames and trading instruments.
Recommended Timeframes for trading M15, M30, H1 and H4, M5 and M1 should be used in case of high volatility. There are several types of alerts.
How to use the product
The optimal settings have already been selected
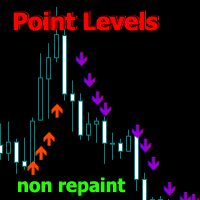
Point Directions - An indicator showing point levels of support and resistance when the price moves. The arrows show price bounces in the indicated directions.
The arrows are not redrawn, they are formed on the current candle. Works on all time frames and trading instruments. There are several types of alerts.
Has advanced settings to customize signals for any chart. Can be configured to trade with the trend and corrections.
For drawing arrows, there are 2 types of moving averages and an intens
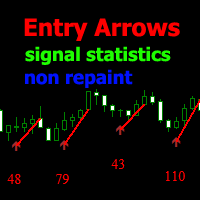
Binary Lines is a technical analysis indicator for currencies, commodities, cryptocurrencies, stocks, indices and any financial instruments. Can be used for binary options or Forex scalping. Shows entry and exit points at fixed intervals and provides traders the necessary information about the results of possible transactions. Entry points are formed at the very beginning of the candle, in the direction of the MA line, duration
trades in bars can be adjusted manually and adjusted to any financia
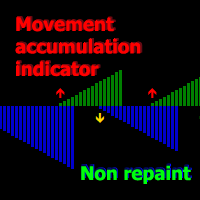
A technical indicator that calculates its readings on trading volumes. In the form of a histogram, it shows the accumulation of the strength of the movement of the trading instrument. It has independent calculation systems for bullish and bearish directions. Works on any trading instruments and time frames. Can complement any trading system.
The indicator does not redraw its values, the signals appear on the current candle.
It is easy to use and does not load the chart, does not require addition
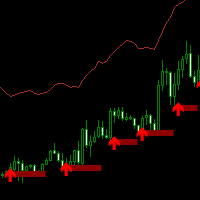
Line Breakouts - System for trend trading.
Contains a trend identifier that can be adapted to any chart and trading instrument using the period and smoothing function.
And a determinant of support and resistance levels. When the price is below the resistance line, open Sell trades, and when the price is above support lines - open Buy transactions. Stop loss should be placed a few points from the lines, Take Profit should be fixed after several candles (3-10-15), based on the time frame.
The indi
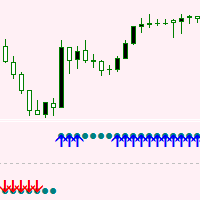
Point Trend Indicator - An indicator of the upper and lower level of the trend, which can determine the trend direction and indicate its strengthening. The trend direction is determined by round dots; if the points are above the zero line, the trend is bullish; if below, the trend is bearish. The increase in directional movement is indicated by arrows. It has the only parameter for manual adjustment - Duration of the trend direction.
Possibilities
Works on all time frames Adapts to any financ
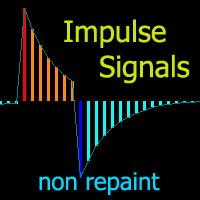
Technical indicator that structures charts and identifies cyclical price movements.
Can work on any charts.
Several types of alerts.
There are additional arrows on the chart itself.
Without redrawing on history, works on closing a candle.
Recommended TF from M5 and higher.
Easy to use and configure parameters.
When using 2 indicators with different parameters, you can use without other indicators.
Has 2 input parameters
Cyclicality and Signal duration
These 2 parameters work with the processin
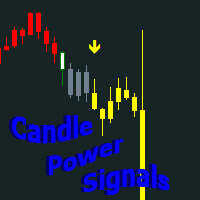
Candle Power Signals is a trend indicator that uses a strategy of searching for potential volatile signals to make trading decisions.
By analyzing the market, the indicator identifies zones of increased and decreased volatility within the directional trend movement.
The main signal generation parameters have already been configured, the remaining settings and periods are indexed into 2 parameters for manual configuration:
1. "Candle calculation method" - 2 signal generation modes, it is recomme
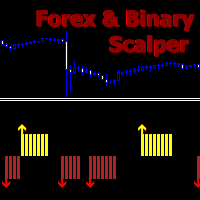
Scalping and Binary Signal Detector - Scalping indicator that gives directional signals for opening positions along the trend.
The indicator is a complete trading system that can be used for Forex and binary options.
The system of algorithms allows you to recognize intense price movements in several consecutive bars.
The indicator provides several types of alerts for arrows.
Works on any trading instruments and time frames (M5 or Higher recommended).
How to use for trading
The appearance of a
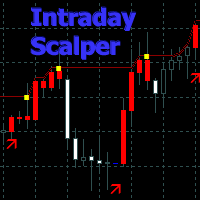
An automatic trend indicator that uses an algorithm to determine impulse signals for scalping and intraday trading.
The trend-following indicator automatically calculates potential entry and exit points for trades.
The indicator contains a trend line and a target channel for following signals, changing color depending on the direction.
Main characteristics
Signal colored candles and arrows: blue - downward direction, red - upward direction. Yellow dots for exiting trades are located along the
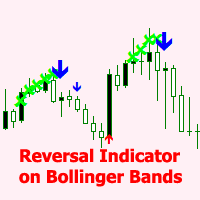
The BB Reversal Arrows technical trading system has been developed to predict reverse points for making retail decisions.
The current market situation is analyzed by the indicator and structured for several criteria: the expectation of reversal moments, potential turning points, purchase and sale signals.
The indicator does not contain excess information, has a visual understandable interface, allowing traders to make reasonable decisions.
All arrows appear to close the candle, without redrawin
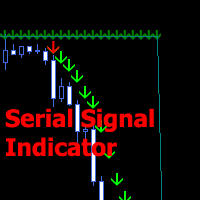
Indicator for manual trading and technical analysis for Forex.
It consists of a trend indicator with the opening level of the trading day and a arrow indicator for determining entry points.
The indicator does not recolor; it works when the candle closes.
Contains several types of alerts for signal arrows.
Can be configured to work on any chart, trading instrument or time frame.
The work strategy is based on searching for price movements along the trend.
To make " Buy " transactions: The tre
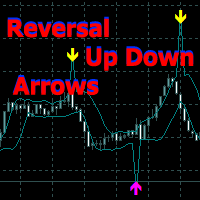
A complex of indicators of recognizing reversal moments. Detects the peaks and hollows according to the combinations of candles after they deduct from two MA. Applicable for trading systems when using early inputs. You can use a trend for scalping and intraday trade, and for detecting a trend in the early stages.
Possibilities
The parameters provide flexible settings for any time floms and trading tools. There are several types of warning for signals. Yellow arrow - Sell signal , pink arrow -
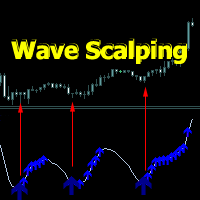
Wave Scalping indicator is a short-term trading strategy based on a wave system. It includes a wave line, entry points and position tracking.
Signal arrows appear when a candle closes. It works without repainting.
It consists of a wave line along which signal arrows are built, and arrows - confirmation of directions after the signal arrows.
Signal arrows are built taking into account the direction of the trend direction. When confirming signal arrows, there are several types of alerts.
To confi
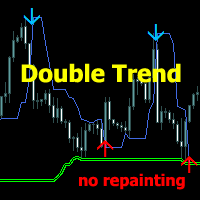
Trading System Double Trend - an independent trading system consisting of several indicators. Determines the direction of the general trend and gives signals in the direction of price movement.
Can be used for scalping, intraday or weekly trading.
Features
Works on any time frames and trading instruments (forex, cryptocurrencies, metals, stocks, indices.) Simple visual reading of information that does not load the chart The indicator does not repaint and does not complete signals Works only wh
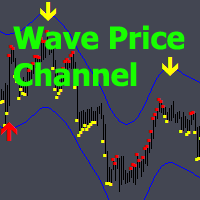
Wave Price Channel - A trading analytical system designed to search for momentum and correction.
The indicator allows you to work in the direction of the price channel, which is built on the basis of volatility.
When an arrow up or down is drawn on the channel, it becomes possible to go in this direction, the signal in this direction is confirmed by a dot indicator sensitive to price changes.
As long as the dots of the same color continue, the signal continues. If there is an arrow, but no dots
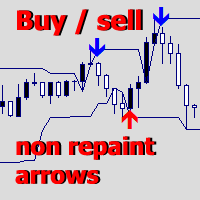
Upper and Lower Reversal - Early forecasting system for reversal points. Allows you to find price reversal points on the boundaries of the upper and lower price movement channels.
The indicator will never repaint or change the position of the signal arrows. Red arrows are a buy signal, Blue arrows are a sell signal.
Adapts to any time frames and trading instruments The indicator does not repaint, it works only when the candle closes. There are several types of alerts for signals The indicator i
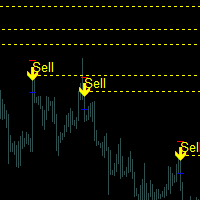
Trading Levels Indicator is a trading system designed to determine entry points, hold positions and trend direction.
Includes several mechanisms working in one complex, wave analysis of trend direction, level analysis when constructing signals, shows possible TP and SL targets.
Indicator capabilities
Signal arrows appear on the current candle, do not repaint. Uses special algorithms to search for levels from which the price bounces. Works according to the trend. The system is universal, can be
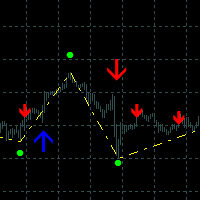
Zig Zag Plus Arrows is a tool for trading and technical analysis on world markets.
Consists of a set of indicators that provide market analysis for making trading decisions.
Includes a trend determinant that provides trading work within the trend direction.
Based on trend arrows, sections of directions and reversal points are built using the Zig Zag algorithm, intuitively showing the future trend and upper / lower fractal peaks.
Arrows for additional entries, working as support and resistance le

Angle Iindicator MT5 - is an indicator for identifying direction changes and trend confirmation.
It analyzes price behavior and identifies reversal points, identifying peaks and troughs on the chart.
It supports trend directions.
Suitable for use on any financial instruments and timeframes.
The internal parameters are already configured; all you need to do is place the indicator on the chart and set the "Multiplier" parameter for the desired result.
The indicator generates arrows on the curren
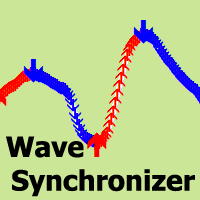
Wave Synchronizer is a visual indicator of wave analysis. Combines candlestick movement sequences and builds directional waves, producing synchronous movements together with the market.
The beginning of each wave begins with a signal arrow, there are also alerts.
The indicator will never redraw or move the arrows on the previous history. Signal arrows appear at the close of the candle. Adapts to work with any trading instruments and time frames. Easy to use and configure, contains only 2 input

Bollinger Trend Signals MT5 - is a trend indicator based on Bollinger Bands. All signals are generated without repainting or lag. It identifies the directional trend channel, potential entry points, and possible exit points for trades.
How the indicator works
The indicator functions by combining a trend channel with a system that identifies price peaks and troughs.
The blue line represents the main smoothed trend line; when it is above the price, the trend channel is bearish, and when it is b