Indicadores técnicos para MetaTrader 4

Gann Made Easy es un sistema de comercio de Forex profesional y fácil de usar que se basa en los mejores principios de comercio utilizando la teoría del Sr. W. D. Gann. El indicador proporciona señales precisas de COMPRA y VENTA, incluidos los niveles de Stop Loss y Take Profit. Puede comerciar incluso sobre la marcha utilizando notificaciones PUSH. POR FAVOR, CONTÁCTEME DESPUÉS DE LA COMPRA PARA OBTENER CONSEJOS DE COMERCIO, BONIFICACIONES Y EL ASISTENTE DE EA "GANN MADE EASY" ¡GRATIS! Probable

AÑO NUEVO 2026 PRECIO DE OFERTA A SÓLO 99 DÓLARES POCAS COPIAS SÓLO A ESTE PRECIO Del 10 de enero al 20 de enero A MEDIANOCHE Oferta final ATRAPE SU COPIA EN ESTA Víspera de Año Nuevo Los precios se incrementarán a 150 una vez finalizado el periodo de oferta EA completo y Alert plus para alertas también serán proporcionados en esta oferta junto con la compra del Indicador. Copias limitadas sólo a este precio y Ea también. Obtenga su copia pronto Alerta más para el indicador con el archivo de con

Un indicador exclusivo que utiliza un algoritmo innovador para determinar con rapidez y precisión la tendencia del mercado. El indicador calcula automáticamente los niveles de apertura, cierre y beneficios, proporcionando estadísticas de negociación detalladas. Con estas características, puede elegir el instrumento de negociación más adecuado para las condiciones actuales del mercado. Además, puede integrar fácilmente sus propios indicadores de flecha en Scalper Inside Pro para evaluar rápidamen

¡Actualmente 20% OFF !
¡La mejor solución para cualquier novato o trader experto!
Este software funciona con 28 pares de divisas. Se basa en 2 de nuestros principales indicadores (Advanced Currency Strength 28 y Advanced Currency Impulse). Proporciona una gran visión general de todo el mercado de divisas. Muestra los valores de Advanced Currency Strength, la velocidad de movimiento de las divisas y las señales para 28 pares de divisas en todos los (9) marcos temporales. Imagine cómo mejorará

M1 SNIPER es un sistema de indicadores de trading fácil de usar. Se trata de un indicador de flecha diseñado para el marco temporal M1. Puede utilizarse como sistema independiente para scalping en M1 o como parte de su sistema de trading actual. Aunque este sistema de trading fue diseñado específicamente para operar en M1, también puede utilizarse con otros marcos temporales. Originalmente, diseñé este método para operar con XAUUSD y BTCUSD. Sin embargo, también lo encuentro útil para operar en

Game Changer es un indicador de tendencia revolucionario, diseñado para usarse en cualquier instrumento financiero y transformar su metatrader en un potente analizador de tendencias. El indicador no se redibuja ni se retrasa. Funciona en cualquier marco temporal y facilita la identificación de tendencias, señala posibles reversiones, actúa como mecanismo de trailing stop y proporciona alertas en tiempo real para una respuesta rápida del mercado. Tanto si es un experto, un profesional o un princi

Primeras 25 copias a $80, después el precio pasa a ser $149 (quedan 13 copias)
Gold Signal Pro es un potente indicador MT4 diseñado para ayudar a los operadores a detectar fuertes reacciones de los precios en el mercado. Se centra en rechazos de mecha claros , mostrando cuando el precio rechaza fuertemente un nivel y a menudo continúa en la misma dirección. Gold Signal Pro está diseñado principalmente para el scalping de oro (XAUUSD) y funciona mejor en plazos más bajos como M5 y M15 , donde

Este indicador es una super combinación de nuestros 2 productos Advanced Currency IMPULSE with ALERT + Currency Strength Exotics .
¡Funciona para todos los marcos de tiempo y muestra gráficamente el impulso de fuerza o debilidad para las 8 divisas principales más un Símbolo!
Este Indicador está especializado en mostrar la aceleración de la fuerza de la divisa para cualquier símbolo como Oro, Pares Exóticos, Materias Primas, Índices o Futuros. Es el primero de su clase, cualquier símbolo p

En primer lugar, vale la pena enfatizar que este Indicador de Trading no repinta, no redibuja y no se retrasa, lo que lo hace ideal tanto para el trading manual como para el automatizado. Manual del usuario: configuraciones, entradas y estrategia. El Analista Atómico es un Indicador de Acción del Precio PA que utiliza la fuerza y el impulso del precio para encontrar una mejor ventaja en el mercado. Equipado con filtros avanzados que ayudan a eliminar ruidos y señales falsas, y aumentan el poten

Volatility Trend System - un sistema de comercio que da señales para las entradas. El sistema de volatilidad da señales lineales y puntuales en la dirección de la tendencia, así como señales para salir de ella, sin redibujar ni demoras. El indicador de tendencia monitorea la dirección de la tendencia a mediano plazo, muestra la dirección y su cambio. El indicador de señal se basa en cambios en la volatilidad y muestra entradas en el mercado.
El indicador está equipado con varios tipos de alert

Trend Ai indicator es una gran herramienta que mejorará el análisis de mercado de un operador al combinar la identificación de tendencias con puntos de entrada procesables y alertas de reversión. Este indicador permite a los usuarios navegar por las complejidades del mercado forex con confianza y precisión Más allá de las señales primarias, el indicador Trend Ai identifica puntos de entrada secundarios que surgen durante retrocesos o retrocesos, lo que permite a los operadores capitalizar las c

Apollo SR Master es un indicador de Soporte/Resistencia con características especiales que facilitan y hacen más fiable la operación con zonas de Soporte/Resistencia. El indicador calcula las zonas de Soporte/Resistencia en tiempo real, sin retrasos, detectando máximos y mínimos locales. Para confirmar la nueva zona de Soporte/Resistencia, el indicador muestra una señal especial que indica que la zona de Soporte/Resistencia puede considerarse y utilizarse como una señal de VENTA o COMPRA. En est

Indicador Miraculous – Herramienta 100% Sin Repintado para Forex y Opciones Binarias Basada en la Escuadra de Nueve de Gann Este video presenta el Indicador Miraculous , una herramienta de trading altamente precisa y potente, desarrollada específicamente para traders de Forex y Opciones Binarias. Lo que hace único a este indicador es su fundamento en la legendaria Escuadra de Nueve de Gann y la Ley de Vibración de Gann , lo que lo convierte en una de las herramientas de pronóstico más precisas d

FX Volume: Experimente el Verdadero Sentimiento del Mercado desde la Perspectiva de un Bróker Resumen Rápido
¿Desea llevar su estrategia de trading a otro nivel? FX Volume ofrece información en tiempo real sobre cómo los traders minoristas y los brókers están posicionados, mucho antes de que aparezcan informes retrasados como el COT. Ya sea que busque beneficios consistentes o simplemente quiera una ventaja más profunda en los mercados, FX Volume le ayuda a identificar desequilibrios important

Matrix Arrow Indicator MT4 es una tendencia única 10 en 1 que sigue un indicador 100% sin repintado de marcos temporales múltiples que se puede usar en todos los símbolos/instrumentos: divisas, materias primas, criptomonedas, índices, acciones. Matrix Arrow Indicator MT4 determinará la tendencia actual en sus primeras etapas, recopilando información y datos de hasta 10 indicadores estándar, que son: Índice de movimiento direccional promedio (ADX) Índice de canales de productos básicos (CCI) Ve

Indicador de tendencia, solución única e innovadora para el comercio y filtrado de tendencias con todas las funciones de tendencias importantes integradas en una sola herramienta. Es un indicador 100% sin repintar de marcos temporales y monedas múltiples que se puede usar en todos los símbolos/instrumentos: divisas, materias primas, criptomonedas, índices y acciones. OFERTA POR TIEMPO LIMITADO: El indicador de detección de soporte y resistencia está disponible por solo 50$ y de por vida. (Precio

ZeusArrow Buscador Inteligente de Liquidez
Smart Liquidity Finder es un indicador controlado por Inteligencia Artificial basado en la idea de Your SL is My Entry. Escanea y dibuja las principales áreas de liquidez en el gráfico dividiéndolas en zonas de prima y de descuento y le permite encontrar las mejores configuraciones de trading posibles y le ayuda a decidir el precio de entrada perfecto para evitar que su Stop Loss sea cazado. Ahora no más confusión acerca de cuándo y dónde entrar. Benef

¡ACTUALMENTE 20% DE DESCUENTO !
¡La mejor solución para cualquier operador novato o experto!
Este indicador está especializado en mostrar la fuerza de la divisa para cualquier símbolo como Pares Exóticos, Materias Primas, Índices o Futuros. Es el primero de su clase, cualquier símbolo se puede añadir a la 9 ª línea para mostrar la verdadera fuerza de la moneda de Oro, Plata, Petróleo, DAX, US30, MXN, TRY, CNH etc. Se trata de una herramienta de trading única, de alta calidad y asequible porqu

Este indicador se centra en dos niveles de take profit y un stoploss muy ajustado; la idea es escalpar el mercado en marcos temporales más altos comenzando desde el m15 en adelante, ya que estos plazos no se ven muy afectados por el spread y la comisión del corredor; el indicador da señales de compra/venta basadas en la estrategia de divergencia de precio, donde grafica una flecha de compra con niveles de tp/sl cuando se cumplen plenamente las condiciones de divergencia alcista. Lo mismo ocurre

Dynamic Forex28 Navigator: la herramienta de trading de Forex de última generación. ACTUALMENTE CON UN 49 % DE DESCUENTO.
Dynamic Forex28 Navigator es la evolución de nuestros indicadores populares de larga data, que combina el poder de tres en uno: Indicador avanzado Currency Strength28 (695 reseñas) + Indicador avanzado Currency IMPULSE con ALERT (520 reseñas) + Señales combinadas CS28 (bonificación).
Detalles sobre el indicador https://www.mql5.com/en/blogs/post/758844
¿Qué ofrece el indi

PUMPING STATION – Tu estrategia personal "todo incluido"
Te presentamos PUMPING STATION, un indicador revolucionario para Forex que transformará tu forma de operar en una experiencia emocionante y eficaz. No es solo un asistente, sino un sistema de trading completo con potentes algoritmos que te ayudarán a operar de forma más estable. Al comprar este producto, recibes GRATIS: Archivos de configuración exclusivos: para una configuración automática y un rendimiento óptimo. Manual en video paso a p

FX Power: Analiza la Fuerza de las Divisas para Decisiones de Trading Más Inteligentes Descripción General
FX Power es tu herramienta esencial para comprender la fuerza real de las principales divisas y el oro en cualquier condición de mercado. Al identificar divisas fuertes para comprar y débiles para vender, FX Power simplifica las decisiones de trading y descubre oportunidades de alta probabilidad. Ya sea que quieras seguir las tendencias o anticipar reversiones utilizando valores extremos

LÍNEAS DE TENDENCIA PRO Ayuda a comprender dónde está realmente cambiando la dirección del mercado. El indicador muestra cambios de tendencia reales y puntos donde los principales actores vuelven a entrar.
Verás Líneas BOS Cambios de tendencia y niveles clave en marcos temporales más altos, sin configuraciones complejas ni ruido innecesario. Las señales no se repintan y permanecen en el gráfico después del cierre de la barra. Lo que muestra el indicador:
Cambios reales tendencia

Si compras este indicador, recibirás mi Gestor de Operaciones Profesional + EA GRATIS.
Primero que todo, vale la pena enfatizar que este Sistema de Trading es un Indicador No Repintado, No Redibujado y No Retrasado, lo que lo hace ideal tanto para el trading manual como para el automatizado. Curso en línea, manual y descarga de ajustes preestablecidos. El "Sistema de Trading Inteligente MT5" es una solución completa de trading diseñada para traders nuevos y experimentados. Combina más de 10

¡Actualmente 20% OFF !
Este tablero de instrumentos es una pieza muy poderosa de software de trabajo en múltiples símbolos y hasta 9 marcos de tiempo. Se basa en nuestro indicador principal (Mejores críticas: Advanced Supply Demand ).
El tablero de instrumentos da una gran visión general. Se muestra: Valores filtrados de Oferta y Demanda, incluyendo la calificación de fuerza de la zona, Pips distancias a / y dentro de las zonas, Destaca las zonas anidadas, Da 4 tipos de alertas para los sím

Este indicador detecta reversiones de precios en forma de zig-zag, utilizando solo análisis de acción de precios y un canal donchian. Ha sido diseñado específicamente para el comercio a corto plazo, sin repintar ni pintar en absoluto. Es una herramienta fantástica para comerciantes astutos con el objetivo de aumentar el tiempo de sus operaciones. [ Guía de instalación | Guía de actualización | Solución de problemas | FAQ | Todos los productos ]
Increíblemente fácil de comerciar Proporciona va

Slayer Binary es un indicador de flecha de una vela con opciones binarias. Este indicador no es para quienes buscan el santo grial, ya que es un enfoque poco realista del trading en general. El indicador ofrece una tasa de acierto estable y, si se usa con gestión de dinero y un objetivo diario, será aún más fiable. El indicador incluye muchas características que se enumeran a continuación:
CARACTERÍSTICAS NO REPINTADO: El indicador no repinta sus flechas en vivo;Una vez que se da una flecha, e

Una estrategia intradía basada en dos principios fundamentales del mercado. El algoritmo se basa en el análisis de volúmenes y ondas de precios utilizando filtros adicionales. El algoritmo inteligente del indicador da una señal solo cuando dos factores de mercado se combinan en uno. El indicador calcula ondas de cierto rango en el gráfico M1 utilizando los datos del marco de tiempo más alto. Y para confirmar la onda, el indicador utiliza el análisis por volumen. Este indicador es un sistema come
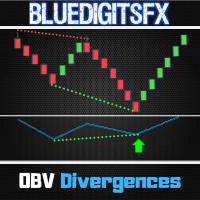
Versión para MT5 disponible aquí:
https://www.mql5.com/en/market/product/50538 Canal y grupo de Telegram:
https://t.me/bluedigitsfx Acceso al grupo VIP:
Envía el comprobante de pago a nuestro buzón privado Broker recomendado:
https://bit.ly/BlueDigitsFxStarTrader BlueDigitsFx OBV Divergence — Potente indicador MT4 para detectar divergencias OBV y predecir reversiones de mercado El indicador BlueDigitsFx OBV Divergence analiza el precio y el volumen On-Balance (OBV) para identificar divergen

Este es un indicador de oro único en el canal de comercio pullbacks y da entradas precisas sobre el oro y los principales pares de divisas en M15tf. Tiene la capacidad de pasar cualquier firma prop Desafío y obtener entradas precisas en el oro y los principales pares de divisas.
EA PARA LA EMPRESA PROP Y EL INDICADOR DE CANAL ES LIBRE JUNTO CON ESTE INDICADOR DE GRAN ALCANCE JUNTO CON EL MEJOR ARCHIVO DE CONJUNTO PARA LOS PRIMEROS 25 USUARIOS. Estrategia probador informe está en la sección de c

Presentamos el Indicador de Avión F-16, una herramienta de vanguardia para MT4 diseñada para revolucionar tu experiencia de trading. Inspirado en la velocidad y precisión incomparables del avión de combate F-16, este indicador combina algoritmos avanzados y tecnología de última generación para ofrecer un rendimiento sin igual en los mercados financieros. Con el Indicador de Avión F-16, sobrevolarás a la competencia, ya que proporciona análisis en tiempo real y genera señales de trading altamente

Amigos, presentamos a su atención nuestro nuevo indicador Forex Gump Laser. Dado que no hay diseñadores en nuestro equipo, pero principalmente matemáticos, financieros, programadores y comerciantes, no hicimos ningún cambio especial en el diseño del indicador. En apariencia, se asemeja a la habitual Forex Gump. Por otra parte, Forex Gump se ha convertido no sólo en el nombre de un indicador, es una marca. Y tratamos de preservar la identidad corporativa en todas sus variedades. Toda la esencia d

Quedan 3 copias a $65, el próximo precio es $120
SMC Easy Signal fue construido para eliminar la confusión en torno al concepto de dinero inteligente, convirtiendo los cambios estructurales como BOS (Break of Structure) y CHoCH (Change of Character) en simples señales de compra y venta. Simplifica la operativa en la estructura del mercado identificando automáticamente las rupturas y retrocesos en el momento en que se producen, lo que permite a los operadores centrarse en la ejecución en lugar

Versión MT5 disponible aquí:
https://www.mql5.com/en/market/product/50048 Canal y grupo de Telegram:
https://t.me/bluedigitsfx Acceso al grupo V.I.P:
Envía el comprobante de pago de cualquiera de nuestros productos de pago a nuestro buzón Broker recomendado:
https://bit.ly/BlueDigitsFxStarTrader BlueDigitsFx Easy 123 System — Indicador potente para detección de reversión y rupturas en MT4 Sistema todo en uno y sin repintado para identificar cambios en la estructura del mercado, rupturas y r

Comercio SHOGUN - El impacto de 16 años sin ajustes. Estructura estratégica del mercado y el arte de perder y ganar. La verdad sobre los "16 años" que horrorizó incluso a los promotores. En primer lugar, por favor vea la imagen adjunta (resultados de backtest). Estos son los resultados de la verificación USDJPY H1 para "16 años enteros "** desde el 1 de enero de 2010 hasta el 1 de enero de 2026. Esto no es una venta de EA (trading automatizado). Pero me atrevo a presentar este gráfico. ¿No son

Horizont es un sistema de trading que proporciona una configuración de operación completa: punto de entrada, objetivo 1, objetivo 2 y stop loss, todo calculado automáticamente. El sistema identifica automáticamente los máximos y mínimos del mercado y los conecta para definir la tendencia actual. Usted selecciona qué tendencia operar y Horizont genera los niveles correspondientes de entrada, objetivos y stop. El sistema incluye gestión automática del riesgo. Verifica el balance de su cuenta, cal

El sistema PRO Renko es un sistema de trading de alta precisión especialmente diseñado para operar gráficos RENKO. Se trata de un sistema universal que se puede aplicar a diversos instrumentos de negociación. El sistema neutraliza eficazmente el llamado ruido de mercado, lo que le brinda acceso a señales de reversión precisas.
El indicador es muy fácil de usar y solo tiene un parámetro responsable de la generación de señales. Puede adaptar fácilmente la herramienta a cualquier instrumento come

ACTUALMENTE 26% DE DESCUENTO
¡La mejor solución para cualquier operador novato o experto!
Este indicador es una herramienta única, de alta calidad y asequible porque hemos incorporado una serie de características propias y una nueva fórmula. ¡Con sólo UN gráfico puede leer la Fuerza de la Divisa para 28 pares de Divisas! Imagínese cómo mejorará su operativa porque podrá señalar el punto exacto de activación de una nueva tendencia o de una oportunidad de scalping.
Manual del usuario: haga cli

El indicador analiza el volumen desde cada punto y calcula los niveles de agotamiento del mercado para ese volumen. Consiste en tres líneas: Línea de agotamiento del volumen alcista Línea de agotamiento del volumen bajista Línea que indica la tendencia del mercado. Esta línea cambia de color para reflejar si el mercado es bajista o alcista. Puedes analizar el mercado desde cualquier punto de inicio que elijas. Una vez que se alcance una línea de agotamiento de volumen, identifica un nuevo punto

Volatility Master para MetaTrader es una herramienta de tablero en tiempo real que escanea hasta 56 símbolos utilizando hasta 2 tableros flexibles en diferentes gráficos para identificar mercados de alta volatilidad y tendencia al instante. Con señales claras alcistas/bajistas, alertas personalizables y una interfaz fácil de usar, le ayuda a evitar condiciones de rango limitado y a centrarse en operaciones de alta probabilidad. La claridad genera confianza. Opere con confianza y proteja su capit
Delta Fusion Pro – Análisis Avanzado de Order Flow para Trading Intradía
Delta Fusion Pro es un indicador profesional para MetaTrader 4 que revela el flujo de órdenes agresivas, mostrando la intensidad y dirección de la presión institucional en tiempo real. A diferencia de los indicadores volumétricos tradicionales, analiza la delta entre volúmenes Ask y Bid para anticipar giros, confirmar tendencias e identificar zonas de interés profesional. Características Principales Sistema Inteligente de

Scalper Vault es un sistema profesional de reventa que le brinda todo lo que necesita para una reventa exitosa. Este indicador es un sistema comercial completo que puede ser utilizado por operadores de divisas y opciones binarias. El marco de tiempo recomendado es M5. El sistema le proporciona señales de flecha precisas en la dirección de la tendencia. También le proporciona señales superiores e inferiores y niveles de mercado de Gann. Los indicadores proporcionan todo tipo de alertas, incluidas

FX Levels: Zonas de Soporte y Resistencia con Precisión Excepcional para Todos los Mercados Resumen Rápido
¿Busca una manera confiable de identificar niveles de soporte y resistencia en cualquier mercado — ya sean divisas, índices, acciones o materias primas? FX Levels combina el método tradicional “Lighthouse” con un enfoque dinámico vanguardista, ofreciendo una precisión casi universal. Gracias a nuestra experiencia real con brokers y a las actualizaciones automáticas diarias más las de tiem

El Oro de Un Minuto es una señal de flechas de entrada filtrada por volumen-precio-tendencia que ayuda a los traders a posicionarse en el lado correcto del mercado y generar oportunidades. ¿Por qué elegir El Oro de Un Minuto? TP-SL. Con objetos de TP y SL integrados que aparecen en el gráfico para cada señal, el trader puede colocarlos fácilmente. La lógica de TP y SL tiene dos métodos: ATR TP-SL y puntos fijos TP-SL. Panel de estadísticas. Un panel informativo que muestra la tasa de aciertos y
FREE

Indicador de avance determina los niveles y zonas de reversión del mercado , permite esperar a que el precio regrese al nivel y entrar al comienzo de una nueva tendencia, y no a su final.
Él demuestra niveles de reversión donde el mercado confirma un cambio de dirección y forma más movimiento.
El indicador funciona sin necesidad de redibujar, está optimizado para cualquier instrumento y revela su máximo potencial cuando se combina con el LÍNEAS DE TENDENCIA PRO

¡Actualmente con 33% de descuento! ¡La mejor solución para cualquier tráder principiante o experto! Este indicador es una herramienta comercial única, de alta calidad y asequible, porque incorpora una serie de características patentadas y una nueva fórmula. Con esta actualización, podrá mostrar zonas de doble marco temporal. No solo podrá mostrar un marco temporal más alto, sino también mostrar ambos, el marco temporal del gráfico MÁS el marco temporal más alto: MOSTRANDO ZONAS ANIDADAS. A todos

Currency Strength Wizard es un indicador muy poderoso que le proporciona una solución todo en uno para operar con éxito. El indicador calcula el poder de este o aquel par de divisas utilizando los datos de todas las monedas en múltiples marcos de tiempo. Estos datos se representan en forma de índice de moneda fácil de usar y líneas eléctricas de moneda que puede usar para ver el poder de esta o aquella moneda. Todo lo que necesita es adjuntar el indicador al gráfico que desea operar y el indicad

The price is indicated only for the first 30 copies ( only 2 copies left ). El siguiente precio aumentará a 150 $. El precio final será de 250 $ . Sniper Delta Imbalance es una herramienta profesional para el análisis profundo de delta - la diferencia entre los volúmenes comprador y vendedor. Lleva el análisis del volumen al siguiente nivel, permitiendo a los operadores ver en tiempo real quién controla el precio -compradores o vendedores-

KATANA Scalper para MT4 Visión general del producto. KATANA Scalper para MT 4 es un indicador avanzado de análisis técnico optimizado para la plataforma MetaTrader 4. El producto fue diseñado para resolver simultáneamente los problemas más desafiantes en el trading a corto plazo (scalping y day trading): ruido de precios y reacción retardada. Un algoritmo único de procesamiento de señales elimina las turbulencias superficiales del mercado y extrae "núcleos de impulso" estadísticamente superiore
** Todos los Símbolos x Todos los Plazos escanean con sólo pulsar el botón del escáner ** Después de 18 años de experiencia en los mercados y la programación, Winner indicador está listo. ¡Me gustaría compartir con ustedes! *** Contacta conmigo para enviarte instrucciones y añadirte en "123 scanner group" para compartir o ver experiencias con otros usuarios. Introducción El indicador 123 Pattern Scanner con un algoritmo especial mejorado es un buscador de patrones comunes muy repetitivo con una

¡Este indicador es un indicador para el análisis automático de ondas que es perfecto para practicar el trading real! Caso...
Nota: No estoy acostumbrado a usar nombres occidentales para clasificar las ondas. Debido a la influencia de la convención de nomenclatura de Tang Lun (Tang Zhong Shuo Zen), nombré la onda básica como pluma y la banda de onda secundaria como segmento . Al mismo tiempo, el segmento tiene la dirección de la tendencia. Se nombra el segmento de tendencia principa

Enorme 70% de venta de Halloween sólo por 24 horas!
Guía manual: Haga clic aquí Este indicador es imparable cuando se combina con nuestro otro indicador llamado Katana . ¡Después de la compra, envíenos un mensaje y podrá obtenerlo GRATIS como BONUS! El Impulso de la Onda de Elliot es un patrón identificado en la Teoría de la Onda de Elliott, una forma de análisis técnico utilizado para analizar los ciclos de los mercados financieros. La Onda de Impulso es considerada la parte más fuerte y pod

Currency Strength Meter is the easiest way to identify strong and weak currencies. This indicator shows the relative strength of 8 major currencies + Gold: AUD, CAD, CHF, EUR, GBP, JPY, NZD, USD, XAU. Gold symbol can be changed to other symbols like XAG, XAU etc.
By default the strength value is normalised to the range from 0 to 100 for RSI algorithm: The value above 60 means strong currency; The value below 40 means weak currency;
This indicator needs the data of all 28 major currency pairs
Este indicador sólo coloca operaciones de calidad cuando el mercado está realmente a su favor con una clara ruptura y retest. La paciencia es clave con esta estrategia de acción del precio!
Si desea más señales de alerta por día, aumente el número junto al parámetro llamado: Sensibilidad de Soporte y Resistencia. Después de muchos meses de duro trabajo y dedicación, estamos muy orgullosos de presentarle nuestro indicador de acción de precios Break and Retest creado desde cero. Uno de los indicad

OJO!!!
Uno de los mejores indicadores de Breakout de todos los tiempos está aquí. Multi Breakout Pattern mira las velas precedentes y los marcos de tiempo para ayudarle a reconocer las rupturas en tiempo real.
La función incorporada de oferta y demanda puede ayudarle a evaluar su toma de beneficios y Stop losses
VER LAS PANTALLAS PARA PRESENCIAR ALGUNOS DE LOS MEJORES BREAKOUTS
ENTRADAS
MaxBarsback: El máximo de barras para mirar hacia atrás
Longitud lenta 1: Period lookback
Slow length 2

Daily Candle Predictor es un indicador que predice el precio de cierre de una vela. El indicador está destinado principalmente para su uso en gráficos D1. Este indicador es adecuado tanto para el comercio de divisas tradicional como para el comercio de opciones binarias. El indicador se puede utilizar como un sistema de negociación independiente o puede actuar como una adición a su sistema de negociación existente. Este indicador analiza la vela actual, calculando ciertos factores de fuerza dent

Apollo Trend Rider es un indicador de flecha fácil de usar que proporciona señales de COMPRA y VENTA. El indicador no se repinta, lo que permite probarlo y adaptarlo a cualquier instrumento y marco temporal que desee utilizar. El indicador proporciona todo tipo de alertas, incluyendo notificaciones push. Este indicador se basa en la combinación de varias estrategias, incluyendo estrategias de tendencia, ruptura y reversión. Es posible utilizarlo como un sistema independiente. Para simplificar aú

Conviértase en un Breaker Trader y obtenga beneficios de los cambios en la estructura del mercado a medida que se invierte el precio.
El indicador de ruptura de bloque de órdenes identifica cuándo una tendencia o movimiento de precio se acerca al agotamiento y está listo para revertirse. Le alerta sobre cambios en la estructura del mercado que generalmente ocurren cuando una reversión o un retroceso importante están a punto de suceder.
El indicador utiliza un cálculo patentado que identifica

¡ACTUALMENTE 20% DE DESCUENTO !
¡La mejor solución para cualquier operador novato o experto!
Este Indicador es una herramienta de trading asequible porque hemos incorporado una serie de características propias junto con una nueva fórmula.
El Indicador Avanzado de Volumen Acumulado de Divisas está especializado para los principales 28 pares de divisas y funciona en todos los marcos temporales. Se trata de una nueva fórmula que en un solo gráfico extrae todo el volumen de divisas (C-Volume) de

Gold Channel es un indicador basado en la volatilidad, desarrollado con un algoritmo de sincronización específico para el par XAUUSD, que consiste en encontrar posibles correcciones en el mercado.
Este indicador muestra dos líneas exteriores, una línea interior (línea de retroceso) y un signo de flecha, donde la teoría del canal es ayudar a identificar las condiciones de sobrecompra y sobreventa en el mercado.
El precio del mercado caerá generalmente entre los límites del canal. Si los precio

Trend Reversal Zone and Alert Zonas de Oferta y Demanda Multi-Timeframe + Señales Precisas de Reversión Trend Reversal Zone and Alert es un indicador profesional de estructura de mercado sin repaint , diseñado para traders que buscan reversiones de alta probabilidad en niveles institucionales clave . El indicador combina de forma inteligente zonas de oferta y demanda de marcos temporales superiores (H4 y D1) con señales precisas de rechazo en los máximos y mínimos diarios , permitiendo entradas

El Rango de Volatilidad Adaptable [AVR] es una potente herramienta para identificar puntos clave de cambio de tendencia. AVR refleja con precisión el Average True Range (ATR) de la volatilidad, teniendo en cuenta el Precio Medio Ponderado por Volumen (VWAP). El indicador se adapta a cualquier volatilidad del mercado calculando la volatilidad media durante un periodo específico, lo que garantiza una tasa estable de operaciones rentables. Usted recibe no sólo un indicador, sino un sistema profesi

Este es un genial indicador para MT4 que ofrece señales precisas para entrar en una transacción sin redibujar. Se puede aplicar a cualquier activo financiero: fórex, criptomonedas, metales, acciones, índices. Nos dará valoraciones bastante precisas y nos dirá cuándo es mejor abrir y cerra una transacción. Eche un vistazo al vídeo (6:22), ¡contiene un ejemplo de procesamiento de una sola señal que ha amortizado el indicador! La mayoría de los tráders mejoran sus resultados comerciales durante l

Day Trader Master es un sistema de comercio completo para comerciantes de día. El sistema consta de dos indicadores. Un indicador es una señal de flecha para comprar y vender. Es el indicador de flecha que obtienes. Le proporcionaré el segundo indicador de forma gratuita. El segundo indicador es un indicador de tendencia especialmente diseñado para usarse junto con estas flechas. INDICADORES ¡NO REPETIR Y NO TARDE! El uso de este sistema es muy sencillo. Solo necesita seguir las señales de flech

El Pips Stalker es un indicador de flecha largo y corto, que ayuda a traders de todos los niveles a tomar mejores decisiones al operar en el mercado, nunca se repinta y utiliza el RSI como lógica principal de señal; una vez que se da una flecha, nunca se repinta ni retropinta y las flechas no se retrasan.
CARACTERÍSTICAS DE LA FLECHA PIPS STALKER :
PANEL DE ESTADÍSTICAS Un panel de información único que muestra el porcentaje general de tasas de victorias y estadísticas útiles como el máximo d

Este indicador proporciona la capacidad de reconocer el patrón SMC, esencialmente una versión condensada del modelo Wyckoff. Una vez que el patrón es confirmado por RTO, representa una oportunidad de inversión significativa . Existen numerosos indicadores relacionados con SMR más allá del mercado, pero este es el primer indicador que aprovecha los patrones para identificar acciones específicas de BigBoy para navegar en el mercado. Actualización 2024-03-08: Añadir función TP por RR. El patrón SMC

Crystal Volume Profile Auto POC (MT4) — Indicador de Perfil de Volumen con POC Automático Descripción
Crystal Volume Profile Auto POC es un indicador ligero para MetaTrader 4 que muestra la distribución del volumen en diferentes niveles de precio. Resalta automáticamente el Point of Control (POC), el nivel con mayor actividad, ayudando a los traders a detectar zonas de soporte/resistencia ocultas y actividad institucional. Disponible también en MT5: Crystal Volume Profile Auto POC (MT5) . Func
FREE

Apollo Pips es un indicador de inversión de tendencia de alta precisión para operar con cualquier par de divisas. Originalmente fue desarrollado para operar con XAUUSD, pero la práctica ha demostrado que el indicador puede usarse con éxito en otros pares. Plazo recomendado H1. El indicador emite una alerta solo cuando se confirma la señal. Por lo tanto, si vio una alerta, puede usar la señal recibida de manera segura. ¡El indicador NO REDIBUJA sus señales! La flecha puede parpadear hasta que se
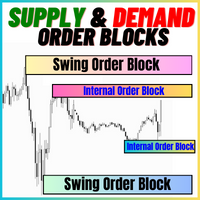
Los Bloques de Orden de Oferta y Demanda:
El indicador "Bloques de Orden de Oferta y Demanda" es una herramienta sofisticada basada en Conceptos de Dinero Inteligente, fundamentales para el análisis técnico de Forex. Se enfoca en identificar zonas de oferta y demanda, áreas cruciales donde los traders institucionales dejan huellas significativas. La zona de oferta, que indica órdenes de venta, y la zona de demanda, que indica órdenes de compra, ayudan a los traders a anticipar posibles reversa
FREE

El indicador construye un semáforo de tres periodos y un patrón de inversión 123 desde el extremo. La señal se produce en la apertura de la segunda vela. Este patrón se puede negociar de diferentes maneras (punto de prueba 3, ruptura y otros). La salida del canal o la ruptura de la línea de tendencia es el principal desencadenante para encontrar un punto de entrada. Los iconos están coloreados según los niveles de Fibonacci. Los iconos amarillos indican una prueba de un nivel en el que la señal
123456789101112131415161718192021222324252627282930313233343536373839404142434445464748495051525354555657585960616263646566676869707172737475767778798081828384858687888990919293949596979899100101102103104105106107108109110111112113114115116117118119120121122123124125126127128129130131132133134135136137138139140141142143144145146147148149150151152153154155156157158159
¿Sabe usted por qué MetaTrader Market es el mejor lugar para vender estrategias comerciales e indicadores técnicos? Con nosotros, el desarrollador no tiene que perder tiempo y fuerzas en publicidad, protección del programa y ajustes de cuentas con los compradores. Todo eso ya está hecho.
Está perdiendo oportunidades comerciales:
- Aplicaciones de trading gratuitas
- 8 000+ señales para copiar
- Noticias económicas para analizar los mercados financieros
Registro
Entrada
Si no tiene cuenta de usuario, regístrese
Para iniciar sesión y usar el sitio web MQL5.com es necesario permitir el uso de Сookies.
Por favor, active este ajuste en su navegador, de lo contrario, no podrá iniciar sesión.