Indicadores técnicos para MetaTrader 4 - 30
Este indicador analiza qué tan eficiente es el movimiento actual del mercado basado en la verdadera relación alto-bajo de un cierto número de barras. [ Guía de instalación | Guía de actualización | Solución de problemas | FAQ | Todos los productos ] La relación es la efectividad del movimiento del mercado. Una relación inferior a 1 significa que el mercado no va a ninguna parte Una relación superior a 1 significa que el mercado está comenzando a mostrar direccionalidad. Una relación superior a
FREE

Título del producto Smart Williams' %R (MT4) – parte de la serie SmartView Indicators Descripción breve Indicador Williams' %R con una experiencia de usuario única en la plataforma MetaTrader. Ofrece capacidades avanzadas no disponibles anteriormente, como abrir configuraciones con doble clic, ocultar y mostrar indicadores sin eliminarlos, y mostrar la ventana del indicador a tamaño completo del gráfico. Diseñado para funcionar perfectamente con el resto de la serie SmartView Indicators. Visión
FREE
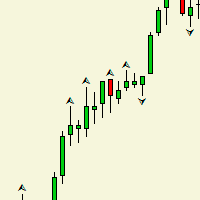
El indicador dibuja un fractal en el gráfico, y ¿cuál es la diferencia con un fractal normal? se preguntará. La respuesta es que después de la formación de la segunda barra, el fractal se dibuja y no se elimina, a diferencia de lo habitual. Este indicador se crea para ampliar el Robot de Trading. Forma una de las partes más importantes del robot. Como la salida de trading. El indicador no tiene parámetros de entrada.
FREE

Trend easy es un sencillo indicador de tendencia en forma de histograma. la ventana del indicador se divide en dos partes el histograma superior es un movimiento de compra, el histograma inferior es un movimiento de venta. Además del histograma, la señal del indicador se duplica en el gráfico mediante flechas. El menú del indicador contiene número de barras en el historial del indicador
valores de periodo para la detección de tendencias permiso para dibujar flechas en el gráfico código y colores
FREE

Este indicador se basa en el gráfico de precios altos y bajos de diferentes períodos. Y si lo desea, el indicador puede alertarle cuando el precio actual llegue a estos niveles. Opciones de Alerta: Enviar Mensaje Móvil, Enviar E-mail, Mostrar Mensaje, Alerta Sonora Periodos de Tiempo: M1, M5, M15, M30, H1, H4, D1, W1, MN Entradas: TimeShift: Puede establecer la hora de inicio para el cálculo. De esta manera puede ver los niveles independientemente de la zona horaria del servidor del broker. PipD
FREE

Indicador de oscilador estocástico suavizado (xStoh)
Parámetros de entrada: xK Período - K período xD Period - periodo D xSlowing - desaceleración xMethod - método de promediación (0-SMA | 1-EMA | 2-SMMA | 3 - LWMA) xPrice field - tipo de precio (0 - Low/High | 1 - Close/Close) Principio de funcionamiento
El indicador recalcula el indicador técnico estándar Oscilador Estocástico (promedia dos veces los valores iStochastic obtenidos).
FREE

El indicador RSI Candle Signal cambiará el color de las barras cuando se alcancen los niveles de sobrecompra o sobreventa establecidos.
Cómo utilizar la señal de vela del RSI Tendencia alcista/tendencia bajista - El RSI puede utilizarse para detectar mercados en tendencia. Por ejemplo, el RSI puede permanecer por encima de la línea media 50 en una tendencia alcista. Máximos y mínimos : el RSI puede ayudar a identificar los máximos en torno a las lecturas de sobrecompra (normalmente por encima d
FREE

Con el indicador MACD Multi Time Frame, puede detectar divergencias de plazos superiores mientras busca entradas precisas en plazos inferiores. Esta versión GRATUITA del indicador sólo funciona en EURUSD y GBPUSD. La versión completa del indicador se puede encontrar aquí: MACD Multi Cuadro de Tiempo Esta entrada del blog le ofrece GRATIS el Análisis de Divergencia MACD en TIEMPO REAL y consejos sobre cómo operar con las divergencias: Análisis de Divergencia MACD EN TIEMPO REAL El MACD Multi Time
FREE

Indicador CCI Trend Finder con diferentes colores en los niveles 0, 100 y -100. La cruz es una señal de "Salida 123" presentada por MPlay y utilizada en el sistema CCI de Woodies. Esta señal de salida es efectiva especialmente en operaciones de ruptura a corto plazo, ya que evita la salida anticipada en pequeñas correcciones. Este indicador es ideal para tenerlo como una herramienta extra para su análisis.
FREE
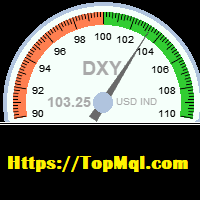
Este indicador se utiliza para calcular el índice del dólar de acuerdo con la fórmula de los pares de divisas (EURUSD, GBPUSD, USDJPY, USDSEK, USDCHF, USDCAD), incluso si el corredor no tiene el símbolo del dólar. este Indicador muestra el gráfico del índice del dólar en una ventana separada en la parte inferior del gráfico. También muestra gráficamente el índice del dólar actual. En este indicador, es posible establecer el valor mínimo y máximo del indicador, así como su escala de tamaño en el
FREE

Es una herramienta sencilla pero útil para crear una cuadrícula basada en las Bandas de Bollinger .
Sólo se pueden establecer 2 parámetros: 1) "Período" - el período de todas las Bandas de Bollinger visibles (es decir, 4) y 1 Media Móvil (eje de todas las Bandas de Bollinger), 2) "Distancia de las desviaciones" - la distancia entre las Bandas de Bollinger.
Naturalmente, los colores de las 9 líneas se pueden cambiar como se desee. Funciona con todo lo que está disponible en su Market Watch.
¡
FREE

El indicador es una herramienta multifuncional para automatizar el análisis y la visualización del proceso de negociación. Principales características:
Visualización de noticias: el indicador carga y muestra automáticamente las noticias económicas en el gráfico, lo que le permite tener en cuenta los acontecimientos importantes a la hora de operar. Cambio dinámico del marco temporal - durante la publicación de noticias, el gráfico cambia a un período preestablecido para un análisis más detallado
FREE

El indicador StrikePin es una herramienta técnica y analítica diseñada para identificar cambios de tendencia y encontrar entradas óptimas en el mercado. El indicador StrikePin se basa en el patrón de la barra pin, que es el patrón de inversión de la acción del precio.
Una señal de entrada, en un mercado en tendencia, puede ofrecer una entrada de muy alta probabilidad y un buen escenario de riesgo-recompensa.
Tenga cuidado: el indicador es repintado ya que busca los máximos más altos y los mín
FREE
RaysFX Información Comercial Hola a todos, me complace presentarles nuestro último indicador, RaysFX Trade Info. Esta herramienta está diseñada para proporcionar información detallada acerca de sus operaciones directamente en su gráfico MT4. Características principales Información en tiempo real : RaysFX Trade Info proporciona información en tiempo real sobre sus operaciones abiertas y cerradas. Puede ver el beneficio en puntos, divisa y porcentaje. Personalizable : El indicador es altamente per
FREE

Moving Average Dashboard Bars ago es un tablero único multi divisa, multi marco de tiempo. El panel es muy sencillo. Usted selecciona dos medias móviles, los instrumentos y los plazos. El panel de medias móviles Bars ago muestra cuántas barras hace que las medias móviles hicieron un cruce alcista o bajista. También muestra en tiempo real cuándo se produce un cruce alcista o bajista. El indicador se traza en una subventana. El Cuadro de Mando de Medias Móviles Barras atrás puede ser beneficioso s
FREE

Smart Trend Line Alert es un indicador profesional de las líneas de tendencia, así como de las líneas de soporte/resistencia con la función de la alerta.
Características: El modo Auto y Click para convertir la nueva línea dibujada en la línea de alerta («Línea de tendencia» o «Línea horizontal»); La división entre las líneas de diferentes períodos de tiempo mediante la ocultación de las líneas de los períodos menores en los períodos mayores para no confundirse en la gran cantidad de líneas de
FREE

Cómo operar
¡Ejecute sus operaciones en 3 sencillos pasos!
Paso 1: Configuración de la operación Entrada Comprar en Línea color Azul Toque en línea color Rojo. Entrada Vender en la línea de color Azul Toque en la línea de color Verde. Tasa de éxito ≥ 80% 100:20 depende de su experiencia y la rapidez de su toma. Paso 2: Establecer Stop Loss Stop loss COMPRA ----> Usted no puede poner stoploss con un precio fijo, su velocidad en la determinación de la solicitud de cierre------>Línea de color Azul
FREE
ATR Channels_PRT indicator can be used to identify trend and support and resistance levels.The price chart of a currency pair displays three price channels that are plotted using moving averages and the ATR value.
Indicator settings allow you to assign a specific coefficient to each price channel, which makes it possible to narrow or expand each channel separately. The ATR Channels_PRT indicator is a multicurrency instrument, so the choice of a timeframe depends solely on the trader’s preferenc
FREE

Este indicador se basa en el indicador MACD
Además, algunos patrones de velas se utilizan en él para identificar mejores señales
Puede ser utilizado en todos los símbolos
Puede ser utilizado en todos los marcos de tiempo
Método fácil de usar
Ajustes adecuados
Ajustes: Periodo: El número de velas utilizadas para calcular las señales. pFast: Como los ajustes del indicador MACD pLento: Como la configuración del indicador MACD
alarmShow: Si desea recibir una alerta en Metatrader después de recib
FREE
ATT Support and Resistance es un indicador liviano para MetaTrader que encuentra máximos y mínimos locales en tiempo real utilizando el principio fractal y traza automáticamente niveles de soporte y resistencia significativos en función de ellos. Elimina el "ruido" de las líneas muy espaciadas y actualiza las zonas con cada nuevo tick sin una carga innecesaria en la terminal. Indicador clásico con máxima facilidad de configuración y ajuste del número de zonas a visualizar. Y también regulando l
FREE

Indicador "Supply and Demand Channels" para MetaTrader: Potencia tu Trading con Claridad y Precisión El indicador "Supply and Demand Channels" para MetaTrader es una herramienta avanzada diseñada para brindar a los traders una visión nítida y precisa de las zonas clave de oferta y demanda en el mercado. Basado en el principio fundamental de la ley de oferta y demanda, este indicador ofrece una interpretación gráfica única de las fuerzas que impulsan los movimientos de precios. Características De
FREE
¿Qué es una herramienta? Este indicador se utiliza para pronosticar la dirección de los 28 pares, se calcula a partir de múltiples pares y plazos y se presenta por porcentaje como 70-79% , 80-89% , 90-100% es una tendencia pequeña, media y fuerte. Modo de empleo Coloque el indicador en cualquier par y cualquier marco de tiempo. Pair : Any Timeframe : Any Input Parameter No Visit my products Target Profit Magic Target Profit All The Profit Tracker Currency Scoring Pair Direction
FREE

(traducción de Google) Este indicador se basa en el “ Volumen segmentado en el tiempo (TSV) ” original desarrollado por Worn Brothers, Inc . Sin embargo, agregué algunas funciones adicionales a esta. Se puede elegir el precio que se aplicará, en lugar de tener solo el precio de cierre predeterminado utilizado por el original. También se puede elegir qué ponderación de volumen usar, incluido un pseudovolumen basado en el rango real, o ninguna ponderación de volumen. (Original text) This indicator
FREE
Este indicador muestra todo el historial de órdenes en el gráfico con el mismo símbolo. Le ayuda a ver la hora y el precio en que se abrieron y cerraron las órdenes. 1) Mostrar todo el historial 2) Abra el gráfico con el símbolo que necesita ver 3) Adjuntar el indicador 4) Pulse la tecla "h". -Línea descendente Azul: vender con beneficio -Línea descendente Roja: compra con pérdida -Línea azul ascendente: compra con beneficio -Línea ascendente roja: vender con pérdida.
FREE

TrendPeakValley Scanner v1 - Herramienta avanzada de detección de reversiones.
TrendPeakValley Scanner v1 es un potente indicador personalizado diseñado para detectar picos y valles de precios basado en el análisis de la acción del precio. Destaca visualmente los máximos y mínimos locales, por lo que es ideal para los operadores que confían en la estructura del mercado, las zonas de soporte/resistencia y los patrones de inversión.
---
Características principales:
Detección de pico
FREE
Indicador de señales cíclicas. Da señal en el ciclo de rango de precios y suavizado con algoritmo. Hay parámetros muy pequeños: permitir alertas (Pop Up o Email), colores para las flechas de gráficos, marco de tiempo a utilizar para el cálculo (pero es mejor utilizar el marco de tiempo actual). Y el parámetro más importante es "período". Para plazos bajos se recomiendan valores altos. El periodo actual es bueno para M5. Disminuirlo para plazos más altos. Cerrar flechas comerciales vendrá pronto
FREE

SRP (Strong Retracement/Reversal Points) es un poderoso y único indicador de soporte y resistencia. Muestra los niveles importantes más cercanos en los que esperamos el retroceso/reversión del precio. Si todos los niveles se rompen por un lado, recalcula y dibuja nuevos niveles de soporte y resistencia, por lo que los niveles pueden ser válidos durante varios días dependiendo del mercado.
Características principales Puede utilizarlo en todos los plazos inferiores al diario. Muestra los niveles
FREE

El indicador muestra el cruce del nivel cero por la Media Móvil del Oscilador (OsMA) en forma de flechas. Este es un indicador multi-marco de tiempo, y muestra las señales de otros marcos de tiempo. El indicador notifica sobre una señal por medio de una ventana emergente de Alerta, o enviando una notificación al correo electrónico.
Parámetros Time-frame - seleccionar el timeframe para mostrar las señales del indicador. Periodo EMA rápida - EMA rápida. Es una media móvil exponencial de un precio
FREE
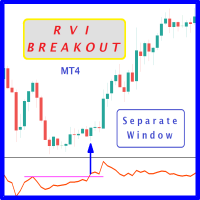
Surge la probabilidad de registrar precios más altos cuando el RVi rompe el nivel de resistencia histórico del oscilador. Se recomienda encarecidamente confirmar la ruptura del precio con la ruptura del oscilador, ya que tienen efectos comparables a la ruptura del precio de los niveles de soporte y resistencia; sin duda, las operaciones cortas tendrán la misma percepción. Como ventaja, muchas veces la ruptura del oscilador precede a la ruptura del precio como alerta temprana de un evento próximo
FREE

Nivel Clave Key Level es un indicador de MetaTrader 4 que utiliza un algoritmo propio basado en el método Price Retracement/Breakout para mostrar la línea de entrada en sus operaciones.
En su lugar, analiza los datos del mercado e identifica los puntos de entrada y las oportunidades. (Price Retracement / Price Breakout)
También es una herramienta de negociación que se utiliza para practicar y mejorar sus habilidades de negociación manual.
Key Level es una herramienta increíble para Scalping Trad
FREE
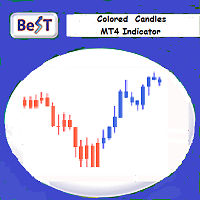
BeST_Colored Candles es un indicador GRATUITO para MT4 que puede cambiar el color de las Velas en función de los valores y niveles del MACD, SAR o RSI. Es un indicador Compuesto que por selección utiliza los valores cada uno de estos 3 indicadores y sus niveles críticos para crear relaciones numéricas que cuando se satisfacen provocan su correspondiente coloración de las velas.
Parámetros de entrada
== Configuración Básica
-- Please Select Indicator - para seleccionar cual de los 3 indicador
FREE

BeST_Chande RAVI (Índice de Verificación de Acción de Rango) es un indicador de MT4 que se basa en el indicador correspondiente desarrollado por Tushar Chande, que se basa principalmente en el impulso del mercado, mientras que se centra en la identificación de los mercados de rango y tendencia.
Por defecto RAVI se define por la fórmula: RAVI = Valor absoluto (100 x (SMA(7) - SMA(65)). También por defecto hay un nivel de referencia arbitrario del 3% que significa que un mercado está oscilando si
FREE
Este indicador permite ocultar el indicador ZigZag (en todos los timeframes de MT4) a partir de una fecha definida por el usuario con el panel ("Hidden Candles"). Este indicador puede ser usado con otros "Indicadores Ocultos". Entradas del indicador: Profundidad Desviación Paso atrás La información sobre el indicador "ZigZag" está disponible aquí: https: //www.mql5.com/en/articles/1537 ************************************************************* Somos una comunidad y tenemos el mismo objetivo:
FREE

El indicador Supertrend Line le muestra la tendencia mediante un cálculo basado en el ATR.
¿Cómo funciona? La Supertendencia dibuja una línea siguiendo la tendencia actual, esta línea es el resultado del cálculo realizado con el ATR. Una línea por debajo de la vela significa una probable tendencia alcista Una línea por encima de la vela significa una probable tendencia bajista.
Cómo operar con el indicador CSL Compre cuando la línea de Supertendencia esté por debajo del precio, Venda cuando la
FREE
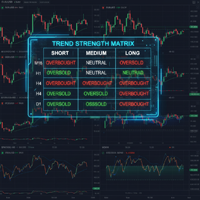
Desarrollado por el Equipo Quant de SVX Strategies ¿Cansado de cambiar entre gráficos? Trend Strength Matrix le ofrece una visión de águila del mercado. Este panel de control profesional monitorea el estado del RSI Adaptativo en 4 marcos temporales clave (M15, H1, H4, D1) simultáneamente. Deje de Monitorear, Empiece a Automatizar
Mirar un panel todo el día es agotador. Si prefiere que la ejecución sea gestionada automáticamente por nuestros sistemas, copie nuestros algoritmos oficiales: Copiar
FREE
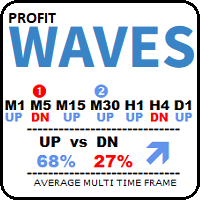
MT Rider - Indicador de Tendencia Multi Plazo (Edición Gratuita) Actualización importante para todos los usuarios de MT Rider Hemos creado un espacio oficial de la comunidad , donde se darán a conocer todas las futuras mejoras, actualizaciones y herramientas adicionales.
Esto incluye: ️ próximas versiones mejoradas de MT Rider
️ acceso al panel de trading MT4 OneClick
️ avances de nuevas herramientas
️ soporte y recursos útiles
️ comunicación directa y anuncios Si ya tienes MT Rider descar
FREE
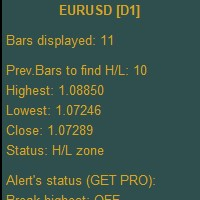
La superposición de gráficos de plazos superiores mostrará velas de plazos superiores, incluido el número de velas altas/bajas que especifique.
Ya no es necesario cambiar de plazo para comprobar las velas. Todo puede ser mostrado en un solo gráfico. Obtener la versión completa - https://www.mql5.com/en/market/product/115680 Por favor, no dude en ponerse en contacto conmigo si tiene alguna pregunta acerca de esta herramienta.
FREE

Este indicador está diseñado para detectar las mejores divergencias entre precio/MACD y precio/RSI. MACD y RSI producen con mucho las mejores señales de divergencia por lo tanto este indicador se centra en esas dos divergencias. Esta es la versión GRATUITA del indicador: https://www.mql5.com/en/market/product/28375
Información Importante Cómo puede maximizar el potencial del escáner, por favor lea aquí: www.mql5.com/en/blogs/post/718074
La versión gratuita sólo funciona con EURUSD y GBPUSD. Es
FREE

El indicador R Wavy Dash transforma los datos de precios en un excelente indicador de señales de seguimiento de tendencias que funciona para la entrada y salida de operaciones. Aparece en el gráfico principal como una línea de señales de colores y se puede utilizar como una herramienta de negociación independiente.
El indicador R Wavy Dash es muy confiable, liviano y no ralentizará su plataforma de negociación.
Puntos clave Indicador de señal de tendencia Amigable para novatos no volver a pin
FREE
Echa un vistazo a otros grandes productos de https://www.mql5.com/en/users/augustinekamatu/seller
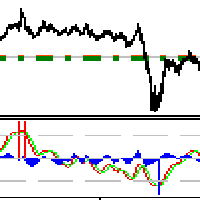
Este indicador es el mejor hasta ahora en la estimación de puntos de reversión especialmente en marcos de tiempo altos. No se repinta y se basa en una combinación de medias móviles calculadas utilizando funciones personalizadas. No requiere entradas, es simple plug and play. Los principios utilizados garantizan que se puede utilizar en CFDs, materias primas y acciones con resultados increíblemente
FREE
Este indicador exclusivo de MT4 resalta las Barras de Amplio Rango (WRBs) directamente en su gráfico, este indicador se centra en ayudar a los operadores a identificar movimientos significativos de precios y cambios de volatilidad. La configuración personalizable permite a los usuarios ajustar la sensibilidad, los colores y los criterios de la barra.
Exclusivo para los miembros de mi comunidad. Cualquier ayuda con el indicador DM mí en discordia.
FREE

Indicador de canal Keltner clásico, versión ampliada. Funciona en cualquier instrumento. Muestra las Bandas de Keltner bajo estos parámetros: * periodMa - Período de la media móvil * periodAtr - Período de ATR (Average True Range) * atrMultiplier - Multiplicador ATR, multiplica el rango, calculado por el parámetro PeriodATR * modeMA - modos de cálculo de la media móvil (MA) (Simple, Exponential, Smoothed, Linear Weighted) * modePrice - modos de cálculo del precio para MA (Cierre, Apertura, Máxim
FREE

El indicador Ondas Mono está diseñado para mostrar el comportamiento de las ondas del mercado en un gráfico. Su aspecto se presenta en la diapositiva 1. Este indicador utiliza el indicador PPPC (Point-Percent Price Channel), que puede descargarse gratuitamente del Mercado . Cuando el mercado se mueve al alza, el borde superior del canal de precios se construye sobre los precios máximos de las velas (para más detalles, consulte la descripción del indicador PPPC en el enlace anterior). Cuanto más
FREE

Este indicador se basa en el indicador ADX e indica la tendencia muy fácilmente.
Puede personalizar el indicador según sus necesidades: ADXPeriod Nivel_señal_ADX BarWidth CandleWith HeikenAshi
El indicador de velas de color Adx es totalmente GRATIS y compatible con la otra parte del sistema; la flecha Acc >>>> https://www.mql5.com/en/market/product/33770 Disfrute y echa un vistazo a mi otro indicador: https: //www.mql5.com/en/market/product/32111
FREE

Entrada equilibrada por VArmadA
Un simple pero poderoso indicador de soporte/resistencia basado en un fractal
Funciona con marcos de tiempo 1H y superiores y probado en todos los pares principales. Preste atención a la señal: Una flecha que indica una entrada larga o corta.
Cómo funciona:
Las flechas indican soporte/resistencia invertida. La flecha hacia arriba significa largo - la flecha hacia abajo indica una operación corta.
Instrucciones:
- Indicador Largo/Indicador Corto: Elija los c
FREE

Indicador compatible sólo con: Entry Point to Trend Pro Soporte del indicador de enlace : https://www.mql5.com/en/market/product/70867
Soporta todos los pares de divisas declarados en la definición. Ayuda a los inversores no necesitan abrir muchos gráficos. Tenga en cuenta el DEAL: múltiples marcos de tiempo de confluencia M15, H1, H4.
Punto de entrada a Trend Pro El indicador ayuda a los inversores a identificar el punto de inversión más temprano y perfecto. Fácil de tomar la decisión de op
FREE
Descripción del producto: BBMA Dashboard Guide BBMA Dashboard Guide es un indicador basado en BBMA diseñado para ayudar a los operadores a monitorear la estructura del mercado en todos los marcos de tiempo - desde MN1 hasta M1 - en un tablero limpio e interactivo. Con esta herramienta, ya no tendrá que alternar entre varios gráficos. Toda la información clave se muestra en un cuadro de mandos único y fácil de leer . Características principales: E structura Multi-Timeframe
Visualice instan

Trendy Stock es un indicador de seguimiento de precios que utiliza el estocástico para mostrar cuándo el precio está fuera de las zonas de sobreventa o sobrecompra. El algoritmo le permite permanecer más tiempo en una tendencia donde los toros o los osos tienen el control. El indicador cambia de color inmediatamente cuando el precio sale del estado de sobreventa/sobrecompra. En resumen, las barras de tendencia bajista [rojas] empiezan a pintar cuando la presión compradora disminuye, mientras qu
FREE

Título del producto Smart CCI (MT4) – parte de la serie SmartView Indicators Descripción breve Indicador CCI con una experiencia de usuario única en la plataforma MetaTrader. Ofrece capacidades avanzadas no disponibles anteriormente, como abrir configuraciones con doble clic, ocultar y mostrar indicadores sin eliminarlos, y mostrar la ventana del indicador a tamaño completo del gráfico. Diseñado para funcionar perfectamente con el resto de la serie SmartView Indicators. Visión general La serie S
FREE

Título del Producto Clean Fractal Pro — Indicador RSI Fractal Bias: Señales de Precisión con Ventaja H4 Desbloquea operaciones de alta probabilidad en gráficos M30 con este potente indicador sin repintado . Combina: Sesgo RSI H4 (>50 para alcista, <50 para bajista) para filtrar tendencias mayores. SMA de 20 periodos (Precio Típico) para soporte/resistencia dinámico. Momento RSI M30 (por encima de 40 para compras, por debajo de 60 para ventas) para cronometrar entradas. Confirmación Fractal (f
Presentación de Quantum Signal Pro: Su ventaja en el mercado ¿Está cansado de cuestionar sus decisiones de inversión? ¿Desearía tener una forma más clara y precisa de detectar las tendencias del mercado y los posibles retrocesos? No busque más! Quantum Signal Pro está aquí para transformar su experiencia de trading, ofreciéndole un sistema sofisticado pero fácil de entender que atraviesa el ruido del mercado para ofrecerle información procesable. Imagínese tener un socio de confianza que le guía
FREE

Este indicador identifica velas pinbar en el gráfico y muestra una flecha como señal de operación basada en el patrón de la vela. Ofrece funciones fáciles de usar, como notificaciones push y otros tipos de alertas. Es muy eficaz para identificar puntos de entrada o posibles retrocesos a precios superiores o inferiores. Además, funciona en cualquier marco temporal.
FREE

Visor de calendario económico
Este lector de eventos económicos está adaptado para cargar datos desde un fichero csv. Usted mismo puede preparar el fichero csv según esta plantilla, puede hacerlo en el bloc de notas o en csved. El archivo debe llamarse normalmente Calendario-MM-DD-AAAA.csv. Y contener líneas con cabeceras de columnas de datos según este ejemplo. En la columna Impacto, es decir, repercusión en el mercado en función de la importancia del acontecimiento, los nombres aceptados des
FREE

La VMA es una media móvil exponencial que ajusta su constante de suavizado en función de la volatilidad del mercado. Su sensibilidad crece a medida que aumenta la volatilidad de los datos. Basada en el Oscilador de Momento de Chande, la VMA puede ajustar automáticamente su periodo de suavización a medida que cambian las condiciones del mercado, lo que le ayuda a detectar las inversiones de tendencia y los retrocesos de forma mucho más rápida y fiable en comparación con las medias móviles tradici
FREE
Descripción
La base de este indicador es un algoritmo ZigZag basado en ATR y Fibo retracement. Este indicador no es redibujante en el sentido de que el último hombro del ZigZag se forma justo después de que las condiciones apropiadas ocurren en el mercado. El hombro no cambia su dirección después (sólo puede continuar). Nota: También está disponible un indicador con posibilidades avanzadas.
Parámetros de entrada del indicador
Los parámetros de entrada permiten cambiar la sensibilidad del ZigZ
FREE
Este indicador permite ocultar Fractales Bill Williams (en todos los timeframes de MT4) a partir de una fecha definida por el usuario con una línea vertical (Solo) o un panel (con "Velas Ocultas"). Entradas del Indicador: Color del Indicador Ancho del Indicador Información sobre el indicador "Fractales" está disponible aquí: https: //www.metatrader4.com/en/trading-platform/help/analytics/tech_indicators/fractals ************************************************************* Somos una comunidad y
FREE
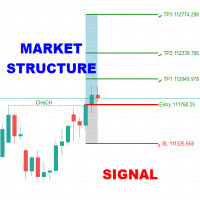
El indicador Market Structure Signal está diseñado para detectar cambios de carácter (CHoCH) y rupturas de estructura (BOS) en la acción del precio, ayudando a los operadores a identificar posibles cambios o continuaciones de tendencia. Combina el análisis de la estructura del mercado con la volatilidad (ATR) para destacar posibles zonas de riesgo/recompensa, al tiempo que admite alertas multicanal para que no se pierda ninguna señal de negociación. Interpretación Análisis de tendencias : La col

El M.O.D.E significa "Multiple Oscillator Divergence Exit ". Es un indicador que señala una divergencia entre el precio, y múltiples osciladores. Inicialmente es un indicador de salida porque señala el debilitamiento de una tendencia, pero podría ser utilizado como una señal de entrada si se utiliza analíticamente. Características principales: Comprueba muchas divergencias a la vez No repinta Envía Alertas y Notificaciones Push Puedes cargar el M.O.D.E en un solo gráfico, y ser capaz de ver las
FREE

Las Bandas Bolliger On-Off le permiten controlar el indicador utilizando el teclado o un botón . Usted puede elegir si desea que el indicador siempre se muestra o siempre oculta al cambiar entre diferentes marcos de tiempo o instrumentos financieros . ---> Este indicador es parte del Combo Indicador OnOff
Las Bandas de Bollinger identifican el grado de volatilidad en tiempo real de un instrumento financiero . Una amplitud menor corresponde a una volatilidad baja, por el contrario, una banda ma
FREE
Indicador de volumen altamente configurable.
Características: Funciones de alerta altamente personalizables (en niveles, cruces, cambios de dirección vía email, push, sonido, popup). Capacidad de múltiples marcos temporales Personalización del color (en niveles, cruces, cambios de dirección) Opciones de interpolación lineal y modo de histograma Funciona en el probador de estrategias en modo de múltiples marcos temporales (también en fin de semana sin ticks) Parámetros:
Volumen Timeframe: Puede
FREE

MQLTA Candle Timer es un indicador que puede mostrarle los detalles sobre un símbolo/par y alertarle antes del cierre de una vela. Utilizado en swing trading y no solo, puede ayudar a que tus estrategias se conozcan y estén listas antes del cierre de una vela.
Cómo funciona Simplemente añade el indicador al gráfico y configura las opciones de notificación. Puede cargar una interfaz minimalista o una interfaz completa. La alerta se enviará una vez por vela.
Parámetros Todos los parámetros, que
FREE
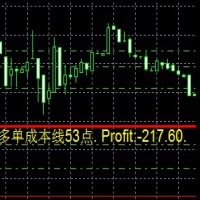
Este es un indicador
Se trata de un indicador que siempre refleja los costes de transacción y la rentabilidad a corto plazo.
Especialmente cuando se basa en la estrategia de Martin, es más preciso. Se trata de un indicador
Es un indicador en tiempo real de los costes de los pedidos y de la rentabilidad en tiempo real.
Se trata de un indicador especialmente útil cuando se trata de la Martin-Strategy. Esto es un indicador
Es un indicador que refleja siempre el coste de la orden y la rentabili
FREE

Momento de operar El indicador del momento oportuno para operar se basa en la volatilidad del mercado a través de 2 indicadores ATR para determinar el momento oportuno de una operación. El indicador determina los momentos en que el mercado tiene una fuerte volatilidad en la tendencia. Cuando el histograma es mayor que 0 (azul) es un mercado fuerte, cuando el histograma es menor que 0 (amarillo) es un mercado débil. Sólo se debe operar dentro de histogramas superiores a 0. Basado en el gráfico de
FREE
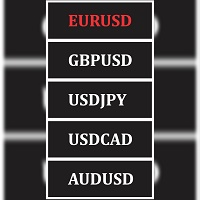
Cambie sin problemas entre diferentes pares desde una ventana, manteniendo su plantilla de gráfico actual en todos los pares. Estas herramientas simplemente obtienen todos los pares en su ventana de vigilancia del mercado y le conceden la facilidad de cambiar entre ellos desde una ventana, manteniendo su configuración de gráfico actual y todos los indicadores cargados y objetos de gráfico a través de todos los pares disponibles en su ventana de vigilancia del mercado.
FREE
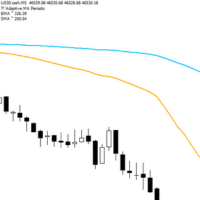
Adaptive Flow MAs es un indicador de media móvil diseñado para ajustarse de forma natural a los movimientos del mercado. A diferencia de las medias tradicionales, adapta dinámicamente sus periodos en función de la volatilidad reciente y la tendencia actual. La EMA sigue de cerca las rápidas oscilaciones de los precios para captar cada impulso, mientras que la SMA se mantiene más suave, proporcionando una referencia estable y fiable. Con una pantalla limpia que muestra los periodos adaptativos a
FREE
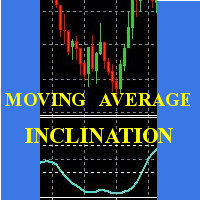
Scalp utilizando el comportamiento de una media móvil corta, el indicador da la pendiente e identifica los momentos "hiper".
Consejo operativo:
Utilizar gráfico M1 . Periodo 20 : abrir comprar después de dos mínimos crecientes; vender después de dos máximos decrecientes; evitar aperturas contra tendencia; cuando la línea se pone plana poner un stop en el precio de apertura. Evitar acciones en periodos de baja volatilidad. Cuando la curva que dibuja el min / max es muy plana, es mejor posponer
FREE
Cuadro de mandos dinámico para MT4 Este potente cuadro de mandos de MT4 ofrece a los operadores una visión completa del rendimiento actual e histórico de las operaciones en un formato intuitivo y visualmente organizado. Con su diseño de ingeniería de precisión, el panel proporciona una mezcla perfecta de información en tiempo real y análisis histórico. Este panel de control es perfecto para los operadores meticulosos que buscan una herramienta precisa y completa para gestionar las posiciones abi
FREE

Stat Monitor es un buen indicador de información.
Ventajas del indicador: El indicador proporciona información útil: el spread actual, el coste de un lote del símbolo, el apalancamiento comercial y el tamaño de lote recomendado para operar. Puede utilizar el indicador en la plataforma MetaTrader 4 de cualquier broker. El indicador proporciona información útil.
Versión del indicador Stat Monitor para MetaTrader 5 ¡Les deseo a todos buena suerte en el comercio y ganancias estables!
FREE
El indicador determina las zonas de sobrecompra/sobreventa en varios plazos. Las flechas muestran la tendencia del mercado en varias sesiones temporales: si el mercado sale de la zona de sobrecompra, la flecha indicará una tendencia ascendente (flecha hacia arriba), si el mercado sale de la zona de sobreventa, la flecha indicará una tendencia descendente (flecha hacia abajo). La situación en el marco temporal, donde se encuentra el indicador, se muestra en la ventana inferior derecha. En la vent
FREE

Sweeper PRO – Detector Avanzado de Barridos de Velas (3 en 1) Descripción General Sweeper PRO es un indicador potente y totalmente personalizable diseñado para detectar tres tipos únicos de barridos de velas — patrones inteligentes de entrada y reversión comúnmente utilizados por traders profesionales de acción del precio.
Identifica automáticamente posibles falsas rupturas, capturas de liquidez y señales de continuación , ayudándote a anticipar los giros del mercado y confirmar movimiento
Compruebe lo fácil y sencillo que es comprar un robot en la MetaTrader AppStore, la tienda de aplicaciones para la plataforma MetaTrader.
El Sistema de pago MQL5.community permite efectuar pagos con ayuda de PayPal, tarjeta bancaria y los sistemas de pago más populares. Además, le recomendamos encarecidamente testar el robot comercial antes de la compra, para así hacerse una idea más completa sobre él.
Está perdiendo oportunidades comerciales:
- Aplicaciones de trading gratuitas
- 8 000+ señales para copiar
- Noticias económicas para analizar los mercados financieros
Registro
Entrada
Si no tiene cuenta de usuario, regístrese
Para iniciar sesión y usar el sitio web MQL5.com es necesario permitir el uso de Сookies.
Por favor, active este ajuste en su navegador, de lo contrario, no podrá iniciar sesión.