Indicadores técnicos para MetaTrader 4 - 132

Presentamos ISIS SCALPER para MetaTrader 4: ¡Innovación más allá de lo tradicional! Descubra el futuro de las estrategias de trading con nuestro innovador indicador, cuidadosamente diseñado para trascender las limitaciones de los productos convencionales. No se trata de un indicador más, sino de una herramienta flexible y potente que permite a los operadores explorar todo el potencial del mercado. Características excepcionales : Versatilidad ilimitada: Diseñado para adaptarse a cualquier activo

ADX MA: La guía definitiva de la fuerza de la tendencia
En el mercado de divisas, el Índice Direccional Medio (ADX) es un indicador vital para medir la fuerza de la tendencia. He aquí un enfoque simplificado para el uso de ADX para el comercio eficaz:
1. 1. Añada el ADX a su gráfico de divisas. 2. Interprete los valores del ADX: <20 es débil, >40 es fuerte. 3. 3. Identifique la dirección de la tendencia: +DI por encima de -DI indica una tendencia alcista, y viceversa. 4. 4. Ejecutar operacion

este código publicado originalmente por LuxAlgo de otro lenguaje de programación.
Tiene capacidades aceptables de Predicción de Tendencia que pueden ser utilizadas para muchos propósitos comerciales. aquí hay alguna descripción del generador de código:
Este indicador se basa en los suavizadores de Nadaraya-Watson publicados anteriormente. Aquí hemos creado un indicador de envolvente basado en Kernel Smoothing con alertas integradas de cruces entre el precio y las extremidades de la envolvent

Level Breakout Indicator es un producto de análisis técnico que funciona desde los límites superior e inferior, que pueden determinar la dirección de la tendencia. Funciona en la vela 0 sin redibujados ni retrasos.
En su trabajo, utiliza un sistema de diferentes indicadores, cuyos parámetros ya han sido configurados y combinados en un solo parámetro: " Scale ", que realiza la gradación de períodos.
El indicador es fácil de usar, no requiere ningún cálculo, utilizando un único parámetro debe sele

Visión general Identificación automatizada de la estructura del mercado de dinero inteligente siguiendo el concepto de dinero inteligente y el concepto de operador del círculo interno, le da una ventaja sin precedentes en su análisis de dinero inteligente y estructura del mercado mediante la identificación automática de la estructura válida del mercado utilizando el concepto de dinero inteligente: Identificar movimientos impulsivos y correctivos Identificar retrocesos válidos creados por movimi

Indicador de señal de flecha para scalping Tiene tres niveles de sensibilidad
Detecta rápidamente los cambios en la dirección de los precios y proporciona señales para abrir posiciones Incorpora alertas sonoras y visuales sobre los cambios de tendencia. Puede enviar notificaciones a un smartphone o correo electrónico. Funciona en todos los marcos temporales, todos los pares de divisas, metales, índices y criptodivisas. Se puede utilizar cuando se trabaja con opciones binarias.
Características

El indicador de tendencia Dot on Histogram es una herramienta sencilla en el comercio de divisas. Cuando se utiliza junto con otros indicadores, puede ser muy gratificante.
El indicador consiste en un histograma azul y rojo, que representan territorios positivos y negativos, respectivamente. Las oportunidades de compra surgen cuando el histograma es positivo, mientras que las oportunidades de venta surgen cuando es negativo.
Pasos de la señal:
1. Punto en el nivel cero: - Punto Verde: Indica

MR BEAST INDICATOR ATR SUPLIED AND DEMAND ¡Descubre la herramienta definitiva para la toma de decisiones financieras con nuestro asesor experto! Diseñado para operar en la vanguardia de los mercados globales, este asesor se destaca por su capacidad única para analizar tendencias en tiempo real utilizando el indicador Average True Range (ATR) y el equilibrio de oferta y demanda. Al aprovechar el ATR, nuestro asesor experto evalúa la volatilidad actual del mercado, proporcionándote una visión clar
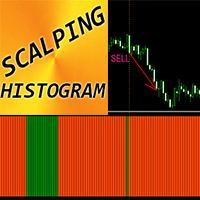
Indicador Crypto_Forex "Histograma de scalping" para MT4, sin repintado.
- El indicador de histograma de scalping se puede utilizar para buscar señales de entrada en la dirección principal del impulso de precios después de una pequeña corrección de precios. - El histograma de scalping puede tener 2 colores: naranja para el impulso bajista y verde para el alcista. - Una vez que vea al menos 10 barras de histograma consecutivas del mismo color, significa que se está produciendo un fuerte impulso

El indicador de opciones Binarias y Forex "Highway profits" se basa en el principio de encontrar el precio detrás de las líneas del canal. Después de que el precio salga del canal y gradualmente comience a volver a él, entonces aparecerán las señales. Operar con este indicador es muy fácil y conveniente. E incluso un comerciante principiante o un comerciante con muchos años de experiencia puede comerciar con ellos.
Para cada activo, debe seleccionar su configuración. Por ejemplo, el período de

Indicador de pivotes Los operadores han estado utilizando este indicador desde hace mucho tiempo, pero la principal diferencia o mejor podría llamarse mejora aplicada al conocido indicador de pivotes es que se puede cambiar la forma en que el pivote puede ser ilustrado. Hay dos maneras de obtener los pivotes en el gráfico. puede utilizar el número de velas o el movimiento del mercado utilizando puntos de retroceso. puede encontrar más información en el vídeo. además se pueden dibujar líneas de p
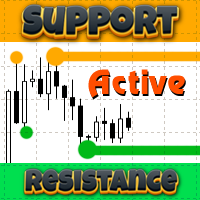
El indicador Support Resistance Active para MT4 identifica máximos y mínimos en varios marcos temporales, mostrando líneas de soporte y resistencia. En particular, los máximos y mínimos probados anteriormente se eliminan para evitar el desorden en el gráfico.
Este indicador se centra en los niveles semanales y diarios, denominados zonas de venta y zonas de compra. Traza líneas de soporte o resistencia (líneas fractales) para estas zonas. Las zonas probadas se conectan visualmente con una línea

up down stars indicator no es un indicador de repintado. se mantiene largo camino a las señales. apto para todos los pares y todos los timeframes. necesita al menos 1000 barras en los gráficos. 1 es el nivel critico para las señales. si la linea roja llega a 1 da estrella roja para vender... si linea azul llega a 1 da estrella azul para comprar.. las señales vienen mayormente a tiempo exacto. a veces los marcos de tiempo más bajos que hace señales consecutivas.

Presentación de las herramientas avanzadas de negociación de 2023. MTF PPAAF Modelo S. Esta es la versión sub ventana de mi mejor herramienta de trading : MTF Precise Price Action Arrow Filtered. Haga clic aquí para saber más sobre MTF PPAAF . Esta herramienta de comercio está equipado con varias características de gran alcance : MTF = Multi Time Frame = El marco de tiempo se puede cambiar. Botón de encendido/apagado. Flechas no repintables. Parámetros personalizables, color, etc. Puede mostrar

El indicador se traduce de otro lenguaje de programación a MQL. RTI es un poderoso peaje para identificar la tendencia de la tabla de una manera oscilación.
aquí algunas notas del programador original:
Visión general El Relative Trend Index (RTI) desarrollado por Zeiierman es una innovadora herramienta de análisis técnico diseñada para medir la fuerza y la dirección de la tendencia del mercado. A diferencia de algunos indicadores tradicionales, el RTI cuenta con una capacidad distintiva para

El IRDeS (Indicador de Detección de Distancia y Picos) es un indicador de fuerza y distancia desde el nivel cero que permite ingresar al mercado con un timing casi perfecto. Está compuesto por una línea continua de color azul que detecta la distancia y la volatilidad desde el nivel cero y un histograma, de color rojo sobre el nivel cero y verde bajo el nivel cero, que mide la intensidad y la fuerza de la contratación en una vela específica, generando un impulso fuerte, un "pico", en un punto esp

Este indicador presenta un enfoque alternativo para identificar la Estructura del Mercado. La lógica utilizada se deriva del material de aprendizaje creado por DaveTeaches (en X) Upgrade v1.10: add option to put protected high/low value to buffer (figure 11, 12)
Al cuantificar la Estructura de Mercado, es común utilizar los máximos y mínimos fractales para identificar pivotes de oscilación "significativos". Cuando el precio cierra a través de estos pivotes, podemos identificar un Cambio de Est

Proporciona señales instantáneas en el gráfico en forma de panel. Equipado con la descripción de la señal y herramientas de análisis de comercio, tales como el dibujo de líneas de tendencia de automóviles, el apoyo / zona de resistencia, canal de regresión, los niveles de Fibonacci, los niveles de pivote y el precio actual de la señal, el tiempo de la señal, la expiración de la señal y la recomendación stoploss. También el envío de mensajes de alerta a todos los disponibles mt4 herramienta de al
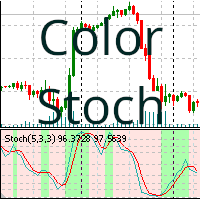
Oscilador Estocástico que según la tendencia del indicador se colorea el fondo.
Este indicador colorea el fondo según el valor que nos da el oscilador estocástico, según sea su tendencia a la compra o a la venta. El color del fondo se determina en función de los parámetros del oscilador estocástico, pintando únicamente las últimas 400 barras (ver notas).
Parámetros que puede modificar:
%K Period: El período de tiempo %K. %D Period: El período de tiempo %D. Slowing: El período de tiempo slowing
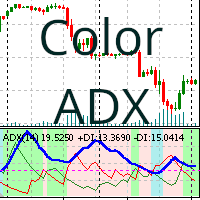
Indicador Average Directional Movement Index (ADX) que según sea la tendencia de compra o venta se colorea el fondo del mismo.
El indicador ADXColor es un indicador técnico que se utiliza para medir la fuerza de una tendencia. El color del fondo se determina en función de los parámetros de este indicador, pintando únicamente las últimas 400 barras (ver notas).
Parámetros que puede modificar:
Period: El período de tiempo del indicador ADX. Trend Level: El nivel mínimo a cumplir para filtrar s
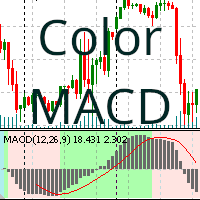
Indicador MACD con fondo de color según la tendencia de compra o venta.
Este indicador colorea el fondo según el valor que nos da el indicador MACD, o Moving Average Convergence Divergence, según sea su tendencia a la compra o a la venta. El color del fondo se determina en función de los parámetros del oscilador estocástico, pintando únicamente las últimas 400 barras (ver notas) y se se utiliza para medir la fuerza de una tendencia y la probabilidad de una reversión.
Los parámetros que puede

Este panel descubre y muestra las zonas de Oferta y Demanda en el gráfico, tanto en modo scalping como a largo plazo, dependiendo de su estrategia de trading para los símbolos seleccionados. Además, el modo de escáner del tablero le ayuda a comprobar todos los símbolos deseados de un vistazo y no perder ninguna posición adecuada / Versión MT5
Indicador gratuito: Basic Supply Demand
Características Le permite ver las oportunidades de negociación en múltiples pares de divisas , ofreciéndole u

Indicator Waiting Volatility - un indicador para determinar zonas de volatilidad y condiciones planas.
Con el tiempo, el precio en el gráfico tiene diferentes tendencias, baja, sube o permanece igual. El indicador ayuda al comerciante a determinar en qué tendencia se encuentra el precio.
En su trabajo utiliza varias herramientas de análisis técnico: primero se determina la dirección de la tendencia y luego, en esa dirección, el indicador monitorea los cambios en la volatilidad.
Si el precio fluc

Un excelente indicador de flecha con una precisión del 96%. Utiliza medias móviles de tendencia para detectar el cambio de dirección de la tendencia y alertar con la flecha correspondiente. No se vuelve a pintar y la alerta es opcional sobre la base de la barra actual o la barra anterior. Por favor, este indicador no es responsable de cada una de su posición comercial y debe ser utilizado en conjunción con otros indicadores para hacer el comercio.

تمكين الصفقات الخاصة بك مع مؤشر الأمل الجيد تحقيق التكامل لنقاط دخول قوية إذا كنت تبحث عن طريقة لتحسين تداولك في الفوركس، فإن مؤشر الأمل الجيد موجود هنا لإرشادك. يتميز هذا المؤشر بقدرته على الدمج الفعال لمختلف المؤشرات المعروفة، مما يؤدي إلى نقاط دخول قوية وتحليل شامل للسوق. ما الذي يميز الأمل الجيد؟ <أ ط=0>1. تكامل المؤشر: تتفوق شركة Esperanza Buena في استخدام مجموعة متنوعة من المؤشرات المعروفة ودمجها بشكل فعال، مما يوفر لك تحليلًا شاملاً للسوق. <أ ط=0>2. نقاط الدخول القوية: يعمل المؤشر على تو

(primero y original) MOLFAR - un nuevo algoritmo de indicador de rebote de precios .
NON-REPAINTING - it has appeared and will remain! NON-LAGGING - appears on time!
Realmente hemos trabajado en el algoritmo de este indicador durante mucho tiempo.
Es único, puede asegurarse de ello tanto en la versión gratuita en el probador y en la versión completa en su cuenta.
Description, settings and other interesting things about the MOLFAR indicator can be found here .
MOLFAR utiliza el análisis

Presentamos nuestro producto de vanguardia, un innovador Oscilador MACD con un nivel dinámico mejorado por una Media Móvil (MA) decimal también con la versatilidad de múltiples modos de media móvil. Esta avanzada herramienta de negociación aporta precisión y flexibilidad a su análisis técnico, ofreciendo una experiencia sin fisuras a los operadores que buscan una ventaja competitiva en los mercados financieros.
Características principales: Precisión de nivel dinámico Nuestro Oscilador MACD está
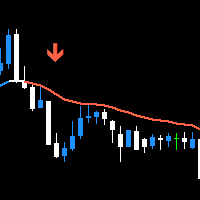
Trend Swift es el indicador de búsqueda de tendencia que puede estimar el volumen de tendencia para usted. Le ayuda a buscar el posible cambio de tendencia para que pueda entrar en el comercio con confianza. Debido a que es el indicador que puede operar con su decisión y realmente seguro de usar con cualquier Prop Firms sin preocuparse por la regla que no permite el uso de EA para el comercio. Este indicador no es el indicador normal que acaba de seguir ciegamente EMA, es el sistema de comercio
Simple pero eficaz indicador de mejora de la entrada que desea utilizar. Combínalo con otros indicadores y con tus estrategias de trading. Explora diferentes formas de usarlo y encuentra tu entrada perfecta.
Instrucciones básicas: Señal de compra Ejemplo: cambio de color de rojo a verde Ejemplo de señal de venta: cambio de color de verde a rojo
Consulte las capturas de pantalla a continuación para ver ejemplos de uso.

Indicador Marley: Trading Preciso en MT4 Eleva tu trading con el Indicador Marley, diseñado para una precisión excepcional de señales en MT4 y MT5. Esta herramienta versátil está optimizada para los mercados de criptomonedas y forex, ofreciendo precisión y flexibilidad en tu estrategia de trading. Integración Sin Problemas con MT5: Para los usuarios de la plataforma MT5, el Indicador Marley es totalmente compatible y accesible aquí. Optimizado para los Mercados de Criptomonedas y Forex: Excel

Indicador ALQANNAS (Francotirador) Visión general: Bienvenido a ALQANNAS, ¡su francotirador definitivo en el mercado de divisas! ALQANNAS es un indicador de trading potente y versátil diseñado para mejorar su experiencia de trading. Tanto si es un principiante como un trader experimentado, ALQANNAS le proporciona señales precisas sin repintado , dirección y fuerza de la tendencia y funciones avanzadas para elevar su estrategia de trading. Características principales: Señales de Compra y Venta: A
Indicador convertido de otra plataforma que fue codificado por LuxAlgo.
He añadido Moving Average tipo diferente también variedad de datos de origen. En la versión original la media móvil es SMA y la fuente de datos del mercado se reunió sólo desde el cierre de las velas.
En esta versión se puede seleccionar muchos tipos de medias móviles y también la fuente de datos como alta/baja/HL2/HLC/HLC2/.. .
aquí hay algunos detalles del desarrollador original:
El indicador Range Detector tiene com

Le presentamos el indicador Currency Smart Scalper , un indicador de tendencia de nueva generación diseñado específicamente para el par de divisas EURUSD y el intervalo de tiempo H1. Esta poderosa herramienta analiza automáticamente el mercado y proporciona señales para abrir y cerrar operaciones. Utilizando los indicadores Ichimoku, Parabolic SAR y Bollinger, Currency Smart Scalper proporciona una eficiencia inigualable al operar en el mercado de divisas. Obtenga más información sobre indicado
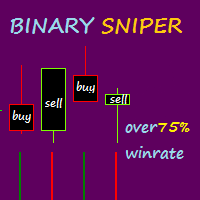
Binary Sniper es un indicador mt4 que proporciona señales de compra y venta para el comercio de opciones binarias. Este indicador tiene un enfoque diferente. Para el comercio de opciones binarias, este indicador no repinta ni retrasa la señal. REGLAS DE ENTRADA: 1. LLAMADA (COMPRAR), cuando una vela roja se cierra con una barra de francotirador binaria de color verde después de que era roja (primer cambio de color). 2. PONER (VENDER), cuando una vela verde se cierra con una barra de francotirad

Presentamos nuestro indicador avanzado, una herramienta innovadora para identificar zonas de soporte y resistencia con una precisión inigualable. Eleve su estrategia de negociación con una serie de características, incluyendo un sistema de doble color superior e inferior de la caja que permite un fácil reconocimiento visual de las tendencias del mercado.
Características principales: Recuadro de doble color para las zonas de soporte y resistencia Personalice su análisis con el recuadro de doble
Este indicador traza hasta 6 niveles que se pueden habilitar / deshabilitar para hacer que el gráfico sea más limpio según los requisitos del comerciante
Estos 6 niveles están en 2 conjuntos: alto y bajo
Para cada conjunto, se puede seleccionar un período de tiempo diferente
Se basa en la estrategia de reversión del Máximo Mínimo Anterior, ya que se considera que el precio generalmente muestra rechazo en un período de tiempo más pequeño, como 5 minutos, cuando el precio alcanza el Máximo Mín

Cobra Pivot Points es un indicador para trazar los puntos de pivote mejor optimizados que puede probar usted mismo descargando la DEMO.
1. Seleccione los dos mejores modos de pivote: Cobra Pivots o Camrilla Pivots
2. Puede utilizar cualquier período de tiempo no limitado a D1.
3. Puedes jugar con el valor de cierre alto bajo del día anterior con el parámetro Shift. 1 = Barra anterior, 2 = Barra antes de la barra anterior, etc. Estos parámetros le ayudarán en la investigación y el desarrollo d

Optimice sus decisiones de trading con nuestro indicador de fuerza y sentimiento del mercado y deje de operar contra tendencia! Diseñado meticulosamente para los operadores serios que valoran la información precisa y oportuna, nuestro indicador proporciona una vista de pájaro de los 28 pares principales de una manera muy sencilla. Esta herramienta es capaz de clasificar los pares de divisas basándose en términos de popularidad, fuerza de tendencia alcista o bajista y porcentaje de compradores y

Presentamos nuestro revolucionario indicador de negociación intradía, meticulosamente elaborado para optimizar sus conocimientos de negociación dentro del ciclo de mercado de 24 horas. Sumérjase en los datos históricos con precisión utilizando dos modos distintos: "Todo el historial" y "Últimas X horas".
Características principales: Modo "Todo el historial Descubra una visión completa de la dinámica del día. Analice instantáneamente el máximo y el mínimo del día anterior, el punto medio del 50%

El indicador de Dial "Cool volumes" se basa en los volúmenes de ticks en MT4.
El indicador en sí mismo rastrea en un cierto período de tiempo (selección del marco de tiempo) el número de volúmenes para comprar o vender. Y cuando hay un exceso anómalo en los volúmenes de vendedores o compradores, emite una señal para vender o comprar.
En la ventana inferior, se dibujan gráficos de barras de colores, donde el color verde muestra el predominio de los compradores en este momento, lo que significa

El Indicador de Análisis de Tendencias es una herramienta innovadora diseñada para operadores e inversores que buscan navegar por las complejidades de los mercados financieros con mayor precisión y perspicacia. Este potente indicador está diseñado para identificar hábilmente si un mercado está en tendencia o no, ofreciendo a los usuarios una ventaja vital en su estrategia de negociación. Características principales: Detección precisa de tendencias : La funcionalidad principal del Indicador de An
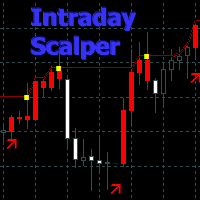
Un indicador de tendencia automático que utiliza un algoritmo para determinar señales de impulso para el especulación y el comercio intradiario.
El indicador de seguimiento de tendencias calcula automáticamente los posibles puntos de entrada y salida de las operaciones.
El indicador contiene una línea de tendencia y un canal objetivo para las siguientes señales, que cambia de color según la dirección.
Características principales
Velas y flechas de colores de señal: azul - dirección descendente

Presentamos nuestro innovador indicador diseñado para mejorar su estrategia de negociación. Desbloquee el poder del análisis preciso del volumen con indicadores de Compra, Venta y Neutral. Adapte su enfoque con niveles personalizables basados en marcos temporales y métodos de medias móviles.
Características principales: Análisis dinámico del volumen Identifique al instante los volúmenes de compra, venta y neutrales para tomar decisiones de negociación informadas. Obtenga claridad sobre el senti
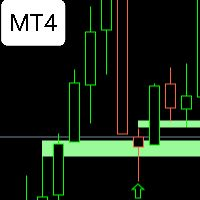
FVG WATCHER es un indicador que ayuda a los operadores a identificar los gaps de valor razonable en el mercado. El indicador dibuja brechas de valor razonable y alerta al usuario cuando la brecha de valor razonable ha sido barrida. Permite a los usuarios especificar cómo debe ser barrido, qué rango de tiempo alertar, y el tamaño de la brecha de valor justo para alertar. También permite al usuario aplicar un filtro de tendencia de media móvil para elegir mejor las alertas. El indicador también pe
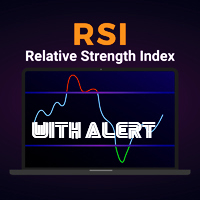
Indicador Universal RSI con Alertas de Oportunidad Este indicador para MetaTrader ha sido meticulosamente diseñado para adaptarse a todos los periodos de tiempo, proporcionando una herramienta versátil para los operadores de todos los niveles. Basado en el índice de fuerza relativa (RSI), este indicador destaca oportunidades potenciales en el mercado y te notifica de manera instantánea a través de alertas personalizadas. Características Principales: Universalidad de Periodos de Tiempo: Funciona
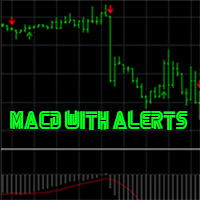
Indicador de Oportunidades MACD en Tiempo Real con Alertas de Precisión Descubre un indicador excepcionalmente preciso diseñado para potenciar tu experiencia de trading. Basado en el Moving Average Convergence Divergence (MACD), este indicador ofrece señales nítidas y oportunas, mejorando tu capacidad para identificar puntos de entrada y salida estratégicos. Además, este potente instrumento te mantendrá informado con alertas en tiempo real, proporcionándote una ventaja competitiva en los mercado
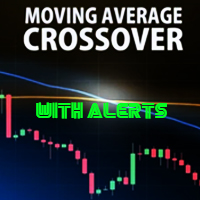
Descubre una nueva dimensión en el análisis técnico con CrossAlert MA, un poderoso indicador basado en cruces de medias móviles con funciones de alerta incorporadas. Diseñado para MetaTrader 4, CrossAlert MA utiliza la estrategia de cruce de medias móviles para identificar cambios significativos en la dirección del precio, proporcionando señales claras y oportunas. Características Principales: Cruces de Medias Móviles: CrossAlert MA aprovecha la potencia de los cruces de medias móviles para iden

PrecisionBands Descripción: Explora el mundo del trading con mayor precisión utilizando PrecisionBands, un indicador avanzado basado en las famosas Bandas de Bollinger. Diseñado para MetaTrader 4, PrecisionBands combina la versatilidad de las bandas de volatilidad con marcadores nítidos de señales de compra y venta, proporcionando una herramienta esencial para los traders que buscan tomar decisiones informadas. Características Principales: Bandas de Bollinger Mejoradas: PrecisionBands utiliza al

Mi indicador es 1000%, nunca repinta, funciona en todos los periodos de tiempo, solo hay 1 variable, envía notificaciones a tu teléfono incluso si estás de vacaciones en vez de en el trabajo, en una reunión, y también hay una versión robot de este indicador Con un solo indicador puedes deshacerte de la basura de indicadores Es especialmente adecuado para scalping en los marcos de tiempo m1 y m5 en el gráfico de oro, y puedes ver tendencias largas en el marco de tiempo h1.
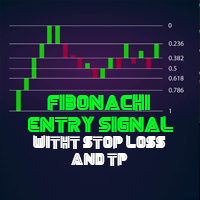
Indicador Trend and Fibonacci ProTrader Mr Beast El Indicador Fibonacci ProTrader v1.0 es una potente herramienta diseñada para optimizar tus estrategias de trading en MetaTrader, aprovechando la precisión y la lógica de la secuencia de Fibonacci. Este indicador incorpora señales avanzadas de take profit, tendencia take profit y stop loss, proporcionando una guía estratégica sólida para tus operaciones. Características Principales: Secuencia de Fibonacci Dinámica: El indicador traza automática

ndicador ADX Crossing Alertby Mr Beast El Indicador ADX Crossing Alert v1.0 es una herramienta avanzada diseñada para potenciar tu análisis técnico en MetaTrader, centrándose en las señales generadas por el cruce del Indicador de Dirección del Movimiento (ADX). Este indicador ofrece alertas visuales en el gráfico y la conveniencia de alertas via email, permitiéndote estar siempre al tanto de las oportunidades de trading. Características Destacadas: ADX Crossing Signals: El indicador utiliza el c

El indicador PUA MultiType Pivot se construye sobre el gráfico diario del día anterior. El indicador PUA MultiType Pivot es una de las herramientas más populares del análisis técnico, utilizada por los operadores para identificar posibles puntos de reversión en los mercados financieros. Este indicador construye tres tipos de puntos Pivot: Clásico, Fibonacci y Camarilla, cada uno de los cuales ofrece su enfoque único para el análisis del mercado. Las ventajas de este indicador incluyen Simplicid

Creado por imjesstwoone y mickey1984, este modelo de comercio intenta capturar la expansión de la vela de las 10:00-14:00 EST 4h utilizando sólo 3 sencillos pasos. Toda la información presentada en esta descripción ha sido esbozada por sus creadores, todo lo que hice fue traducirlo a MQL4. Todos los ajustes básicos del modelo de comercio puede ser editado para que los usuarios pueden probar varias variaciones, sin embargo, esta descripción cubrirá su defecto, el comportamiento previsto utilizan
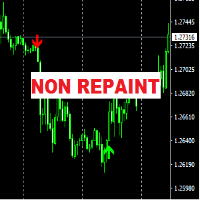
El indicador "FCK Trend Arrow No Repaint" está diseñado para analizar la dinámica del mercado y determinar posibles momentos de señales de trading. La característica principal de este indicador es la ausencia de repintado de señales, lo que contribuye a una previsión más precisa y fiable de los movimientos de precios en el mercado.
Mecanismo de funcionamiento: El indicador "FCK Trend Arrow No Repaint" utiliza varios tipos de elementos gráficos para indicar señales de trading: Flechas hacia arr
FxTDR es un indicador técnico hecho a medida para analizar los precios de los activos. El objetivo principal de este indicador es identificar puntos de entrada favorables para operar en pares de divisas seleccionados. Emplea un conjunto de criterios para detectar oportunidades óptimas de negociación dentro del marco temporal elegido.
Características principales: 1. Detección de puntos de entrada: Localiza las condiciones favorables para operar. 2. 2. Señales de flecha: Proporciona señales visu

#WinPlus Indicador de Tendencia y Entrada
Libere el poder de la precisión en sus operaciones con WinPlus, un indicador técnico a medida diseñado para activos financieros. Este indicador está meticulosamente diseñado para discernir tendencias y detectar oportunidades de entrada en una amplia gama de pares de divisas en el marco temporal h4. WinPlus analiza los movimientos de los precios y utiliza nuestros algoritmos avanzados para identificar tendencias. Cuando se detecta un punto de entrada óp
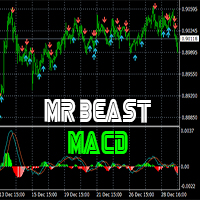
MR BEAST MACD Momentum Signals BUY SELL es una poderosa herramienta diseñada para optimizar las decisiones de trading al identificar oportunidades clave de compra y venta en los mercados financieros. Basado en el popular indicador MACD (Moving Average Convergence Divergence), este sistema utiliza algoritmos avanzados para generar señales precisas que reflejan cambios significativos en la dinámica del mercado. Características Destacadas: Señales de Compra y Venta Precisas: El Indicador MACD Mo

Indicador de Fuerza Direccional
El indicador técnico de Fuerza Direccional se basa en la idea de reunir un conjunto de elementos que pueden utilizarse para ayudar al operador a medir la fuerza relativa del movimiento de los precios y, al mismo tiempo, identificar y seguir la dirección de la tendencia.
El indicador consta de un oscilador lento (línea negra), un oscilador rápido (línea gris) y una línea mediana exponencial con valores reducidos que actúa como línea de señal (línea azul), identi

El indicador GGP SuperTrend MT4 es una herramienta de análisis técnico que puede ayudar a los inversores a identificar las tendencias del mercado. El indicador se basa en el ATR y es muy útil para captar la dirección del impulso de un activo y se emplea ampliamente cuando se analizan acciones, divisas y materias primas. Traza una línea en el gráfico de precios, que actúa como un nivel dinámico de soporte o resistencia, ayudando a los operadores e inversores a tomar decisiones informadas sobre l

"MR BEAST ELLIOT WAVES" para MetaTrader: Transforma tu Trading con Precisión y Generosidad El indicador "MR BEAST ELLIOT WAVES" para MetaTrader es una herramienta innovadora que combina la precisión de las ondas de Elliott con la filantropía de Mr. Beast. Diseñado para traders de todos los niveles, este indicador proporciona una visión clara de las oscilaciones del mercado, identificando patrones de manera efectiva. Características Principales: Ondas de Elliott Simplificadas: El indicador visual

El indicador "MR BEAST PATTERNS WITH ALERTS" es una herramienta avanzada diseñada para identificar y notificar automáticamente patrones de oportunidad en el mercado financiero. Basándose en una combinación de análisis técnico y algoritmos inteligentes, este indicador escanea constantemente el gráfico en busca de patrones específicos que podrían indicar momentos propicios para la toma de decisiones. Características Principales: Detección de Patrones: El indicador identifica patrones de oportunida

Indicador "Candlestick Alert Pro" para MetaTrader: Maximiza tu Trading con Alertas de Patrones de Velas El indicador "Candlestick Alert Pro" es una herramienta esencial para traders que desean potenciar su análisis técnico, identificando patrones de velas clave y recibiendo alertas estratégicas en tiempo real. Compatible con MetaTrader, este indicador proporciona una visión detallada de la acción del precio, permitiendo decisiones informadas y oportunas. Características Destacadas: Identificació

Asesor Experto "MR BEAST MIN MAX Price Extremes Master": Potencia tu Trading con Precisión en Mínimos y Máximos El asesor experto "Price Extremes Master" redefine la toma de decisiones en el trading al basarse en los precios mínimos y máximos del mercado. Este innovador asesor utiliza algoritmos avanzados para identificar oportunidades estratégicas en los puntos extremos de precios, permitiendo a los traders capitalizar las fluctuaciones del mercado de manera eficaz. Características Destacadas:
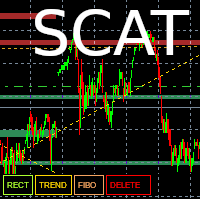
Esta herramienta permite dibujar líneas de tendencia, zonas de polaridad, soportes y resistencias, retrocesos de Fibonacci y guardarlos. El usuario dispone de 4 botones que se muestran en su configuración por defecto en la parte inferior izquierda de la ventana principal :
- Un botón "Nivel" que permite dibujar zonas de soporte y resistencia
- Un botón "Tendencia" que permite dibujar una línea de tendencia
- Un botón "Fibo" que permite mostrar un retroceso de Fibonacci
- Un botón "SUPR" que

Nombre del Indicador: SignalPro Serro Compra Venta Flechas Descripción: SignalPro Serro Comprar Vender Flechas es un indicador MQL4 potente y fácil de usar diseñado para mejorar su experiencia de trading proporcionando señales claras y precisas para las oportunidades de venta en el mercado. Desarrollado con precisión y fiabilidad en mente, este indicador es una herramienta valiosa tanto para traders principiantes como experimentados. Características principales: Flechas de Compra y Venta: El ind

Presentamos el Indicador de Oro Definitivo, meticulosamente diseñado para elevar su experiencia de trading en los marcos temporales de 5, 15 y 30 minutos. Este indicador de flecha de vanguardia es su clave para desbloquear señales precisas de compra y venta, guiándole sin esfuerzo a través del dinámico mundo del comercio de oro.
Características principales : - Marcos temporales versátiles: Adáptese a varios estilos de trading con señales adaptadas para 5 minutos, 15 minutos y 30 minutos, ofrec

Este Indicador no se repinta en absoluto, identifica una nueva TENDENCIA de raíz, este indicador examina la volatilidad, los volúmenes y el momento para identificar el momento en el que se produce una explosión de uno o varios de estos datos y por tanto el momento en el que los precios tienen fuertes probabilidades de seguir una nueva TENDENCIA.
CandleBarColorate nunca falla, siempre identifica una nueva TENDENCIA de raíz sin equivocarse. Este indicador facilita la lectura de los gráficos en ME
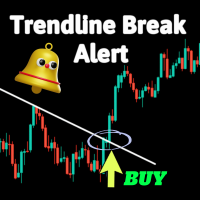
Este es un indicador simple que proporciona una alerta cuando se rompe una línea de tendencia.
Puede ser útil si estás acostumbrado a utilizar líneas de tendencia en tu trading. Los parámetros ajustables incluyen:
Identificador de vela: en qué vela dar la señal después de una ruptura Y tres tipos de alertas: Enviar correo electrónico Alertas audibles Notificaciones push Mira este video para aprender cómo configurar alertas de notificación en tu teléfono: https://www.youtube.com/watch?v=4oO-3f

Indicador todo en uno. Múltiples herramientas de análisis de mercado. Señales de Osciladores sin Repintado, Líneas de Tendencia, Canal de Precios, Niveles de Fibonacci, Soporte y Resistencia, Regresión, Niveles Pivote, Fuerza de Velas y Detector de Líneas de Sobreventa / Sobrecompra. Incluye botones para ocultar o mostrar. Algoritmos avanzados para detectar puntos de reversión importantes y dibujar líneas de tendencia o formas automáticamente en las áreas apropiadas. Una visualización de gráfico

ForexAnalysis Indicador que muestra toda una serie de información que el broker no me dice, es decir: volúmenes, swaps, es decir, lo que me gasto cada día en dejarlo abierto, luego ves el pivote con una sugerencia sobre la operación y el stop loss a adoptar. Vemos que con este nuevo indicador, cuando el precio se acerca a la línea cero de la operación, que se sugiere de forma automática, por lo general con las señales de Price Action en la pantalla, estamos en una ventaja porque en la barra inf
MetaTrader Market ofrece a todos los desarrollador de programas de trading una sencilla y cómoda plataforma para ponerlos a la venta.
Le ayudaremos con la presentación y explicaremos cómo preparar la descripción de su producto para el Market. Todos los programas que se venden a través del Market están protegidos por una codificación adicional y pueden ser iniciados sólo en el ordenador del comprador. La copia ilegal es imposible.
Está perdiendo oportunidades comerciales:
- Aplicaciones de trading gratuitas
- 8 000+ señales para copiar
- Noticias económicas para analizar los mercados financieros
Registro
Entrada
Si no tiene cuenta de usuario, regístrese
Para iniciar sesión y usar el sitio web MQL5.com es necesario permitir el uso de Сookies.
Por favor, active este ajuste en su navegador, de lo contrario, no podrá iniciar sesión.