Indicadores técnicos para MetaTrader 4 - 26

Este indicador se basa en las ideas del Sr. Dan Valcu.
Los cuerpos de las velas (apertura-cierre) son el principal componente utilizado para indicar y evaluar la dirección de la tendencia, la fuerza y las reversiones.
El indicador mide la diferencia entre el cierre y la apertura de Heikin Ashi .
La medición de la altura de los cuerpos de las velas conduce a valores extremos que apuntan a desaceleraciones de la tendencia. Por lo tanto cuantifica Heikin Ashi para obtener señales más tempranas.
FREE
El propósito de esta nueva versión del indicador estándar de MT4 proporcionado en su plataforma es mostrar en una sub-ventana múltiples marcos temporales del mismo indicador. Vea el ejemplo que se muestra en la imagen de abajo. Pero la visualización no es como un simple indicador MTF. Esta es la visualización real del indicador en su marco de tiempo. Aquí están las opciones disponibles en el indicador FFx: Seleccione los marcos de tiempo a mostrar (M1 a Mensual) Definir el ancho (número de barra
FREE
Simulador para la calculadora del ratio Riesgo / Recompensa We-RiskReward es un indicador MT4 hecho por el equipo de We-Trading para simular una orden con la calculadora de Riesgo / Recompensa.
Líneas Horizontales Este indicador te muestra 3 líneas horizontales que son: Línea de apertura Línea Take Profit Línea de Stop Loss Puedes mover las líneas y verás el cálculo de R/R y Lotes en tiempo real. Puede utilizarlo para simular posiciones Largas y Cortas.
Parámetros del indicador Como parámetros
FREE

RaysFX Información Comercial Hola a todos, me complace presentarles nuestro último indicador, RaysFX Trade Info. Esta herramienta está diseñada para proporcionar información detallada acerca de sus operaciones directamente en su gráfico MT4. Características principales Información en tiempo real : RaysFX Trade Info proporciona información en tiempo real sobre sus operaciones abiertas y cerradas. Puede ver el beneficio en puntos, divisa y porcentaje. Personalizable : El indicador es altamente per
FREE
BinaryPin es un indicador desarrollado y adaptado específicamente para el comercio de opciones binarias a corto plazo. El algoritmo del indicador, antes de emitir la señal, analiza muchos factores, como la volatilidad del mercado, busca el patrón PinBar, calcula la probabilidad de éxito al realizar una operación. El indicador se configura de la forma habitual. El indicador en sí consiste en una ventana de información donde se muestra el nombre del instrumento de negociación, la probabilidad de
FREE

El indicador está completamente basado en el indicador clásico MFI. I recommend watching my advisor - Night Zen EA
Contiene dos estrategias comerciales básicas: La salida de la línea IMF de las zonas de sobrecompra/sobreventa. La entrada de la línea IMF en las zonas de sobrecompra/sobreventa. Las flechas se dibujan después de confirmar la señal por las estrategias y no se vuelven a dibujar.
También se registran las alertas: Alertas Notificaciones push al terminal móvil correo electrónico Aj
FREE
Dé rienda suelta a un trading más inteligente con el generador de señales inteligentes ¿Cansado de hacer conjeturas en sus operaciones? El Generador de Señales Intelig entes es su nueva herramienta esencial, diseñada para simplificar su estrategia y darle una poderosa ventaja. No se trata de un indicador más, sino de un sistema diseñado para proporcionarle señales de entrada de alta probabilidad, ahorrándole tiempo y aumentando su confianza. Principales ventajas y características Generación inte
FREE

Existen muchos patrones de velas, pero sólo unos pocos merecen realmente la pena ser conocidos. Candlestick Pattern Filter detecta y marca los patrones de velas más fiables. Recuerde que estos patrones sólo son útiles cuando se entiende lo que está sucediendo en cada patrón. Deben combinarse con otras formas de análisis técnico para obtener mejores resultados. Estos patrones están incluidos: Martillo / Hombre Colgante Martillo invertido / Estrella fugaz Envolvente alcista / bajista Piercing Line
FREE

Precision Pulse: Indicador de seguimiento de tendencias de alta convicción Resumen del producto Precision Pulse es un avanzado indicador multifactorial de seguimiento de tendencias diseñado para proporcionar señales de negociación de alta probabilidad mediante la alineación rigurosa de la tendencia a largo plazo, el impulso a corto plazo y las condiciones de sobrecompra/sobreventa. Minimiza el ruido del mercado y las fluctuaciones al exigir que todos los componentes fundamentales converjan ante
FREE

Este indicador le permite medir el Beneficio/Pérdida de la operación actual, cerrada o futura en la divisa de la cuenta y estimar el nivel de margen en el punto de cierre de la operación. El indicador Profit/Loss se basa en el instrumento Crosshair nativo de MT4 y tiene las siguientes entradas: Dirección de la operación = Compra/Venta Tamaño del lote = 0.1 Tamaño de fuente = 8 Color de fuente = DeepSkyBlue Desplazamiento horizontal Desplazamiento vertical
FREE

Mejore su estrategia de acción de precios: rupturas de barras interiores al alcance de su mano
Este indicador detecta el interior de las barras de varios rangos, lo que hace que sea muy fácil para los operadores de acción de precios detectar y actuar sobre las rupturas de barras interiores. [ Guía de instalación Guía de actualización Solución de problemas Preguntas frecuentes Todos los productos] Fácil de usar y entender Selección de colores personalizable El indicador implementa alertas visuale
FREE

Este indicador mostrará los máximos y mínimos de ayer y hoy, muy útil para entender el sentimiento del mercado. Para operar dentro del rango / romper. El mínimo del día anterior puede actuar como soporte- puede usarse para retroceder o romper. El máximo del día anterior puede actuar como resistencia - puede usarse para retroceder o romper. La estrategia de ruptura de máximos y mínimos del día anterior se refiere a la técnica de negociación diaria que ofrece a los operadores múltiples oportunidad
FREE

BB-Sub – Bandas de Bollinger en ventana secundaria BB-Sub es un indicador simple pero potente que muestra las Bandas de Bollinger de forma independiente en una ventana secundaria del gráfico. A diferencia de las Bandas de Bollinger estándar, que se muestran en el gráfico principal, BB-Sub funciona en una subventana separada. Esto evita la superposición con las velas u otros indicadores, lo que es ideal para quienes desean concentrarse únicamente en el movimiento y la forma de las bandas. Caracte
FREE
Dominio de las señales: su ventaja en el mercado ¿Cansado de indicadores retrasados y oportunidades perdidas? Conozca Signal Mastery (Sistema EMA20-MACD) -el potente indicador sin repintado diseñado para ofrecer señales de trading de alta probabilidad justo cuando las necesita. Esto no es sólo otra herramienta MACD o EMA. Es un sistema de calidad profesional que combina de forma inteligente la EMA 20 y la lógica del MACD Crossover para señalar los puntos óptimos de entrada y salida. Lo mejor de
FREE

Stochastic RSI realiza un cálculo estocástico sobre el indicador RSI. El Índice de Fuerza Relativa (RSI) es un conocido oscilador de impulso que mide la velocidad y el cambio de los movimientos de los precios, desarrollado por J. Welles Wilder.
Características Encuentra situaciones de sobrecompra y sobreventa. Alerta sonora cuando se alcanza el nivel de sobrecompra/sobreventa. Recibe alertas por correo electrónico y/o notificaciones push cuando se detecta una señal. El indicador no repinta. Dev
FREE

El indicador My Big Bars puede mostrar barras (velas) de un marco temporal superior. Si abre un gráfico H1 (1 hora), el indicador pone debajo un gráfico de H4, D1 y así sucesivamente. Se pueden aplicar los siguientes marcos temporales superiores: M3, M5, M10, M15, M30, H1, H3, H4, H6, H8, H12, D1, W1 y MN. El indicador elige sólo los plazos superiores que son más altos que el plazo actual y son múltiplos de él. Si abre un gráfico M30 (30 minutos), los plazos superiores excluyen M5, M15 y M30. En
FREE
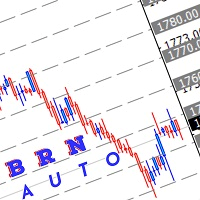
Utilice este indicador para trazar múltiples líneas horizontales hasta el número redondo más próximo. El rango para el número redondo se puede ajustar manualmente dependiendo de cómo el usuario quiera utilizarlo Selección de color también se puede ajustar manualmente Espero que este indicador puede ayudar a alguien en su comercio.
Como usarlo: Mayormente uso este indicador para romper, retest y entrada. Ejemplo precio actual XAUUSD :1740.00 lo que significa que los niveles mas cercanos son 1750
FREE
Como sabemos, МТ4 y МТ5 no almacenan el historial de ticks, que puede ser necesario para desarrollar estrategias comerciales y análisis de mercado. He desarrollado un método que le permite recibir el historial de ticks muy fácilmente. El indicador recoge el historial de ticks en tiempo real y lo escribe en el archivo XXXXXX2.hst, donde XXXXXX es un nombre de símbolo. Este archivo se puede utilizar para crear un gráfico fuera de línea o cualquier otra cosa. Si utiliza un robot de negociación, lan
FREE

Indicador Slope Channel para MetaTrader
¿Buscas una herramienta para analizar tendencias del mercado que se adapte a cualquier estilo de trading? Slope Channel – ¡Tu asistente confiable para identificar movimientos de precios y niveles clave del mercado! ¿Qué es Slope Channel? Slope Channel es un indicador innovador que construye un canal inclinado en el gráfico, calculando automáticamente sus parámetros basados en extremos locales. Esta herramienta destaca la opción óptima del canal, pe
FREE

APP System Signals es un indicador técnico diseñado para usuarios activos en los mercados financieros. Utiliza una combinación de medias móviles exponenciales (EMA), medias móviles simples (SMA) y análisis de tendencias para generar señales de compra y venta. Estas señales se basan en el comportamiento histórico de los precios y la estructura del mercado. Todos los parámetros del indicador son completamente personalizables, lo que permite a cada usuario adaptarlo según su propio enfoque y estilo
FREE

El indicador TwoMA Crosses muestra flechas en función de si la media móvil a corto plazo cruza por encima o por debajo de la media móvil a largo plazo. Una media móvil no predice la dirección del precio. En su lugar, define la dirección actual. A pesar de ello, los inversores utilizan las medias móviles para filtrar el ruido. Los operadores y los inversores tienden a utilizar el indicador EMA, especialmente en un mercado altamente volátil, ya que es más sensible a los cambios de precios que el
FREE

1. Propósito y datos del indicador Visión general El pronosticador de regresión lineal es un indicador analítico avanzado diseñado para realizar una evaluación exhaustiva de la tendencia y un pronóstico de precios a corto plazo utilizando el método estadístico de regresión lineal (LR) .
Está optimizado para el marco temporal semanal (W1) y combina tanto el análisis de tendencias a largo plazo como la dinámica de tendencias móviles a corto plazo para generar previsiones semanales fiables. El indi
FREE

Descripción del indicador Si necesitas conocer la volatilidad futura para operar, ¡este indicador es lo que necesitas! Con el Predictor del ATR su sistema de trading será más perfecto. Este indicador predice la volatilidad futura, y lo hace bastante bien. La precisión de la predicción es de hasta el 95% a una distancia de hasta 5 barras en el futuro (en el período H1). La precisión media de la predicción es de alrededor del 85%, el número de barras predichas está limitado sólo por su imaginación
FREE

Las tendencias son como el "Santo Grial de los traders": pueden darte una mayor tasa de ganancias, una mejor relación riesgo-recompensa, una gestión de posiciones más sencilla, etc...
Pero es realmente difícil determinar la tendencia con exactitud, evitando señales de fase, y con el momento adecuado, con el fin de tomar movimientos masivos. Por eso he creado el Validador de Tendencias: una nueva y FACIL herramienta que hará que la identificación de tendencias y la construcción de nuevas estrate
FREE

¿Qué es Macro Kill Boxer? Macro Kill Boxer es un indicador de análisis técnico desarrollado para la plataforma MetaTrader. Visualiza los movimientos del mercado durante intervalos de tiempo específicos (por ejemplo, Asia, London Open/Close, New York AM/PM) dibujando cuadros de colores en el gráfico. Cada recuadro representa los niveles de precios máximos y mínimos dentro del periodo de tiempo definido, a menudo asociados con acontecimientos macroeconómicos o sesiones de alta volatilidad. ¿Qué ha
FREE

Creé este indicador simple mientras aprendía sobre TheStrat de Rob Smith y lo encuentro tan útil que pensé en compartirlo con usted. Si lo encuentra útil, mire los otros indicadores que he publicado en MQL5. El indicador simplemente dibuja una sola línea en el gráfico que muestra el nivel de precio que selecciona de un marco de tiempo más alto. Con la configuración, tiene control total sobre el período de tiempo que muestra, pero de forma predeterminada, calcula el período de tiempo más alto,
FREE

Supreme Direction es un indicador basado en la volatilidad del mercado, el indicador dibuja un canal de dos lineas con 2 colores por encima y por debajo del precio, este indicador no repinta ni retropinta y la señal no se retrasa. como usarlo : largo por encima de la linea purpura , corto por debajo de la linea dorada. parametros : periodo del canal ========================================================
FREE
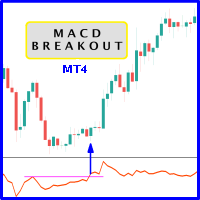
Surge la probabilidad de registrar precios más altos cuando MACD rompe el nivel de resistencia histórico del oscilador. Se recomienda encarecidamente confirmar la ruptura del precio con la ruptura del oscilador, ya que tienen efectos comparables a la ruptura de los niveles de soporte y resistencia del precio; seguramente, las operaciones cortas tendrán la misma percepción. Como ventaja, muchas veces la ruptura del oscilador precede a la ruptura del precio como una alerta temprana de un evento pr
FREE

Leonardo Breakout SMC - Indicador de Trading Avanzado
Visión general El Leonardo Breakout SMC es una obra maestra de precisión e innovación, creada para aquellos que buscan entender y aprovechar las fuerzas invisibles dentro del mercado. Al igual que Da Vinci observó el mundo natural con meticuloso detalle, este indicador de MetaTrader 4 (MT4) revela las estructuras ocultas del movimiento de los precios, permitiendo a los operadores captar la esencia de los conceptos del dinero inteligente (SM
FREE
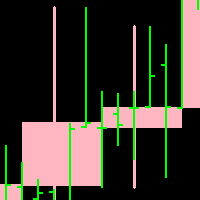
Candleline: indicador de línea de vela. Según el periodo especificado, dibuja la línea de vela del periodo especificado en el gráfico actual. Además, la nueva línea de vela se superpone a la línea de vela del gráfico actual.
Nota: el periodo del gráfico actual debe ser inferior al periodo de la línea de vela que se va a dibujar.
Para ver el efecto específico de la línea de vela autodibujada, consulte la imagen adjunta a continuación. Parámetro: 1.TimeFrame; 2. NumberOfBar; 3.Up línea de la ve
FREE

Indicador Killzone de Sesión
Indicador que le ayuda a identificar las horas killzone de las sesiones de Londres y NuevaYork que suelen ser las horas de mayor volatilidad y toma de liquidez del mercado. Las horas killzone son configurables a través de los parámetros del indicador. El indicador ajusta el rango de las killzones basándose en el rango de negociación diario.
FREE

El indicador busca los máximos y mínimos del mercado. Están definidos por fractales, es decir, el mercado crea el algoritmo y la estructura del indicador, a diferencia de ZigZag que tiene un algoritmo rígido que afecta al resultado final. Este indicador proporciona una visión diferente de las series de precios y detecta patrones que son difíciles de encontrar en los gráficos y marcos temporales estándar. El indicador no se repinta sino que funciona con un pequeño retraso. El primer nivel fractal
FREE

Investment Castle Indicator tiene las siguientes características: 1. Dicta la dirección de la tendencia en diferentes Timeframes . 2. Muestra la tasa de aciertos y la tasa de ganancias en el gráfico. 3. Este indicador no repinta el gráfico. 4. 4. Este indicador está incorporado en el Soporte y Resistencia basado en el Castillo de Inversión EA que trabaja con Niveles Clave Psicológicos "Soporte y Resistencia" Indicador.
FREE

Indicador de Posiciones de Entrada Promedio (The Average Entry Positions Indicator) El Indicador de Posiciones de Entrada Promedio proporciona a los traders una representación visual clara de sus precios promedio de entrada de compra y venta en el gráfico. Esta potente herramienta ahora calcula y muestra información crucial de gestión de operaciones, lo que facilita una mejor toma de decisiones y un seguimiento eficiente de las posiciones. Al utilizar esta herramienta, los traders pueden evaluar
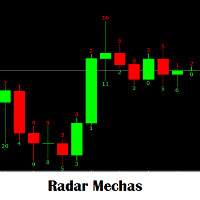
Indicador que sirve mirar el tamaño de la mecha que deja las velas segun el tamaño te genere alerta para hacer entradas manuales. Aprovechenlo al maximo que una plantea estrategia a vaces del tamaño de la mecha de la vela anterior o de la misma vela actual. para entran a comprar y vender. Es un indicador que es necesario para cualquier analisis que se tome para una entrada nueva. Sera su herramienta preferida.
FREE
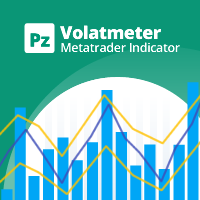
Este indicador mide la volatilidad en un marco temporal múltiple con el objetivo de identificar mercados planos, picos de volatilidad y ciclos de movimiento de precios en el mercado. [ Guía de instalación | Guía de actualización | Solución de problemas | FAQ | Todos los productos ] Opere cuando la volatilidad esté de su lado Identifique la volatilidad a corto plazo y los picos de precios Encuentre ciclos de volatilidad de un vistazo El indicador no se repinta Los ingredientes del indicador son l
FREE
¡Domine el mercado con el indicador Laguerre Edge Signal! ¡Deje de adivinar y empiece a operar con confianza! Nuestro indicador Laguerre Edge es la herramienta definitiva para detectar puntos de entrada de alta probabilidad. Este indicador combina la potencia de dos métodos de análisis clásicos: las medias móviles para la dirección de la tendencia y el RSI de Laguerre para detectar los retrocesos, todo ello filtrado por la sólida línea de tendencia EMA 200 . Está diseñado para ofrecerle señales
FREE
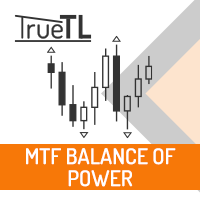
Indicador de equilibrio de poder (BOP) altamente configurable.
Funciones: Funciones de alerta altamente personalizables (en niveles, cruces, cambios de dirección vía email, push, sonido, popup) Capacidad de múltiples marcos temporales Personalización del color (en niveles, cruces, cambios de dirección) Opciones de interpolación lineal y modo de histograma Funciona en el probador de estrategias en modo multi timeframe (también en fin de semana sin ticks) Niveles ajustables Parámetros:
BOP Timefr
FREE

SPREADEX es un indicador para MT4 y MT5 que indica la distancia del ACTIVO al GP. El GP es el precio del valor real del ACTIVO subyacente obtenido por estimación. El GP es como un imán, atrae el precio del ACTIVO con alta probabilidad y dentro del mismo día de negociación. Así, SPREADEX indica qué activos están más alejados del GP en ese momento en tiempo real. Proporcionando un punto de vista al TRADER sobre qué activos centrarse y buscar posibles señales de reversión de precios para tener oper
FREE

El indicador dibuja canales de precios. Puede personalizarse para que sólo se muestren canales de compra o de venta. También se pueden mostrar líneas de tendencia en lugar de canales. Este indicador es fácil de usar, pero sin embargo, hay muchas estrategias de trading basadas en el trading de canales. Asesor basado en este indicador: https: //www.mql5.com/en/market/product/37952 Parámetros Historial - número máximo de barras para construir canales; Distancia - distancia mínima de un Máximo (o Mí
FREE
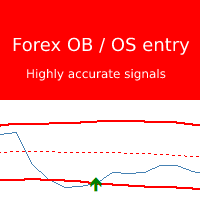
Forex sobrecompra / sobreventa indicador de entrada se basa en una estrategia muy potente que dan flechas de entrada muy precisa. ¡El indicador coloca flechas en "nueva vela" y NO repinta! Este indicador es un MUST HAVE si el comercio con una estrategia de inversión. Este indicador se puede combinar fácilmente con sus otros indicadores de comercio para confirmar retrocesos o fondos. Si alguna vez ha tenido problemas para encontrar entradas correctas, ¡este indicador es el mejor disponible para u
FREE

Como usted sabe, el precio siempre se mueve en un canal determinado y cuando el precio sale del canal, siempre tiende a volver al canal de negociación. El indicador Ind Channel Exit le ayudará a no perderse la salida del precio del canal. Puede mostrar una alerta o enviar un mensaje al terminal de su smartphone de que la siguiente barra ha cerrado por encima o por debajo de los niveles del canal Tiene un número mínimo de ajustes y el parámetro principal es el Multiplicador del Canal , que deter
FREE

Nivel Fractal CDS SR: Aumente la precisión de sus operaciones con niveles automáticos de soporte y resistencia basados en fractales El indicador CDS SR Fractal Level es una herramienta avanzada de trading diseñada por CDS para identificar y visualizar automáticamente niveles clave de Soporte y Resistencia (SR). Este indicador utiliza el concepto de fractales para presentar niveles SR relevantes para sus decisiones de trading. Características principales: Identificación automática de niveles frac
FREE
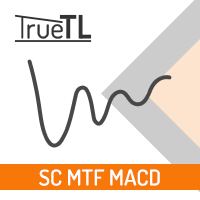
Indicador Macd altamente configurable.
Características: Funciones de alerta altamente personalizables (en niveles, cruces, cambios de dirección vía email, push, sonido, popup) Capacidad multi timeframe Personalización del color (en niveles, cruces, cambios de dirección) Opciones de interpolación lineal y modo de histograma Funciona en el probador de estrategias en modo multi timeframe (también en fin de semana sin ticks) Niveles ajustables Parámetros:
Macd Timeframe: puede establecer los plazo
FREE

Broker recomendado para utilizar el indicador: https://tinyurl.com/5ftaha7c Indicador desarrollado por Diogo Sawitzki Cansi para mostrar posibles puntos de comercio. No repinta. Los resultados mostrados en el pasado son exactamente lo que sucedió. También lo utilizamos para mantener las operaciones más tiempo y no salir en falsas señales de reversión que en realidad son sólo una toma de beneficios de las operaciones y nadie está tratando de invertir la dirección de la tendencia. Parámetros del I
FREE

Indicador Forex Target Zones - Domine los niveles clave de soporte y resistencia
Desbloquee el poder del trading preciso con el indicador Forex Target Zones, la herramienta definitiva para identificar zonas de compra y venta de alta probabilidad basadas en los máximos y mínimos semanales y diarios anteriores. Diseñado tanto para scalpers como para swing traders, este indicador destaca los niveles críticos en los que es probable que reaccione el precio, lo que le proporciona una ventaja competi
FREE

Indicador CCI Trend Finder con diferentes colores en los niveles 0, 100 y -100. La cruz es una señal de "Salida 123" presentada por MPlay y utilizada en el sistema CCI de Woodies. Esta señal de salida es efectiva especialmente en operaciones de ruptura a corto plazo, ya que evita la salida anticipada en pequeñas correcciones. Este indicador es ideal para tenerlo como una herramienta extra para su análisis.
FREE
Parabolic Sar easy mode, remake del indicador p.sar original haciendolo mas facil de leer para traders novatos y experimentados que buscan reducir el tiempo analizando los graficos, puedes hacer tu propia estrategia modificando los periodos y fusionandolo con otros indicadores como RSI ,estocastico o lo que quieras, este indicador funciona mejor en graficos de tiempo alto como H4 o D1.
FREE

Por favor, buena crítica sobre este indicador, y yo tal vez producir más indicadores, Próximamente, EA basado en estos indicadores
Linear Weighted Moving Average con HLCC precio aplicado, y las bandas de Bollinger con LWMA como precio aplicado. Interesante flecha de compra y venta basado en este indicador, no Lag indicador como flecha aparecerá 1 vela después de crossed...............
FREE

QuantumAlert CCI Navigator es un indicador gratuito disponible para plataformas MT4/MT5, su trabajo es proporcionar "alertas" cuando el mercado está dentro de las regiones de "sobrecompra y sobreventa" en forma de señales de "compra o venta". Este indicador viene con muchas opciones de personalización mencionadas en la sección de parámetros a continuación, el usuario puede personalizar estos parámetros según sea necesario. Únase a nuestro grupo MQL5 , donde compartimos noticias y actualizaciones
FREE

Este indicador dibuja divergencias alcistas y bajistas regulares en tiempo real en los gráficos. El algoritmo para detectar esas divergencias se basa en mis más de 10 años de experiencia detectando divergencias visualmente. Las divergencias se dibujan como rectángulos verdes y rojos en los gráficos. Usted puede incluso hacer pruebas a futuro en el modo visual del probador de estrategias. Esta versión GRATUITA está restringida a EURUSD y GBPUSD. La versión completa sin restricciones está aquí: ht
FREE

El indicador R Silver Trend es un indicador comercial de seguimiento de tendencias que muestra la tendencia actual directamente en el gráfico de actividad de Metatrader 4.
Dibuja dos tipos de velas: El azul es para la acción del precio alcista. Rojo para movimiento de precio bajista.
Operar con el indicador R Silver Trend es bastante fácil incluso para los principiantes absolutos y se puede utilizar para el scalping (M1, M5), el comercio diario (M5, M15, M30) y el comercio oscilante (H1, H4,
FREE

Descripción:
Este indicador (con su algoritmo) marca máximos y mínimos relativos, que tienen una serie de aplicaciones útiles.
Este indicador nunca se repintará.
Características:
Marca máximos y mínimos relativos Utilícelo para determinar los puntos de continuación de la tendencia, es decir, donde la tendencia puede retroceder antes de continuar al alza o a la baja, más allá de este punto. O utilícelo para determinar posibles puntos de cambio de tendencia, especialmente en mercados oscilant
FREE

FusionAlert StochRSI Master es un indicador disponible para las plataformas MT4/MT5, es una combinación del indicador RSI & Estocástico que proporciona "alertas" cuando el mercado está dentro de las regiones de "sobrecompra y sobreventa" combinadas para ambos indicadores, resulta en señales más precisas y exactas para ser usadas como una herramienta maravillosa, en forma de señales de "compra o venta". Este indicador viene con muchas opciones de personalización mencionadas en la sección de parám
FREE

Indicador de Flecha (Alertas de Compra/Venta) - ¡Una herramienta simple pero poderosa! Product Version: 1.01 Indicator Type: Trend Reversal Signals Timeframes Supported: All (Recommended: H1, H4, D1) Características principales: Buy Signal: Green upward arrow () appears below the candle Señal de Venta : Flecha roja descendente () aparece por encima de la vela. D etección precisa de reversión de tendencia : basada en la estrategia probada de
FREE
El indicador único IceFX VelocityMeter para la plataforma MetaTrader 4 mide la velocidad del mercado fórex. No se trata de un indicador corriente de volúmenes y otras magnitudes, ya que IceFX VelocityMeter es capaz de comprender la velocidad de los movimientos del mercado ocultos en los tics, y esto constituye una información valiosa que no está disponible en la velas comunes, por eso no puede ser obtenida por un indicador normal. Este indicador controla la llegada de los tics (frecuencia y magn
FREE

El objetivo de esta nueva versión del indicador MT4 estándar, incluido en el suministro de la plataforma, es mostrar en una subventana varios marcos temporales de un mismo indicador. Ver el ejemplo mostrado en la figura de más abajo. Sin embargo, el indicador no se representa como un indicador MTF simple. Es la representación real del indicador en su marco temporal. Ajustes disponibles en el indicador FFx: Elección del marco temporal a mostrar (desde M1 hasta MN) Ajuste de la anchura (cantidad d
FREE

SmartChanelFree es un indicador universal para todo tipo de mercados. Este indicador debe tener en su arsenal cada comerciante, ya que representa un enfoque clásico para analizar el precio de un instrumento de comercio y es una estrategia de negociación listo. El indicador forma el límite superior y medio del movimiento del precio. ¡¡¡Atención !!! Esta versión del indicador es de prueba y funciona sólo en el gráfico con el período M1. La versión completa del indicador se puede encontrar en: htt
FREE
Indicador de Bandas de Bollinger altamente configurable. Características: Funciones de alerta altamente personalizables (en niveles, cruces, cambios de dirección vía email, push, sonido, popup). Capacidad multi timeframe Personalización del color (en niveles, cruces, cambios de dirección) Opción de interpolación lineal Funciona en el probador de estrategias en modo multi timeframe (también en fin de semana sin ticks) Parámetros:
Bollinger Bands Timeframe: Puede establecer los marcos de tiempo i
FREE

El indicador Magic LWMA es de gran ayuda para determinar la dirección de la tendencia. Puede ser un excelente complemento para su estrategia actual o la base de una nueva. Los seres humanos podemos tomar mejores decisiones cuando vemos mejor visualmente. Por eso lo hemos diseñado para que muestre un color diferente para las tendencias alcistas y bajistas. Cada uno puede personalizarlo de la forma que más le convenga. Ajustando el Periodo de Tendencia, podemos optimizarlo para tendencias más lar
FREE

El indicador está especialmente diseñado para la utilidad de trading Trade Shell (incluido Trade Shell SMC ) para que funcione en el probador visual de estrategias.
Pruebe sus ideas de trading e indicadores. Ejecute Trade Shell en el probador visual y luego coloque este indicador en el gráfico. ¡Después de que usted será capaz de controlar todas las funciones de la Shell de Comercio, así como con el uso en vivo! ¡No funciona en vivo! Utilícelo sólo con el probador visual. No requiere ningún aju
FREE

Trend is Friends es un indicador de línea que se utiliza como herramienta auxiliar para su estrategia de negociación. El indicador analiza la desviación estándar de la barra de cierre de un período determinado y genera una tendencia de compra o venta si la desviación aumenta. Es bueno para combo con Martingale EA para seguir la tendencia y Sellect Buy Only/Sell Only para EA de trabajo Semi-Automático. Puede utilizar este indicador con cualquier EA en mis productos.
FREE
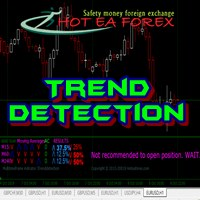
Reconocer las tendencias es una de las habilidades analíticas más importantes en el trading. No sólo los operadores técnicos, los que se inclinan fundamentalmente a hacer la tendencia de divisas como base de análisis para determinar el comercio de entrada. Sin embargo, aprender a mirar las tendencias de divisas no es tan simple como parece. Si desea precisión de la señal para estimar la dirección del próximo precio, entonces hay métodos avanzados en el aprendizaje de cómo mirar las tendencias de
FREE
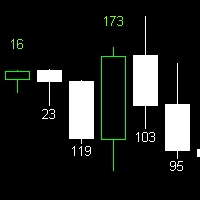
Indicador de Tamaño de Vela Descubre el tamaño de la vela con este indicador fácil de usar. Funciona en todos los marcos de tiempo, proporcionando información valiosa para tu análisis técnico. Características: Muestra el tamaño de la vela después de configurar el indicador. Compatible con todos los marcos de tiempo. El tamaño de la vela es una métrica importante en el análisis técnico, ya que puede indicar la fuerza y volatilidad del mercado. Con este indicador, puedes visualizar de manera clara
FREE

La versión gratuita del indicador Hi Low Last Day MT4 . El indicador Hi Low Levels Last Day MT4 muestra los máximos y mínimos del último día de negociación . Se puede cambiar el color de las líneas . Pruebe la versión completa del indicador Hi Low Last Day MT4 , en que características adicionales indicador están disponibles : Visualización del mínimo y máximo del segundo último día Visualización del mínimo y del máximo de la semana anterior Alerta sonora al cruzar los niveles máx . y mín . Selec
FREE

Desarrollado por Etienne Botes y Douglas Siepman, el indicador Vortex consta de dos osciladores que captan los movimientos de tendencia positivos y negativos. Para crear este indicador, Botes y Seipman se basaron en los trabajos de Welles Wilder y Viktor Schauberger, considerado el padre de la tecnología de implosión. A pesar de una fórmula bastante complicada, el indicador es bastante sencillo de entender y fácil de interpretar. Una señal alcista se activa cuando el indicador de tendencia posit
FREE

Ventajas: Basado en indicadores clásicos - ATR, Media Móvil Determina la tendencia / plano en el mercado coloreando el histograma con el color apropiado Las flechas indican señales confirmadas Es un excelente filtro para estrategias de canal (por extremos)
Ajustes :
Наименование Описание настройки Período del detector plano Número de barras / velas para el análisis Período de EMA Periodo de EMA (Media Móvil) Período de ATR Periodo de ATR (marco temporal actual) Coeficiente de desviación Coefic
FREE
Canal dinámico. El ancho del canal cambia automáticamente según el movimiento del precio. Cuanto más fuerte sea la desviación desde el medio del canal, más anchos serán los límites. El indicador se ajusta a los movimientos en la parte especificada por usted del gráfico (parámetro"Bars for calculations"). En consecuencia, si el precio ha hecho una fuerte fluctuación en un intervalo determinado, el canal se expandirá, esperando más fuertes fluctuaciones. Es decir, sus parámetros siempre correspond
FREE
Deje de adivinar, empiece a confirmar: Presentamos Signal Sentinel ¿Está cansado de las señales que le dejan colgado? El indicador Signal Sentinel es su arma definitiva contra la incertidumbre del mercado, diseñado para ofrecer configuraciones de negociación de alta probabilidad directamente en su gráfico. Hemos combinado el poder de dos MACD con un filtro EMA a largo plazo para asegurarnos de que sólo opere en las tendencias más fuertes y confirmadas. No se trata de un indicador más, sino de u
FREE

T-Explorer es una herramienta optimizada para MetaTrader 4 en tiempo real que proporciona información negociable basada en los 10 indicadores técnicos más populares y fiables en muchos marcos temporales. Nuestros modelos de aprendizaje automático calculan las reglas y la configuración óptimas para cada indicador con el fin de proporcionar señales de alta probabilidad de éxito. Los usuarios pueden personalizar T-Explorer seleccionando los plazos y el modo (RÁPIDO, MEDIO, LENTO ) adecuados para lo
FREE
El Mercado MetaTrader es una plataforma única y sin análogos en la venta de robots e indicadores técnicos para traders.
Las instrucciones de usuario MQL5.community le darán información sobre otras posibilidades que están al alcance de los traders sólo en nuestro caso: como la copia de señales comerciales, el encargo de programas para freelance, cuentas y cálculos automáticos a través del sistema de pago, el alquiler de la potencia de cálculo de la MQL5 Cloud Network.
Está perdiendo oportunidades comerciales:
- Aplicaciones de trading gratuitas
- 8 000+ señales para copiar
- Noticias económicas para analizar los mercados financieros
Registro
Entrada
Si no tiene cuenta de usuario, regístrese
Para iniciar sesión y usar el sitio web MQL5.com es necesario permitir el uso de Сookies.
Por favor, active este ajuste en su navegador, de lo contrario, no podrá iniciar sesión.