Indicadores técnicos para MetaTrader 4 - 22

Los canales de Donchian son una herramienta del análisis técnico utilizada para determinar la volatilidad relativa de un mercado y el potencial de ruptura de los precios.
Pueden ayudar a identificar posibles rupturas y retrocesos de los precios, que son los momentos en los que los operadores están llamados a tomar decisiones estratégicas. Estas estrategias pueden ayudarle a sacar partido de las tendencias de los precios, al tiempo que dispone de puntos de entrada y salida predefinidos para asegu
FREE

Este indicador calcula la Correlación entre pares de divisas (Seleccionados por el usuario) para encontrar los símbolos menos y/o más correlacionados en tiempo real. La correlación oscila entre -100% y +100%, donde -100% representa divisas que se mueven en direcciones opuestas (correlación negativa) y +100% representa divisas que se mueven en la misma dirección.
Nota La Correlación más de 80 (Ajustable) entre dos pares de divisas, Muestra que son bastante similares en el tipo de movimiento y la

QuantumAlert CCI Navigator es un indicador gratuito disponible para plataformas MT4/MT5, su trabajo es proporcionar "alertas" cuando el mercado está dentro de las regiones de "sobrecompra y sobreventa" en forma de señales de "compra o venta". Este indicador viene con muchas opciones de personalización mencionadas en la sección de parámetros a continuación, el usuario puede personalizar estos parámetros según sea necesario. Únase a nuestro grupo MQL5 , donde compartimos noticias y actualizaciones
FREE

Indicador avanzado Renko y Punto y Figura con análisis de patrones de ganancias y pérdidas Este potente indicador combina dos estrategias probadas -Renko y Punto y Figura (P&F)- en una herramienta integral para la identificación de tendencias, el reconocimiento de patrones y la gestión de riesgos. Con el cálculo dinámico del tamaño de caja (fijo o basado en ATR), los filtros de medias móviles y la detección de patrones de ganancias/pérdidas, los operadores pueden tomar decisiones más inteligente
FREE

El objetivo de esta nueva versión del indicador estándar MT4 que entra en la entrega de la plataforma consiste en mostrar en la subventana varios períodos de tiempo del mismo indicador. Véase la imagen que se muestra más abajo. Sin embargo, su visualización no es como de un simple indicador MTF. Es la visualización real del indicador en su período de tiempo. A continuación, puede ver los ajustes disponibles en el indicador FFx: Selección del período de tiempo para la visualización (de M1 a MN) D
FREE

¡¡¡NOTA!!! ¡¡¡El voto de tendencia y la opción de compra venta deben coincidir con la misma dirección antes de poner un comercio!!!
Indicador que utiliza filtros de Kalman (los mismos que se utilizan en los vehículos autónomos para la fusión de datos entre diferentes sensores / tecnologías como RADAR, LIDAR y Cámara con Inteligencia Artificial para la detección de objetos) utilizando el precio alto y bajo con el fin de identificar las señales de compra y venta como se indica en el gráfico.
Est
FREE
Los que han seguido mi hilo FCK Quantum S calping conocen el indicador FCK Quantum Scalping y han llevado el indicador a diferentes niveles (Mastermind) para adaptarlo a su estilo de trading. En este sistema, el indicador Quantum sólo sirve para mostrarnos entradas de trading, y ya está. Los objetivos y niveles de stop son un poco posteriores. Para los que no sepan qué es el indicador FCK Quantum Scalping , os lo cuento. El indicador FCK Quantum S calping es básicamente un indicador de Onda mo
FREE

Mahdad Candle Timer MT4 - Cuenta atrás de velas en tiempo real Mahdad Candle Timer es un indicador ligero y preciso para MetaTrader 4 que muestra el tiempo restante hasta el cierre de la vela actual, directamente al lado de la última barra. Está diseñado para los comerciantes que dependen de la sincronización exacta - ya sea scalping, day trading, o esperando la confirmación de la vela en las configuraciones de swing. Características principales Cuenta atrás precisa - Tiempo restante en HH:MM:S
FREE

Un trader profesional es un trader codicioso: compra en mínimos y vende en máximos con riesgos mínimos y altos retornos,,
Pips Slayer está desarrollado exactamente para tal enfoque de trading . Es un indicador universal para el seguimiento de reversiones y utiliza patrones de acción de precios, discrepancia de indicadores personalizados y una fórmula de múltiples capas para identificar estructuras de reversión. El indicador es muy fácil de usar; sólo muestra flechas donde se recomienda comprar
FREE

GalaxyReversalPro - Indicador de señal de tendencia
GalaxyReversalPro es un indicador de tendencia basado en señales diseñado para operadores que valoran la simplicidad, la precisión y la fiabilidad.
Es extremadamente fácil de usar y no requiere configuración adicional.
La herramienta le ayuda a entrar en nuevas tendencias pronto y a salir antes de que comiencen las correcciones: máxima precisión con un riesgo mínimo: El algoritmo se basa en un análisis de impulsos estructurales: sigue los má
FREE

Destaca las sesiones de negociación en el gráfico
¡¡¡La versión demo sólo funciona en el gráfico AUDNZD !!! La versión completa del producto está disponible en: (*** por añadir ***)
El Indicador de Sesiones de Negociación muestra los inicios y finales de cuatro sesiones de negociación: Pacífico, Asiático, Europeo y Americano. la posibilidad de personalizar el inicio/fin de las sesiones; la posibilidad de mostrar sólo las sesiones seleccionadas; funciona en los marcos temporales M1-H2;
Se pue
FREE
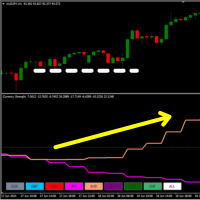
28 mercados en un solo indicador Tiene 8 Líneas y cada una representa una divisa { EUR - USD - GBP - JPY - AUD - NZD - CAD - CHF } .
¿Qué hace? Calcula un oscilador personalizado en los 28 Pares de Divisas y le muestra la Fuerza de cada divisa. De esta manera puedes analizar la Tendencia y la Volatilidad en un Par Multidivisa. También haciendo clic en dos monedas diferentes cambia instantáneamente el mercado.
¿Cómo usarlo? Puede utilizar este indicador para encontrar verdaderas contracciones
FREE

Características:
- TF actual GMMA Cruz y Tendencia (Comprobación obligatoria.. G-Up/G-Down) - Comprobación de la tendencia HTF GMMA (flecha oblicua opcional) - TDI o NRTR Trend Check (Opcional.. diamante)
Leer post para descripción detallada y descarga de indicadores extra: https://www.mql5.com/en/blogs/post/758264
Escáner:
Este es un escaner para encontrar buenas operaciones usando el metodo GMMA como base y el metodo TDI para la verificacion de la tendencia. Todos los botones para todos los

** Todos los Símbolos x Todos los Plazos escanean con sólo presionar el botón del escáner . *** Ponte en contacto conmigo para enviarte las instrucciones y añadirte al "grupo de escáneres ABCD" para compartir o ver experiencias con otros usuarios. Introducción Este indicador escanea patrones de retroceso AB=CD en todos los gráficos. El ABCD es el fundamento básico de todos los patrones armónicos y altamente repetitivo con una alta tasa de éxito . El indicador ABCD Scanner es un patrón ABCD de r

Libere su potencial de negociación con la Cruz Fractal Dorada ¿Está cansado de cuestionar sus operaciones? ¿Desearía tener un sistema claro y fiable para guiar sus decisiones? Le presentamos la Cruz Fractal Dorada , un indicador potente y fácil de usar diseñado para ayudarle a detectar oportunidades de inversión de alta probabilidad. No se trata de otro indicador de medias, sino de una estrategia completa que combina la precisión de los patrones fractales con el poder dinámico de las medias móvi
FREE

Este indicador mide el 1º Canal de Referencia y la 1ª Zona Neutra. * configurar el canal macro para comprobar la frecuencia MAYOR H1 H4 1D * configurar el canal micro para comprobar la frecuencia MENOR 1M 5M 15M Cómo instalar el indicador fimathe. Y pre-mentoring Hay una estrategia secreta extra en este video. Mira el video para entender la lógica de cómo empezar con este indicador.
https://www.youtube.com/playlist?list=PLxg54MWVGlJzzKuaEntFbyI4ospQi3Kw2
FREE

Este indicador muestra el tiempo restante de la vela. El tiempo restante de la vela se calcula cada 200 milisegundos. 1. Puede establecer x (horizontal), y (vertical) del texto. 2. Puede establecer fuente, color, tamaño del texto. 3. 3. Puede eliminar el texto sin tener que eliminar el indicador del gráfico. El tiempo restante de la vela depende del marco temporal del gráfico con el indicador.
FREE

IceFX Heatmap es un indicador especial que muestra los lugares donde el precio ha permanecido y oscilado durante los últimos días. Estos lugares se mostrarán en un "estilo Heatmap", con el que podrá ver claramente las principales bandas formadas. Los principales índices (donde el precio se ha "demorado/quedado" mucho) se indican en colores brillantes (en caso de vista en blanco y negro) o en color rojo (en caso de vista en color).
Ajustes Días - número de días para los que se calcula el calor(m
FREE

Fractals ST Patterns es una modificación del indicador Fractals de Bill Williams. A diferencia de un indicador Fractals estándar, Fractals ST Patterns permite establecer cualquier número de barras para encontrar un fractal. Este sencillo indicador corresponde a los parámetros especificados en la estrategia ST Patterns (https://stpatterns.com/) . Los Patrones Estructurales ST son el propio mercado, que se divide sistemáticamente en componentes. Para la formación de los Patrones ST no se necesitan
FREE

El indicador utiliza el método de cálculo del canal de Chester W. Keltner, modificado por la conocida trader Linda Raschke. Debido a la modificación, el canal calculado contiene una visión mucho más completa de los movimientos de precios, lo que permite aumentar la probabilidad de una predicción precisa del próximo movimiento de precios. A diferencia del método clásico de Keltner, la línea base del canal se traza basándose en la Media Móvil Exponencial, y para calcular las líneas superior e infe
FREE

¿Qué es un Punto de Interés? Los operadores que siguen los Conceptos del Dinero Inteligente pueden llamar a esto un Punto de Liquidez, o donde las áreas de liquidez han sido construidas por los operadores minoristas para que los Grandes Bancos se dirijan a crear grandes movimientos de precios en el mercado. Como todos sabemos, los traders minoristas que utilizan métodos anticuados y poco fiables de trading como el uso de líneas de tendencia, soporte y resistencia, RSI, MACD, y muchos otros para

Los gráficos Renko con filtro Heiken Ashi ahora tienen las alertas y el Win-rate . Ahora puedes saber qué señal te dará esa ventaja que tu trading necesita. Ajustes de Riesgo a Recompensa Conteo de Ganancias versus Pérdidas Hay cuatro tipos de alertas a elegir para notificación en pantalla, correo electrónico o notificación telefónica. Los tipos de alerta también tienen topes para su uso con la automatización. Este indicador puede ser incorporado con cualquier sistema que requiera gráficos renko

El indicador busca y muestra velas Doji en el gráfico y señala la aparición de una vela de este tipo. La dirección de la señal depende de la dirección de las velas anteriores, ya que el Doji señala una inversión o corrección. Además de la posibilidad de señalización, la potencia de la inversión se muestra gráficamente (cuanto más verde, más probable es el crecimiento, cuanto más rojo, el precio caerá). En los ajustes del indicador, puede cambiar los parámetros de la vela Doji, cuyo cierre será u
FREE

Un indicador de tendencia que muestra la fuerza de los alcistas y bajistas en un rango de cotización.
Consta de dos líneas:
La línea verde es una condición equilibrada de sobrecompra/sobreventa. La línea roja es la dirección de la actividad comercial. No vuelve a dibujar los cálculos.
Se puede utilizar en todos los Símbolos/Instrumentos/Marcos de tiempo.
Fácil de usar y configurar.
Cómo utilizar el indicador y qué determina.
La regla básica es seguir la dirección de la línea roja:
si cruza l
FREE
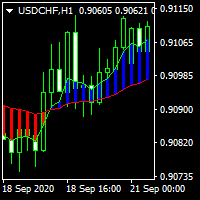
............................................hi................................................ .........................es un simple indicador de medias móviles ............................
.........................una muestra diferente de medias móviles.......................... ...............puede seleccionar el periodo, el desplazamiento, el modo y el precio aplicado.................. ............muchos operadores utilizan las medias móviles para encontrar el movimiento del mercado..........
FREE

Indicador Killzone de Sesión
Indicador que le ayuda a identificar las horas killzone de las sesiones de Londres y NuevaYork que suelen ser las horas de mayor volatilidad y toma de liquidez del mercado. Las horas killzone son configurables a través de los parámetros del indicador. El indicador ajusta el rango de las killzones basándose en el rango de negociación diario.
FREE
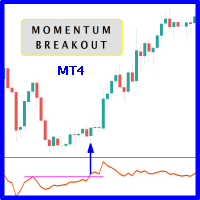
Cuando los niveles de resistencia de ruptura de precios se combinan con el oscilador de impulso que rompe sus niveles de resistencia históricos, entonces surge la probabilidad de registrar precios más lejanos. Se recomienda encarecidamente confirmar la ruptura del precio con la ruptura del oscilador, ya que tienen efectos comparables a la ruptura de los niveles de soporte y resistencia del precio; seguramente, las operaciones cortas tendrán la misma percepción. El concepto se basa en encontrar l
FREE

Este indicador escanea para usted hasta 30 instrumentos de negociación y hasta 8 marcos temporales en busca de patrones de inversión de alta probabilidad: Dobles Tops/Bottoms con falsas rupturas . Por favor, lea también la entrada del blog "Operativa Profesional con Dobles Máximos/Bajos y Divergencias " que explica los conceptos detrás del indicador ULTIMO de Dobles Máximos/Bajos y cómo puede utilizar un enfoque profesional descendente. Esta versión GRATUITA del escáner escanea sólo EURUSD y GBP
FREE

Indicador fractal multi timeframe que muestra el punto fractal del timeframe superior en los timeframes inferiores.
Parámetros Fractal_Timeframe : Puede establecer los timeframes superiores para los fractales. Maxbar : Puede establecer el número máximo de velas para los cálculos. Up_Fractal_Color, Up_Fractal_Symbol, Down_Fractal_Color, Down_Fractal_Symbol : Ajustes de color y estilo de los puntos fractales. Extender_línea : Dibuja una línea horizontal desde el punto fractal anterior hasta que u
FREE

Al igual que la media móvil exponencial (EMA), es más reactiva a todas las fluctuaciones de precios que una media móvil simple (SMA), por lo que la DEMA puede ayudar a los operadores a detectar antes los retrocesos, ya que responde con mayor rapidez a cualquier cambio en la actividad del mercado. La DEMA fue desarrollada por Patrick Mulloy en un intento de reducir el retardo de las MA tradicionales. ( TASC_Feb. 1994 ). La DEMA también se puede utilizar como componente en muchos indicadores, com
FREE

El indicador se basa en el concepto de canales de precios, que se forman trazando los precios máximos más altos y los precios mínimos más bajos durante un periodo de tiempo determinado. El indicador de canal de Donchian consta de tres líneas: una línea de canal superior, una línea de canal inferior y una línea de canal medio. La línea del canal superior representa el máximo más alto durante un periodo determinado, mientras que la línea del canal inferior representa el mínimo más bajo. La línea d
FREE

La aplicación del sistema de impulso descrito por el Dr. Alexander Elder. El indicador genera señales de acuerdo con el siguiente patrón: Media móvil e histograma MACD aumentan - barra verde, está prohibido vender; Media móvil e histograma MACD tienen direcciones diferentes - barra gris (o vacía), se elimina la prohibición; La media móvil y el histograma MACD disminuyen - barra roja, está prohibido comprar.
Parámetros del indicador EMA - período de la media móvil del indicador MACD Rápido - per
FREE

El Oscilador Andino MP se utiliza para estimar la dirección y también el grado de variación de las tendencias. Contiene 3 componentes: Componente alcista, componente bajista y componente de señal. Un componente alcista ascendente indica que el mercado está en tendencia alcista, mientras que un componente bajista ascendente indica la presencia de un mercado en tendencia bajista. Ajustes: Periodo del oscilador: Especifica la importancia de las tendencias grado de variaciones medidas por el indica
FREE

Operar con la ayuda del indicador MACD es ahora aún más cómodo. Los ajustes flexibles le ayudarán a elegir lo que realmente necesita en sus operaciones. Utilice la estrategia que necesite - el indicador utiliza 3 estrategias. ¡Descargue la demo ahora mismo! Recomiendo ver mi asesor - Night Zen EA Suscríbete a mi canal de telegram, enlace en mi perfil de contactos - mi perfil Ver también mis otros productos en mql5.com - mis productos Ventajas del indicador: En este indicador, la interpretación d
FREE
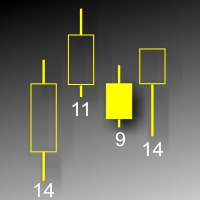
Este indicador muestra el volumen de cada barra (diapasón visible) en puntos. Es posible ajustar los parámetros de muestra. El indicador se creó para el uso personal, el análisis de gráficos. Parámetros: ColorL - color de las marcas textuales. Position - posición de las marcas: 0 - abajo, 1 - arriba. FontSize - tamaño de la fuente. ANGLE - ángulo de inclinación del texto.
FREE

El objetivo de esta nueva versión del indicador MT4 estándar, incluido en el suministro de la plataforma, es mostrar en una subventana varios marcos temporales de un mismo indicador. Ver el ejemplo mostrado en la figura de más abajo. Sin embargo, el indicador no se representa como un indicador MTF simple. Es la representación real del indicador en su marco temporal. Ajustes disponibles en el indicador FFx: Elección del marco temporal a mostrar (desde M1 hasta MN) Ajuste de la anchura (cantidad d
FREE

Necesario para los operadores: herramientas e indicadores Ondas calcular automáticamente los indicadores, el comercio de tendencia del canal Perfecta tendencia de onda de cálculo automático de cálculo de canales , MT4 Perfecta tendencia de onda de cálculo automático de cálculo de canales , MT5 Copia local de trading Copia fácil y rápida , MT4 Copia fácil y rápida , MT5 Copia Local Trading Para DEMO Copia fácil y rápida , MT4 DEMO Copia Fácil y Rápida , MT5 DEMO Fibo: de KTrade 1. Calcular y ana
FREE
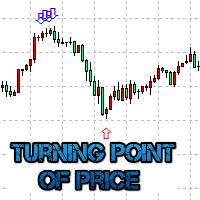
Indicador de Turning point of price de la gráfica el precio estimado del punto de pivote. Dibuja flechas. Utiliza datos de la Prise Reversal oscilador y el indicador ADX. Si el valor del indicador Prise Reversal está sobrecomprado o sobrevendido (propio usuario define el tamaño de la zona), y el valor de la línea principal ADX dado más tiempo, Turning point of price se basa en la Carta de la flecha. Esta idea se describe en el artículo " El indicador de reversión de precios ." Parámetro

Ultimate Market Master Trend Domina la dirección del mercado con precisión El indicador Ultimate Market Master Trend es un analizador integral del sentimiento del mercado, diseñado para traders que buscan claridad, precisión y confianza en cada operación.
Combina una detección inteligente de tendencias , un estocástico multitemporal y señales visuales dinámicas para ayudarte a identificar fácilmente entradas y salidas de alta probabilidad. Características Principales 1. Sistema de Tendencia In

Necesario para los operadores: herramientas e indicadores Ondas calcular automáticamente los indicadores, el comercio de tendencia del canal Perfecta tendencia de onda de cálculo automático de cálculo de canales , MT4 Perfecta tendencia de onda de cálculo automático de cálculo de canales , MT5 Copia local de trading Copia fácil y rápida , MT4 Copia fácil y rápida , MT5 Copia Local Trading Para DEMO Copia fácil y rápida , MT4 DEMO Copia Fácil y Rápida , MT5 DEMO
El indicador homeopático tambi
FREE

Moving Average Cloud dibuja 4 MAs en el gráfico simultáneamente en estilo histograma. El indicador utiliza 4 MAs: sma lenta & ema 200 y sma rápida & ema 50. el rango entre 2 MAs lentas y Rápidas, representado por histogramas en los límites de las MAs - creando una especie de "nube" que puede ser operada por todo tipo de estrategias MA como soporte & resistencia u otras... El cambio de color del mismo histograma indica que el impulso está cambiando.
Combinado con otros análisis de mercado, pued
FREE

Trend Reversal pro es un indicador de tipo histograma que da señales largas y cortas, el indicador puede ser operado por su cuenta con las siguientes reglas de entrada. Regla de Compra, el histograma da una barra verde. Regla de Venta, el histograma da una barra roja. Este indicador no repinta ni retropinta, las señales de este indicador no se retrasan. -------------------------------------------------------
FREE

GTAS FidTdi es un indicador de tendencia que utiliza una combinación de volatilidad y niveles potenciales de retroceso. Este indicador fue creado por Bernard Prats Desclaux, proprietary trader y ex gestor de fondos de cobertura, fundador de E-Winvest.
Descripción El indicador se representa como una envolvente roja o verde por encima o por debajo de los precios.
Modo de empleo Detección de la tendencia Cuando la envolvente es verde, la tendencia es alcista. Cuando es roja, la tendencia es bajis
FREE
Multi Timeframe Indicator incluye una gran cantidad de funciones y puede ser considerado como un ayudante universal para un trader. Su principal objetivo es mostrar hasta 10 indicadores a la vez utilizando sólo un pequeño ladrillo por cada uno de ellos. Estos indicadores incluyen Awesome Oscillator, CCI, DeMarker, MACD, RSI, RVI, Estocástico, Larry Williams' Percent Range, Bulls Power y Bears Power. Una función importante del indicador es la capacidad de monitorizar señales de diferentes marcos
FREE

Smart Reversal Signal es un indicador profesional para la plataforma MetaTrader 4; ha sido desarrollado por un grupo de operadores profesionales. Este indicador está diseñado para el comercio de Forex y opciones binarias. Al comprar este indicador, usted recibirá: Excelentes señales del indicador. Soporte gratuito del producto. Actualizaciones regulares. Varias opciones de notificación: alerta, push, correos electrónicos. Puede utilizarlo en cualquier instrumento financiero (Forex, CFD, opciones

Un indicador de tendencia sencillo y eficaz. Será un buen asistente a la hora de operar. Un mínimo de ajustes comprensibles. Póngalo en un gráfico y configúrelo. Bueno para combinar con otros indicadores. Pronto publicaré otro indicador de tendencia. La combinación de estos dos indicadores da buenos resultados. Funciona en todos los marcos de tiempo. Adecuado para cualquier pareja. Experimentar, ajustar, observar. Filtrar por plazos más altos.
FREE

¡Desbloquee las operaciones más inteligentes con la ruptura de bandas! ¿Está cansado de gráficos confusos y oportunidades perdidas? Obtenga señales de entrada y salida claras y de alta probabilidad directamente en su gráfico con el indicador Bands Breakout . Este no es un indicador más; es un sistema completo, consciente de la tendencia, diseñado para simplificar sus decisiones de trading y centrarse sólo en los mejores movimientos. Nuestro motor único combina el poder de impulso de la EMA 10 c
FREE

En Stonehill Forex, publicamos nuestro primer indicador desarrollado internamente, que se presentó en el sitio web de Stonehill Forex en marzo de 2025. La versión original se programó para MetaTrader 4 (MT4) y posteriormente para MT5 y TradingView, gracias al interés de la comunidad. Este indicador es gratuito y marca el comienzo de nuestra biblioteca.
Se trata de una superposición de precios cruzados de dos líneas que, en esencia, utiliza dos líneas de media móvil ponderada que se procesan a
FREE

WaPreviousCandleLevels MT4 muestra los niveles de velas anteriores, muestra los niveles de velas anteriores (Niveles OHLC) en diferentes marcos de tiempo. Está diseñado para ayudar al operador a analizar el mercado y prestar atención a los niveles de velas anteriores en diferentes marcos de tiempo. Todos sabemos que los niveles OHLC en mensual, semanal y diario son muy fuertes y la mayoría de las veces, el precio reacciona fuertemente en esos niveles. En el análisis técnico, el usuario puede ut
FREE

Touch VWAP es un indicador que le permite calcular un Precio Medio Ponderado por Volumen (VWAP) simplemente pulsando la tecla 'w' de su teclado y luego haciendo clic en la vela que desea calcular, haciendo clic debajo de la vela calcula el VWAP basado en el mínimo del precio con el volumen, haciendo clic en el cuerpo de la vela calcula el VWAP basado en el precio medio con el volumen y haciendo clic por encima de la vela calcula el VWAP basado en el precio máximo con el volumen, también tiene la
FREE

Escáner de señales RSI La tendencia principal de la acción o activo es una herramienta importante para asegurarse de que las lecturas del indicador se entienden correctamente. Por ejemplo, algunos de los analistas técnicos, han promovido la idea de que una lectura de sobreventa en el RSI en una tendencia alcista es probablemente mucho mayor que el 30%, y una lectura de sobrecompra en el RSI durante una tendencia bajista es mucho menor que el nivel del 70%. Este indicador le notifica las rupturas
FREE

El indicador mide la fuerza de cada divisa de su lista.
Idea principal: Simplemente itera a través de todas las combinaciones de pares y añade la diferencia entre la apertura y el cierre en porcentaje. Parámetros: Lista de divisas - qué divisas serán calculadas (máximo 8) Tipo de cálculo - a partir de qué datos se calculará la fuerza Entrada de datos de cálculo - se utiliza como entrada relacionada con el tipo de cálculo Sufijo del símbolo - utilizado en caso de sufijo en los símbolos, por ejem
FREE

www tradepositive .lat
ALGO Smart Flow Structure Indicator El estándar institucional para la estructura de mercado. Diseñado para traders serios de SMC y Acción del Precio , este indicador elimina el ruido de los fractales convencionales. Olvídate de las señales repintadas y la ambigüedad; obtén una visión cristalina de la estructura real, validada por reglas algorítmicas estrictas. El Panel de Sesgo (Dashboard) Toma decisiones informadas monitoreando 3 variables críticas en 8 temporalid
FREE

Con el indicador puede 1 Identificar la tendencia y seguir las tendencias grandes y pequeñas trazando líneas. Cuando el precio sale del corredor de las líneas, entonces con una alta probabilidad el precio irá a la siguiente línea e invertirá sobre ella. 2 Long-line - Trazar líneas a lo largo de los centros de los fractales, el indicador puede detectar el fractal del segundo punto (Análisis de barras numéricas). A menudo el precio puede acercarse a la línea incluso después de una semana o un mes
FREE

Un oscilador estocástico es un indicador de impulso que compara un precio de cierre concreto de un valor con un rango de sus precios a lo largo de un periodo de tiempo determinado. La sensibilidad del oscilador a los movimientos del mercado puede reducirse ajustando ese periodo de tiempo o tomando una media móvil del resultado. Se utiliza para generar señales de sobrecompra y sobreventa, utilizando un rango de valores acotado de 0 a 100. Este indicador muestra 15 estocásticos en un gráfico.
FREE

Se trata de un indicador que detecta la dirección de la tendencia. Utiliza el popular Bill Williams Alligator. Muestra el estado del mercado en todos los marcos temporales en un gráfico. Como es bien sabido, los operadores obtienen los principales beneficios en el mercado Forex operando por tendencia, y las pérdidas suelen ocurrir cuando el mercado está plano. Por lo tanto, para obtener beneficios, un operador debe aprender a detectar rápidamente la tendencia del mercado y la dirección de la ten
FREE

El indicador Investment Castle Chances mostrará señales en el gráfico para entrar en una operación de compra o venta. Hay 2 tipos de señales para cada dirección como sigue: Compra / Venta (Velas de color naranja) Compra fuerte (velas de color verde) / Venta fuerte (velas de color rojo) Usted puede colocar una operación de compra una vez que vea la flecha de compra o viceversa, o tal vez prefiera esperar una confirmación adicional "Compra fuerte" / "Venta fuerte". Este indicador funciona mejor c
FREE

MT5 Version Most indicators draw lines.
This one draws the battlefield. If you ever bought an EA or indicator based on a perfect equity curve — and then watched it bleed out live — you’re not alone.
The problem? Static logic in a dynamic market. Fibonacci Bollinger Bands adapts.
It combines Bollinger structure with customizable Fibonacci levels to mark zones of control — where price reacts, pauses, or reverses. No magic. Just logic that follows volatility. Why this tool matters It
FREE

Únete al Canal Koala Trading Solution en la comunidad de MQL5 para conocer las últimas señales, noticias sobre todos los productos Koala. El enlace de unión está abajo: https://www.mql5.com/en/channels/koalatradingsolution Descripción :
nos complace presentar nuestro nuevo indicador gratuito basado en uno de los indicadores profesionales y populares en el mercado de divisas (PSAR). Este indicador es una nueva modificación del indicador Parabolic SAR original. En el indicador pro SAR puede v
FREE

Indicador-ayudante informativo gratuito . Será útil para los comerciantes que el comercio de muchos símbolos o el uso de sistemas de cuadrícula (Promedio o Martingala). Indicador cuenta drawdown como porcentaje y la moneda por separado. Tiene una serie de ajustes: Contar la reducción del depósito según el valor de la equidad y enviar correo electrónico o notificaciones al usuario si DD más de lo establecido; Envío de e-mail cuando se alcanza el máximo de órdenes abiertas; Muestra el precio y la
FREE
¿QUÉ ES EL SIGUIENTE MOVIMIENTO? LA RESPUESTA ES SIMPLE, ESTE PROGRAMA SE BASA EN LA ACCIÓN DEL PRECIO POR LO TANTO ENCONTRAR EL PRÓXIMO MOVIMIENTO ES FÁCIL DE IDENTIFICAR ESTE PROGRAMA USA CALCULOS ESTANDAR PARA SOPORTE RESISTENCIA EN FORMA DE 2 MANERAS SELECCIÓN DE LÍNEAS DE TENDENCIA LÍNEAS HORIZONTALES LÍNEAS DE TENDENCIA GUIARÁN A LOS OPERADORES A OPERAR EN EL RANGO CON EL NIVEL DE PIVOTE TAMBIÉN LÍNEAS HORIZONTALES LE GUIARÁN SOBRE EL SOPORTE Y LA RESISTENCIA EN DIFERENTES MARCOS TEMPORAL
FREE

Comportándose de manera similar a la acción del precio de un gráfico, el indicador utiliza " Trix " para oportunizarse a la exposición de divergencia, volumen de mercado plano/bajo, y expansión de la acción del precio . El indicador TRIX, apodado así por la media exponencial triple, es un oscilador basado en el impulso que filtra los cambios y fluctuaciones menores de los precios que se consideran insignificantes para el comercio de divisas , ¡a la vez que proporciona oportunidades de ganar din
FREE
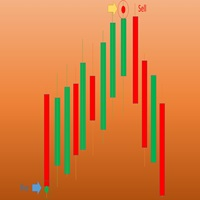
Wave Entry Alerts Oil es un indicador personalizado desarrollado por Azad Gorgis para MetaTrader 4. Este indicador está diseñado para proporcionar alertas basadas en patrones ZigZag, específicamente adaptados para operar con el símbolo Petróleo (XIT/USD).
Características principales: - Indicador de Ventana Gráfica: El indicador está diseñado para mostrarse en la ventana principal del gráfico. - Señales de flecha: El indicador genera señales de flecha en el gráfico, indicando potenciales puntos
FREE

¿Está cansado de tener muchos gráficos abiertos y de observar muchos pares de divisas diferentes? MCTSI monitorizará los puntos fuertes de 56 pares de divisas y le mostrará los mejores pares para operar, no más adivinar qué divisa es más fuerte/débil, no más operar un par que no se está moviendo positivamente. Esta es la versión BÁSICA. MCTSIP es la versión más avanzada y se puede encontrar aquí: https://www.mql5.com/en/market/product/20994 Usted puede tener muchos gráficos abiertos tratando de
FREE

El indicador Punto Pivote calcula y muestra automáticamente la línea del punto pivote y los niveles de soporte y resistencia. El pivote puede calcularse según la fórmula Clásica, Suelo, Fibonacci, Woodie, Camarilla o DeMark. También es posible seleccionar el periodo de cálculo del indicador. El operador puede elegir entre periodos diarios, semanales, mensuales o definidos por el usuario.
Tipos de pivotes Clásico Suelo Fibonacci Woodie Camarilla DeMark
Características principales El indicador
FREE

Heiken Ashi Toggle - Control Instantáneo del Modo Gráfico para MT4 Heiken Ashi Toggle (También deletreado Heikin Ashi) es un pequeño indicador de utilidad para MetaTrader 4 que proporciona velas Heiken Ashi - con una mejora clave: control instantáneo ON/OFF directamente desde el gráfico . En lugar de añadir, eliminar o recargar indicadores constantemente, esta herramienta permite a los operadores cambiar entre velas estándar y visualización Heiken Ashi con un solo clic. Qué hace este indicador M
FREE

El indicador SuPrEs indica la distancia hasta la siguiente línea horizontal cuyo nombre comienza por el prefijo configurado (ver Opciones).
utilización Dibuje soportes y resistencias en el gráfico y deje que el indicador le avise en cuanto se sobrepase una distancia configurada. Utilice el prefijo para proporcionar alarmas para otras líneas, así como para las líneas estándar (véase la captura de pantalla con el indicador de pivote).
Visualización del indicador El indicador muestra la distancia
FREE
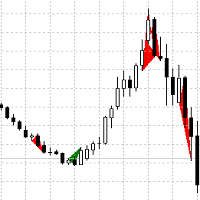
Un indicador de tendencia basado en la definición de varios tipos de combinaciones de velas, el triángulo formado se colorea con el color correspondiente, la tendencia roja es bajista, la verde es alcista. Combinaciones de velas de tipos estándar y no estándar con condiciones adicionales para su definición. El marco temporal recomendado es M30,H1,H4, D1. Cuando se combina con otros indicadores de tendencia, proporcionará puntos más precisos de entrada y salida del mercado (compra y venta).

Este sistema de trading se basa en la probabilidad matemática. En este caso, se comparan 5 velas consecutivas entre sí. Para una comparación lógica, considere estas 5 velas como 1 vela en el marco temporal M5. Por lo tanto, la comparación comienza con la apertura de una vela en el marco temporal M5. La probabilidad de coincidencia es del 50% en la 1ª vela, del 25% en la 2ª vela, del 12,5% en la 3ª vela, del 6,25% en la 4ª vela y del 3,125% en la 5ª vela. Por lo tanto, la 5ª vela tiene una proba
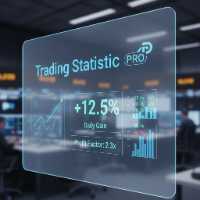
El indicador estadístico para metatrader 5 TradingStatisticPro recopila datos estadísticos sobre sus operaciones, lo que facilita la evaluación de la eficacia de las operaciones, los beneficios obtenidos y los riesgos. El indicador se coloca de forma compacta en la esquina del gráfico principal del terminal y muestra la siguiente información: 1. 1. El beneficio obtenido. 2. La reducción máxima. 3. El factor de recuperación. 4. Factor de ganancia. 5. La relación entre operaciones rentables y no
FREE
MetaTrader Market es el mejor lugar para vender los robots comerciales e indicadores técnicos.
Sólo necesita escribir un programa demandado para la plataforma MetaTrader, presentarlo de forma bonita y poner una buena descripción. Le ayudaremos publicar su producto en el Servicio Market donde millones de usuarios de MetaTrader podrán comprarlo. Así que, encárguese sólo de sus asuntos profesionales- escribir los programas para el trading automático.
Está perdiendo oportunidades comerciales:
- Aplicaciones de trading gratuitas
- 8 000+ señales para copiar
- Noticias económicas para analizar los mercados financieros
Registro
Entrada
Si no tiene cuenta de usuario, regístrese
Para iniciar sesión y usar el sitio web MQL5.com es necesario permitir el uso de Сookies.
Por favor, active este ajuste en su navegador, de lo contrario, no podrá iniciar sesión.