Indicadores técnicos para MetaTrader 4 - 14

Una estrategia de autor única que determina simultáneamente el cambio de tendencia, los puntos de entrada y los niveles de beneficio estimados para cada operación. El indicador puede determinar puntos de entrada en cualquier periodo de negociación, empezando por el gráfico M5 hasta W1. Al mismo tiempo, para comodidad del usuario, siempre se dibuja una flecha en un punto determinado y los niveles de beneficio recomendados (Take Profit1, Take Profit2, Manual Take Profit) también se muestra el niv
Imagínese: usted está en la cúspide de enormes ganancias, pero el mercado cambia repentinamente y pierde la oportunidad. O peor aún, en lugar de ganancias, obtienes pérdidas. ¿Y si tuvieras un aliado confiable que susurra de antemano: "Prepárate – ¡las olas están en camino!"? Conozca a Harbinger , el revolucionario indicador para MetaTrader 4, especialmente diseñado para los Traders que están cansados del caos y quieren anticipar los cambios del mercado.
Harbinger Es un algoritmo inteligente qu

Nebula Bow - Filtro de dirección de tendencia Nebula Bow es un filtro de dirección de tendencia limpio y eficiente, diseñado para ayudar a los operadores a mantenerse alineados con el flujo dominante del mercado, evitando al mismo tiempo ruidos innecesarios. En lugar de abrumar el gráfico con cálculos complejos o múltiples indicadores, Nebula Bow se centra en la claridad, la estabilidad y la orientación práctica de la tendencia . Se basa en la idea de que un enfoque bien estructurado y disciplin
FREE
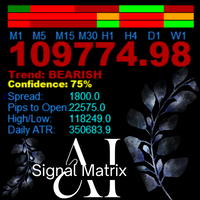
Matriz de señales AanIsnaini Tablero de Señales de Confianza Multi-Tiempo AanIsnaini Signal Mat rix es un potente indicador todo-en-uno que analiza la dirección del mercado y los niveles de confianza a través de múltiples marcos de tiempo - permitiendo a los operadores ver la tendencia general del mercado de un solo vistazo. Combina señales de Acción del Precio , Soporte-Resistencia , y varias herramientas técnicas probadas (MACD, ADX, RSI, pendiente MA, ATR, y Ratio de Volumen), luego calcula u
FREE

Este INDICADOR DOJI BAR FINDER automatizado puede utilizarse para gestionar operaciones e identificar posibles zonas de soporte y resistencia tanto para comprar como para vender. Está diseñado para identificar zonas para operaciones de venta/compra y puede utilizarse eficazmente junto con otros indicadores, como indicadores de bloque de órdenes, etc. Actualmente diseñado para MT4, más adelante se adaptará para funcionar en MT5. También ofrecemos la oportunidad de personalizar el robot de acuerdo
FREE

Este indicador es como un tipo especial de termómetro que mide la fuerza del par de divisas actual que está viendo. En lugar de mostrar la temperatura, muestra si el par está ganando o perdiendo fuerza en un momento dado, presentado como un histograma fácil de leer (esas barras verticales) en una ventana separada debajo de su gráfico principal.
Así es como funciona en términos sencillos: El indicador utiliza dos ajustes de velocidad diferentes para analizar el precio: un ajuste "rápido" (que r
FREE

El indicador Primer nivel del RSI analiza y muestra el nivel en el que se produjo el primer cruce del valor máximo o mínimo del RSI estándar para la posterior definición de tendencias fuertes. El indicador permite rastrear el inicio de una tendencia que no sigue las señales de la estrategia de negociación estándar del RSI, por ejemplo, cuando el precio se precipita a la baja tras alcanzar un nivel de sobreventa en lugar de invertirse. En este caso, tenemos que concluir que una fuerte tendencia e
FREE

Peak Trough Analysis es una gran herramienta para detectar picos y valles en su gráfico. La herramienta Peak Trough Analysis puede utilizar tres algoritmos diferentes de detección de picos y valles. Los tres algoritmos incluyen el Indicador de Fractales original de Bill Williams, el Indicador de Fractales Modificado y el Indicador ZigZag. Puede utilizar esta herramienta de análisis de picos y valles para detectar el patrón de precios formado por el proceso de ondas fractales de equilibrio. Para
FREE

INDICADOR DE DIVERGENCIA RSI
La divergencia RSI es un patrón muy poderoso que se utiliza a menudo para detectar un fuerte cambio de tendencia. también indica el debilitamiento de una señal fuerte. Así que algunos comerciantes quieren usarlo como criterio de salida. Este indicador funciona en todos los plazos y envía notificaciones, alertas o correos electrónicos al usuario. También muestra el patrón de máximos más altos y mínimos más bajos con su correspondiente divergencia RSI. Este indicador
FREE
The Pulse es un indicador que muestra el período de acumulación en tiempo real. En palabras simples: el Acaparamiento es cuando el "dinero inteligente" recoge silenciosamente un activo antes de lanzar un poderoso movimiento en el mercado. En el gráfico, parece que el precio está "atascado" en un rango. Esta es la fase de acumulación — alguien se está preparando para un gran movimiento. Y si aprendes a notar estos momentos — cuando el mercado parece "congelarse" pero se siente tenso, puedes esta

ATR Stops MTF es un indicador de tendencia basado en ATR (Average True Range) que proporciona niveles dinámicos de stop, ayudando al trader a identificar la dirección predominante del mercado y posibles cambios de tendencia.
El indicador soporta Multitimeframe (MTF) , incluye un filtro de media móvil y cuenta con un botón ON/OFF directamente en el gráfico para un control visual rápido. Características principales Stops dinámicos basados en ATR Identificación clara de la tendencia actual
FREE

El indicador muestra el volumen horizontal máximo en el marco de tiempo seleccionado. Basado en el indicador UPD1 Volume Box . Las líneas se pueden conectar o dividir. En la configuración, puede activar la alerta de toque inteligente. Este indicador será útil para aquellos que negocian utilizando el perfil del mercado y el concepto de Smart Money.
Parámetros de entrada.
Ajustes básicos. Bars Count - especifica el número de barras en las que se dibujará el TF POC. Data Source - el marco de tie
FREE

El indicador mide el desequilibrio entre alcistas y bajistas durante un periodo elegido y muestra una línea recta entre los dos puntos.
Si los toros tienen más volumen que los osos, la línea se vuelve verde. Si los osos tienen más volumen, se vuelve roja. La línea también muestra la diferencia porcentual de volumen.
El indicador muestra los mismos datos en una ventana separada. También puede ver el volumen dividido.
El indicador tiene dos modos.
Para ello, hay un botón en la parte superio

Indicador de Oferta y Demanda a Largo Plazo - Descripción
El Indicador de Oferta y Demanda a Largo Plazo es una herramienta profesional de MT4 diseñada para los operadores que desean realizar un seguimiento de las zonas de soporte y resistencia de los marcos temporales superiores en los marcos temporales inferiores. Identifica las zonas de oferta y demanda formadas en el marco temporal H4 y las muestra claramente en los gráficos M15, M5 y M1, ofreciendo a los operadores una visión precisa de l
FREE

Gann Box (o Gann Square) es un método de análisis de mercado basado en el artículo "Fórmula matemática para predicciones de mercado" de W.D. Gann. Este indicador puede trazar tres modelos de cuadrados: 90, 52 (104), 144. Hay seis variantes de cuadrículas y dos variantes de arcos. Puede trazar varios cuadrados en un gráfico simultáneamente.
Parámetros Square — Selección de un modelo de cuadrado de Gann: 90 — cuadrado de 90 (o cuadrado de nueve); 52 (104) — cuadrado de 52 (o 104); 144 — cuadrad
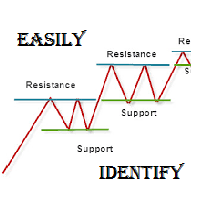
Como por nombre fácilmente identificar, este indicador es un herramienta de trading asequible porque con la ayuda de Desarrolladores populares y el apoyo de M Q L Plataforma He programado esta estrategia. Traté de introducir 4 tipos y 3 períodos de cálculo con respecto a la resistencia de apoyo, Además, también he cuidado de Líneas de tendencia que el Trader puede fácilmente ponerse en contacto con el mercado de otra manera también. ¿Qué hay para el Trader?
Trading Modes: Esta selección es para
FREE

El indicador de un Trader Profesional es un indicador de flecha para predecir la dirección del movimiento del precio. He estado trabajando en este indicador desde 2014.
Puede utilizar este indicador como su indicador principal, utilizar sus señales de entrada y utilizarlo como su único indicador para encontrar puntos de entrada.
Sobre el producto: TF recomendado [H4-D1-W1] . El indicador predice la dirección de la siguiente vela. Se adapta a una gran variedad de instrumentos; Flexibilidad en l
FREE

Sólo otro indicador Super Trend.
En este he añadido otro búfer (en el índice 2) que se puede utilizar en EA; los valores son -1 para identificar una tendencia bajista, mientras que para la tendencia alcista el valor es 1.
Aquí un fragmento de código:
int trend = ( int ) iCustom ( NULL , Timeframe, "SuperTrend" , Period , Multiplier, 2 , 1 ); Funciona en todos los marcos de tiempo.
Si necesitas ayuda para integrarlo en tu EA, no dudes en contactar conmigo.
FREE

Bandas ATR con zonas Take-Profit para MT4 El indicador de bandas ATR para MT4 está diseñado para ayudar a los operadores a gestionar el riesgo y navegar por la volatilidad del mercado. Mediante el uso del Average True Range (ATR), ayuda a identificar los niveles de precios clave y establecer realistas stop-loss y take-profit zonas. Características principales: Bandas basadas en ATR : El indicador calcula bandas dinámicas superiores e inferiores utilizando el ATR. Estas bandas se ajustan en funci
FREE

QualifiedEngulfing - es la versión gratuita del indicador ProEngulfing ProEngulfing - es la versión de pago del indicador Advance Engulf, descárguela aquí. ¿Cuál es la diferencia entre la versión gratuita y la de pago de ProEngulfing ? La versión gratuita tiene la limitación de un solo señal por día. Presentamos QualifiedEngulfing - Su indicador profesional de patrones Engulf para MT4 Desbloquee el poder de la precisión con QualifiedEngulfing, un indicador de vanguardia diseñado para identifica
FREE
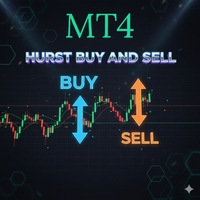
Hurst Buy and Sell Este indicador innovador, inspirado en la inteligencia de xAI Grok, utiliza el exponente de Hurst para identificar la naturaleza del mercado y generar señales de compra/venta. Si quieres más señales del indicador, cambia el mínimo de barras entre señales consecutivas. Entre mas bajo sea el valor más señales envia. Por ejemplo podrias colocar el valor de 50, mientras la EMA, permanece en 100(en la version MT5) y en la version MT4, podrias colocar un valor menor de 200, dej
FREE
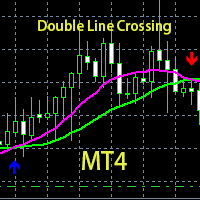
ste es un indicador personalizado basado en el cruce de medias dobles y el marcado de flechas.
Haga varias listas cuando las flechas azules aparezcan hacia arriba.
Haga una lista en blanco cuando la flecha roja aparezca hacia abajo.
Cuando la línea rosa cruza la línea verde hacia arriba, la línea rosa está arriba, la línea verde está abajo, aparece la horquilla dorada y la flecha azul.
Cuando la línea rosa cruza hacia abajo la línea verde, la línea rosa está abajo, la línea verde está arriba
FREE
Heikin Ashi Binary – Indicador de soporte visual de tendencia con visualización binaria Descripción general Heikin Ashi Binary es un indicador para MetaTrader que muestra la información de tendencia de Heikin Ashi en formato binario (bloques de dos colores) en una subventana.
En lugar de velas tradicionales, el indicador representa períodos alcistas (subida) y bajistas (bajada) como bloques de colores sencillos.
Esto facilita la identificación rápida de la continuidad o el cambio de tendencia. E
FREE
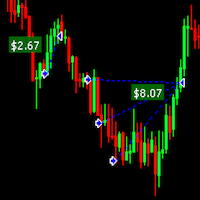
El indicador Draw Profit puede ayudar eficientemente a aquellos traders que quieren ver en el gráfico el resultado de todas las posiciones cerradas: ganancias o pérdidas. Si establece DrawProfit en su gráfico gestionado por un Asesor Experto (EA) verá claramente su rendimiento por sus ganancias y pérdidas. Mis otros productos: https: //www.mql5.com/en/users/hoangvudb/seller
Parámetros de entrada: Show Profit Labels : muestra el beneficio de las órdenes con una etiqueta (true/false). Profit Mode
FREE
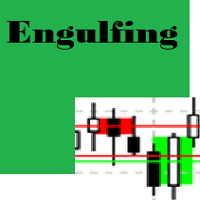
Detector de velas envolventes
Patrón detectable Patrones de Velas Dobles Envolvente alcista
La primera vela es negra. La segunda vela se abre con un hueco por debajo del cuerpo real de la vela negra, pero sube hasta cerrar por encima del cuerpo real de la vela negra. En otras palabras, el cuerpo real de la segunda vela envuelve completamente el cuerpo real de la primera vela. Envolvente bajista
La primera vela es blanca. La segunda vela abre con un gap por encima del cuerpo real de la vela bla
FREE

El indicador Pipsometer Pro es una herramienta esencial y minimalista diseñada para el operador disciplinado que necesita información financiera inmediata y de un vistazo. Funciona como una pantalla dedicada en tiempo real que calcula y muestra continuamente su ganancia o pérdida flotante actual, medida exclusivamente en **pips**, para cada operación abierta en el gráfico activo. Este enfoque en pips en lugar de valor monetario permite a los operadores evaluar el rendimiento del mercado y el mo
FREE
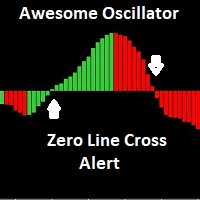
El Awesome Oscillator (AO) es un indicador utilizado para medir el impulso del mercado. El AO calcula la diferencia entre una media móvil simple de 34 periodos y una de 5 periodos. Las medias móviles simples que se utilizan no se calculan utilizando el precio de cierre, sino los puntos medios de cada barra. Este indicador tiene correo electrónico y pushup "móvil" características de alerta, para cualquier sugerencia, por favor no dude, gracias
FREE
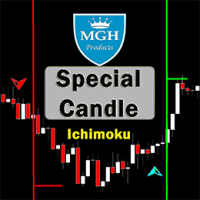
Vela especial
¿Quieres utilizar uno de los mejores indicadores de Forex con una exitosa estrategia Ichimoku? Puedes utilizar este impresionante indicador que está basado en la estrategia Ichimoku.
La versión MT5 está disponible aquí.
Primera estrategia:
Esta estrategia consiste en identificar cruces fuertes similares que raramente ocurren.
Los mejores marcos de tiempo para esta estrategia son 30 minutos (30M) y 1 hora (H1).
Los símbolos apropiados para el marco de tiempo de 30 minutos incluyen
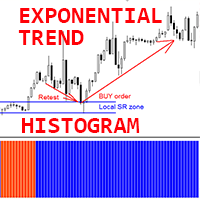
Indicador Crypto_Forex "Histograma de Tendencia Exponencial" para MT4, sin repintado.
- El indicador Histograma de Tendencia Exponencial es muy eficiente para detectar tendencias. - La mejor manera de usarlo es combinarlo con los Niveles de Soporte/Resistencia y la técnica de Retest (ver imágenes): - Una vez que el indicador detecta una nueva tendencia, busque el nivel SR local y cree allí la orden pendiente correspondiente, esperando un Retest en esa zona. - Si la nueva tendencia es alcista,

¿Se ha preguntado alguna vez por qué el ADX estándar se hace sin firmar y qué pasaría si se mantuviera firmado? Este indicador da la respuesta, lo que le permite operar de manera más eficiente. Este indicador calcula los valores ADX utilizando fórmulas estándar, pero excluye la operación de tomar el módulo de los valores ADX, que se añade a la fuerza en ADX por alguna razón. En otras palabras, el indicador preserva los signos naturales de los valores ADX, lo que lo hace más consistente, fácil de
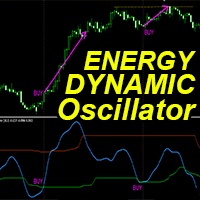
"Dynamic Energy Oscillator" es un indicador avanzado y personalizado de Crypto_Forex: ¡una herramienta de trading eficiente para MT4!
- Osciladores de nueva generación: vea las imágenes para saber cómo usarlo. - El Oscilador Dynamic Energy cuenta con zonas de sobreventa/sobrecompra adaptables. - Este es un indicador técnico de momentum muy útil en mercados de tendencia. - El Oscilador es una herramienta auxiliar para encontrar puntos de entrada exactos en zonas de sobreventa/sobrecompra. - Val

Traza inmediatamente barras Renko en una ventana externa/indicadora . Una de las ventajas distintivas que ofrecen los gráficos Renko es el hecho de que no dependen del tiempo. Por lo tanto, los nuevos bloques Renko sólo se trazan cuando el precio sube o baja el número de puntos especificado.
Por ejemplo, un gráfico Renko de 10 pips (100 puntos) trazaría los bloques cuando el precio se mueva 10 pips al alza en una tendencia alcista o 10 pips a la baja en una tendencia bajista. Los gráficos Renko

Future Trend Channel es un indicador dinámico y visualmente intuitivo diseñado para identificar la dirección de las tendencias y predecir posibles movimientos de precios. Originalmente desarrollado por ChartPrime para TradingView, esta herramienta ha sido adaptada para MetaTrader 4, ofreciendo a los traders una funcionalidad similar. Ya sea que seas un trader de swing, day trader o inversor a largo plazo, Future Trend Channel te ayuda a visualizar la fuerza de la tendencia, anticipar reversiones

CS ATR FIBO CANALES MULTI TIMEFRAME
Herramienta adicional para operar con el Indicador Cycle Sniper.
Francotirador de Ciclo : https://www.mql5.com/en/market/product/51950 El indicador dibuja canales basados en: - Precio del Cycle Sniper y Medias Móviles - Desviaciones ATR - Retrocesos y extensiones de Fibonacci
Características: - Multi TimeFrame - Opciones completas de alerta y notificación. - Ajustes sencillos - Encuentra el cambio de tendencia o reversiones extremas.
Entradas: - Modo Flech
- Precio real es de 80$ - Descuento del 60% (Ahora es de 30$) - Está habilitado para 1 compra. ¡Póngase en contacto conmigo para la herramienta de bonificación extra, instrucción o cualquier pregunta! - No repintado, No lag - Yo sólo vendo mis productos en Elif Kaya Perfil, cualquier otro sitio web son robados versiones antiguas, Así que no hay nuevas actualizaciones o apoyo. - Actualización de por vida libre
Introducción Smart Money Concepts (SMC) estrategia se popularizó inicialmente el métod

Título del producto Smart Stochastic (MT4) – parte de la serie SmartView Indicators Descripción breve Indicador Stochastic con una experiencia de usuario única en la plataforma MetaTrader. Ofrece capacidades avanzadas no disponibles anteriormente, como abrir configuraciones con doble clic, ocultar y mostrar indicadores sin eliminarlos, y mostrar la ventana del indicador a tamaño completo del gráfico. Diseñado para funcionar perfectamente con el resto de la serie SmartView Indicators. Visión gene
FREE

Título del producto Smart MACD (MT4) – parte de la serie SmartView Indicators Descripción breve Indicador MACD con una experiencia de usuario única en la plataforma MetaTrader. Ofrece capacidades avanzadas no disponibles anteriormente, como abrir configuraciones con doble clic, ocultar y mostrar indicadores sin eliminarlos, y mostrar la ventana del indicador a tamaño completo del gráfico. Diseñado para funcionar perfectamente con el resto de la serie SmartView Indicators. Visión general La serie
FREE
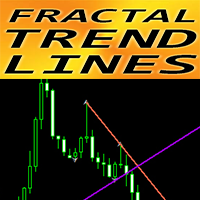
Indicador Crypto_Forex "Fractal Trend Lines" para MT4.
- Este indicador es excelente para los operadores que utilizan el análisis gráfico con rupturas. - "Fractal Trend Lines" muestra líneas gráficas de tendencia ascendente (color violeta) y tendencia descendente (color rojo). - Las líneas de tendencia ascendente y descendente se construyen sobre los 2 fractales correspondientes más cercanos. - El indicador tiene pocos parámetros responsables del color y el ancho de las líneas de tendencia. -

Auto Order Block con ruptura de estructura basada en ICT y Smart Money Concepts (SMC)
Futuros Ruptura de estructura ( BoS )
Bloque de órdenes ( OB )
Bloque de Orden de marco de tiempo superior / Punto de Interés ( POI ) mostrado en el gráfico actual
Fair value Gap ( FVG ) / Desequilibrio - MTF ( Multi Time Frame )
HH/LL/HL/LH - MTF ( Multi Time Frame )
Choch MTF ( Multi Time Frame )
Desequilibrio de Volumen , MTF vIMB
Brecha Potencia de 3
Igual High / Low 's , MTF EQH / EQL
Liquide z
Má
(Traducción de Google) La representación estándar de la vela Heikin Ashi tiene un valor abierto que es equivalente a un Exponencial Media Móvil (EMA) del Precio Total , del cual el valor alfa de la EMA es fijo en 0,5 (equivalente a un período EMA de 3,0). En esta versión dinámica, el período se puede cambiar a cualquier valor que se desee utilizar, lo que también permite análisis aproximado de marcos de tiempo múltiples, o use el valor bajo o alto como una especie de stop-loss dinámico. el cruce
FREE
El indicador "Dimensión de Fibonacci" permite visualizar niveles de Fibonacci preestablecidos o definidos por el usuario en varios marcos temporales. Toma automáticamente el máximo y el mínimo anteriores de dos marcos temporales definidos por el usuario y calcula sus niveles de retroceso de Fibonacci. También tiene en cuenta el nivel retrocedido para dibujar las expansiones en cada cambio de precio. Una dimensión visual completa en múltiples marcos temporales permite derivar estrategias rentable
FREE

INFOPad es un panel de información que crea información sobre el par de divisas seleccionado en el terminal MetaTrader 4. Hay 5 funciones de este indicador: Muestra la información principal y principal sobre el símbolo seleccionado: Preguntar BID, Spread, Stop Level, Swap, valor Tick, precios de comisión; Muestra los objetivos futuros del objetivo SL y del objetivo TP (el número de puntos del límite de pérdida y la ganancia establecidos, el monto en dólares); Muestra la ganancia recibida por lo
FREE
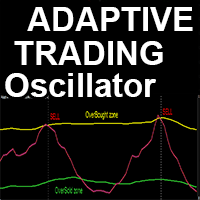
Indicador avanzado y personalizado para criptomonedas y Forex: "Oscilador de Trading Adaptativo" - ¡una herramienta auxiliar de trading eficiente para MT4!
- Este indicador es una nueva generación de osciladores. Consulte las imágenes para ver cómo usarlo. - El "Oscilador de Trading Adaptativo" cuenta con zonas de sobreventa/sobrecompra adaptativas y ajustables. - Este oscilador es una herramienta auxiliar para encontrar puntos de entrada y salida precisos en las zonas dinámicas de sobreventa/
40% de descuento. Precio original: $50
Moving Average Trend Scanner es un panel de control de triple cruce de medias móviles con múltiples símbolos y marcos temporales que ayuda a los operadores a supervisar e identificar posibles tendencias del mercado desde un solo gráfico. Este panel escanea 3 medias móviles en hasta 28 instrumentos configurables y 9 marcos temporales para la triple alineación de medias móviles y el cruce de medias móviles con una función de escaneo profundo para escanear t

El objetivo de esta nueva versión del indicador MT4 estándar, incluido en el suministro de la plataforma, es mostrar en una subventana varios marcos temporales de un mismo indicador. Ver el ejemplo mostrado en la figura de más abajo. Sin embargo, el indicador no se representa como un indicador MTF simple. Es la representación real del indicador en su marco temporal. Ajustes disponibles en el indicador FFx: Elección del marco temporal a mostrar (desde M1 hasta MN) Ajuste de la anchura (cantidad d
FREE

Indicador de búsqueda de precio magnético, el precio promedio al que el precio tiende a regresar. Optimizado para XAUUSD H1. Tiene 3 líneas, siendo la central el precio al que se debe mantener el enfoque. Según datos históricos, la tasa de éxito de retorno al precio promedio fue superior al 92% con la configuración predeterminada; en los demás casos, se activó el stop loss, que está configurado por defecto. El punto de entrada y el momento de entrada son aproximadamente al comienzo del día y, pa
FREE

Este indicador identifica los máximos y mínimos oscilantes en el gráfico de precios comparando los máximos y mínimos de cada vela con un número determinado de velas anteriores y posteriores. Una vez identificados los máximos y mínimos oscilantes, puede utilizarlos para determinar posibles niveles de soporte y resistencia. Un nivel de soporte se forma cuando el precio cae y rebota desde un mínimo oscilante, lo que indica que hay presión compradora en ese nivel. Un nivel de resistencia se forma cu
FREE

El indicador " Countdown Candle Timer " es una herramienta visual para la plataforma MetaTrader 4 que muestra una cuenta regresiva precisa del tiempo restante hasta la próxima vela en el gráfico.
Proporciona información en tiempo real sobre la duración restante de la vela actual, lo que permite a los operadores realizar un seguimiento preciso del tiempo y optimizar su toma de decisiones comerciales.
El indicador se puede personalizar en términos de color, tamaño de fuente y posición en el gráfi
FREE

IceFX SpreadMonitor - indicador especial que registra el valor del spread. Muestra el spread actual, el mínimo/máximo y el medio. Estos valores quedan visibles incluso después del reinicio. Además, SpreadMonitor puede guardar los valores necesarios de spread en un archivo CSV para su posterior análisis.
FREE

El indicador de volatilidad SPV es uno de los filtros más eficaces. Filtro de volatilidad. Muestra tres opciones de volatilidad. Las denominadas límite, real, y la última más efectiva para el filtro es el filtro porcentual. El porcentaje de folatilidad muestra la relación entre la volatilidad límite y la volatilidad real. Y así, si operamos en el medio del canal, entonces es necesario establecer la condición de que el porcentaje sea inferior a un determinado valor del indicador. Si operamos en l
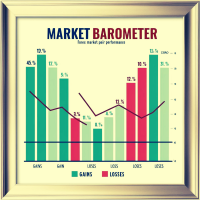
Market Barometer es un código de trucos para el comercio, actúa como un "barómetro" para el sentimiento del mercado a través de varios pares, mostrando sus cambios. Puede saber de inmediato con qué operar. Puede operar tendencias o retrocesos. Versión MT5: https: //www.mql5.com/en/market/product/127467 Market Barometer es una poderosa herramienta diseñada para rastrear y visualizar los cambios porcentuales a través de múltiples pares de divisas. Mediante el análisis de los cambios de precios de

Este completo indicador técnico calcula y traza hasta 3 medias móviles con 3 periodos diferentes. Al emplear tres medias móviles de distintos periodos de retroceso, el operador puede confirmar si el mercado ha experimentado realmente un cambio de tendencia o si simplemente está haciendo una pausa momentánea antes de reanudar su estado anterior. SX Golden MA Pack para MT5 está disponible aquí . Cuanto más corto es el periodo de la media móvil, más se aproxima a la curva de precios. Cuando un val
FREE
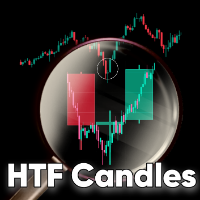
Velas HTF MT4 es un indicador de mt4 que traza el contorno de las velas de marco de tiempo superior en la vela inferior, incluyendo cualquier MT5 marco de tiempo superior elegido . El indicador le da la opción de elegir si desea o no ver en vivo actual vela HTF, sin retraso o repintado. Características Velas de Periodo MT5: Este indicador traza cualquier vela de periodo MT5, por ejemplo m3, m5, m12, m15, m20... y así sucesivamente, en el periodo inferior. Opciones Heiken Ashi: Tiene la opción de

El Indicador de Divergencia RSI es una herramienta poderosa diseñada para identificar posibles inversiones en el mercado al detectar discrepancias entre el Índice de Fuerza Relativa (RSI) y el movimiento de los precios. Las divergencias pueden ser una indicación significativa de un cambio de tendencia inminente, ya sea de alcista a bajista o viceversa. Este indicador está construido para facilitar y hacer más eficiente la tarea de identificar posibles oportunidades de operación. Características
FREE

Este indicador está diseñado para detectar patrones de inversión de alta probabilidad: Dobles Tops/Bottoms con rupturas falsas . Por favor, lea también la entrada del blog "Cómo obtener grandes ganancias de forma consistente " que explica los conceptos detrás del indicador ULTIMATE Double Top/Bottom y cómo se puede utilizar un enfoque top-down para obtener 15 - 20R operaciones ganadoras de forma regular . El video muestra el máximo rendimiento del indicador. Con rendimiento máximo, quiero decir
Gold Trend M1 - Herramienta de scalping optimizada para el oro (XAUUSD) Gold Trend M1 es un indicador de trading de alta frecuencia para la plataforma MetaTrader 4, optimizado específicamente para el marco temporal M1 en el mercado del Oro. Combina un potente filtro de tendencia SuperTrend con señales de compra/venta derivadas de la lógica de cálculo Heiken Ashi, ayudando a los operadores a identificar puntos de entrada precisos y disciplinados para un rendimiento óptimo de las operaciones.
Car
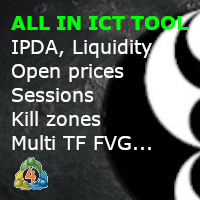
ICT Template Indicator visualiza y actualiza automáticamente todos los elementos importantes de ICT para Scalpers, Day y Swing traders. Le permite mantener su gráfico limpio y traer cualquier elemento con un solo clic a los botones laterales. Gracias a las notificaciones móviles sobre los niveles de liquidez externa, no perderá ninguna oportunidad y no tendrá que sentarse detrás de las pantallas todo el día. Cada elemento tiene colores totalmente personalizables, anchura, tipos de línea, plazo

El indicador busca una consolidación (plano) en el mercado en un momento determinado, construye un canal de caja y marca niveles con sangría a partir de él para una ruptura. Tras cruzar uno de los niveles, el indicador marca la zona para la toma de beneficios y calcula el beneficio o la pérdida correspondiente en la dirección de esta entrada en el panel. Así, el indicador, ajustándose al mercado, encuentra una zona plana del mercado, con el inicio de un movimiento tendencial para entrar en ella.
FREE

SmoothedRSI es un indicador personalizado que calcula un RSI estándar y luego aplica un método de suavizado a los valores del RSI. El indicador muestra únicamente la línea de RSI suavizado en una ventana separada. El rango de salida es de 0 a 100. El RSI puede reaccionar con fuerza a fluctuaciones de precio a corto plazo, lo que puede aumentar las oscilaciones pequeñas según las condiciones del mercado. Este indicador suaviza los valores del RSI para reducir el ruido de corto plazo y facilitar l
FREE
El indicador encuentra un volumen bajo, alto y extremo basado en los coeficientes dados y los colorea en los colores especificados. Reemplaza la función estándar de dibujo de volúmenes en el terminal metatrader. Las velas también se pueden pintar en el color del volumen. En las velas con un volumen extremo, se determina el volumen horizontal máximo (cluster/POC). Dependiendo de su ubicación (empujar, neutral, detener), el clúster también tiene su propio color. Si el clúster está en la sombra y
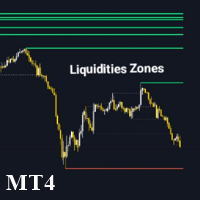
El Liquidity Zone Detector es un indicador técnico avanzado diseñado para identificar y destacar las zonas clave de liquidez en el mercado utilizando el indicador ZigZag. Esta herramienta localiza los niveles de precios donde es probable que exista una liquidez significativa trazando líneas de tendencia en los máximos y mínimos detectados por ZigZag. El Liquidity Zone Detector ayuda a los traders a identificar posibles áreas de reversión o continuación de tendencia basadas en la acumulación o li
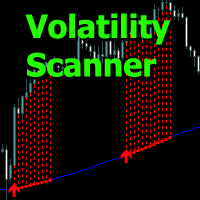
Volatility Scanner - este indicador analiza la condición del mercado y muestra las zonas de volatilidad creciente mediante líneas de histograma.
El indicador permite determinar los momentos para abrir y mantener posiciones, trabajar en la dirección de la tendencia o cuándo esperar a que pase el tiempo sin operar.
Los parámetros de entrada permiten configurar el indicador de forma independiente para el instrumento de trading o el marco temporal deseado.
Se puede usar en cualquier marco temporal,
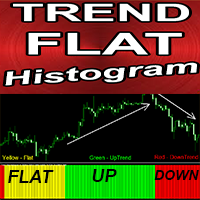
Indicador Crypto_Forex "Histograma de Tendencia Plana" para MT4, sin repintado.
- El indicador Histograma de Tendencia Plana es muy sensible y mucho más eficiente que cualquier media móvil estándar. - Está diseñado para mostrar las condiciones actuales del mercado: Plana, Tendencia alcista, Tendencia bajista. - El indicador tiene 3 colores: Amarillo para condiciones de mercado planas, Rojo para tendencia bajista y Verde para tendencia alcista (los colores se pueden cambiar en la configuración)

Estadísticas del panel de cuenta
Es una herramienta que te ayudará a tener una visión enfocada para conocer las ganancias y pérdidas de tu cuenta, para que puedas llevar un control de la misma, además trae un análisis de drawdown para conocer el riesgo obtenido. Después de descargarlo y activarlo en su cuenta, debe adjuntarlo a cualquier símbolo, por ejemplo EURUSD H1, luego a partir de este momento la herramienta comenzará a monitorear sus estadísticas.
el panel esta completamente avanzado,
FREE
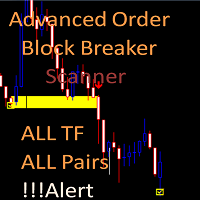
Explorador avanzado de bloques de pedidos
Este escáner es de descarga gratuita, pero depende de que usted posea el indicador avanzado de ruptura de bloques de órdenes. Necesita comprar el indicador aquí: https: //www.mql5.com/en/market/product/59127
Versión MT5: https: //www.mql5.com/en/market/product/62769
El Scanner le mostrará en un solo gráfico todos los marcos temporales (M1 a Mensual) con su propio estado para el indicador: advance order block breaker Escanea todos los marcos de tiempo
FREE

Una ayuda sencilla pero eficaz que le permitirá seguir las tendencias tanto globales como locales del mercado. El indicador combina el trabajo de dos osciladores: Estocástico y RSI. Ambos indicadores pueden ajustarse a cualquier marco temporal.
Ventajas de uso Multitimeframe - puede ajustar ambos indicadores a los marcos temporales deseados. Para obtener los puntos de entrada, puede utilizar el sistema de triple pantalla de Elder. Altamente personalizable - puede configurar no sólo los parámetr
FREE
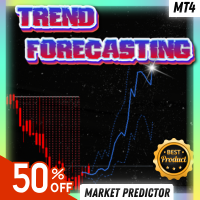
Summer Sale: 50% OFF!!! Promotion is valid until 08 August 2025! Este indicador es imparable cuando se combina con nuestro otro indicador llamado Katana. Después de la compra, envíenos un mensaje y usted podría conseguir Katana GRATIS como un bono. Después de la compra, envíenos un mensaje privado para sus instrucciones. El indicador de Predicción de Tendencia es una herramienta única y fácil que es capaz de hacer predicciones sobre el futuro movimiento del precio basado en las señales generad
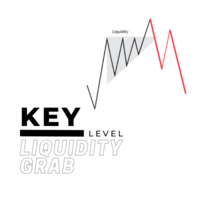
Para que se produzca un movimiento alcista, por ejemplo, debe haber mucho poder de compra, pero no se puede comprar si no hay venta en el otro lado, por lo que los grandes jugadores suelen tender a manipular el mercado con el fin de crear posiciones disponibles en el otro lado y poder abrir sus posiciones y una de las maneras es mediante la creación de una ruptura falsa / una toma de liquidez. Antes de que se formen la mayoría de los grandes movimientos de inversión y las tendencias, se habría p

Scalping monstruo está diseñado para la plataforma Metatrader4. Cuando se coloca en un gráfico de divisas, el indicador analiza automáticamente el mercado utilizando un algoritmo de adaptación y muestra las señales al operador en forma de puntos rojos y azules. El indicador también muestra en la esquina superior derecha información sobre posibles ganancias / pérdidas.
Cómo comerciar usando Scalping monster: cuando el punto azul aparece en la tabla, abrimos una orden de compra. Cierre la ord

--- VERSIÓN GRATUITA - SÓLO FUNCIONA EN EURUSD
------------------------------------------------------------------- Esta es una estrategia de ruptura única que se utiliza para determinar la próxima tendencia/movimiento a corto plazo. El sistema completo está disponible en MQL5 bajo el nombre "Forecast System". Aquí está el enlace --> https://www.mql5.com/en/market/product/104166?source=Site Backtest no es posible, porque los cálculos se realizan sobre la base de los datos de todos los plazos / pe
FREE
Compruebe lo fácil y sencillo que es comprar un robot en la MetaTrader AppStore, la tienda de aplicaciones para la plataforma MetaTrader.
El Sistema de pago MQL5.community permite efectuar pagos con ayuda de PayPal, tarjeta bancaria y los sistemas de pago más populares. Además, le recomendamos encarecidamente testar el robot comercial antes de la compra, para así hacerse una idea más completa sobre él.
Está perdiendo oportunidades comerciales:
- Aplicaciones de trading gratuitas
- 8 000+ señales para copiar
- Noticias económicas para analizar los mercados financieros
Registro
Entrada
Si no tiene cuenta de usuario, regístrese
Para iniciar sesión y usar el sitio web MQL5.com es necesario permitir el uso de Сookies.
Por favor, active este ajuste en su navegador, de lo contrario, no podrá iniciar sesión.