Indicadores técnicos para MetaTrader 4 - 18

Este indicador presenta un enfoque alternativo para identificar la Estructura del Mercado. La lógica utilizada se deriva del material de aprendizaje creado por DaveTeaches (en X) Upgrade v1.10: add option to put protected high/low value to buffer (figure 11, 12)
Al cuantificar la Estructura de Mercado, es común utilizar los máximos y mínimos fractales para identificar pivotes de oscilación "significativos". Cuando el precio cierra a través de estos pivotes, podemos identificar un Cambio de Est

Descripción: El Perfil de Volumen muestra información detallada de las actividades de negociación históricas en determinados niveles de precios (Perfil de Mercado). Así puede localizar las zonas con los mejores precios del mercado y obtener una ventaja sobre otros participantes del mercado.
Características: Perfil de Volumen Personalizable / Perfil de Mercado Muestra la Zona de Valor "justo" con el 70% de todo el Volumen
Muestra las zonas críticas de bajo volumen
Muestra los puntos VPOC, VAL y

Time Range Separator es una herramienta útil para mostrar un periodo separador en su plataforma. Puedes ir a las propiedades del indicador, seleccionar el rango deseado y listo. Creemos que es una herramienta útil y necesaria que queremos compartir gratuitamente con todos nuestros seguidores.
Valores de Entrada: TimeFrame Separador de Periodos GMT_Hour (ej. +1 o -1) para mover las líneas en Period Time +/- tot horas en input Hide_dates para mostrar u ocultar la fecha en las líneas verticales VL
FREE

El indicador de promedios correctos de AIS le permite establecer el comienzo de un movimiento de tendencia en el mercado. Otra cualidad importante del indicador es una clara señal del final de la tendencia. El indicador no se redibuja ni se recalcula.
Valores mostrados h_AE - límite superior del canal AE
l_AE - límite inferior del canal AE
h_EC - Valor predicho alto para la barra actual
l_EC - Valor predicho bajo para la barra actual
Señales al trabajar con el indicador. La señal principal

Balance Levels es un indicador de trading fácil de usar que proporciona señales claras de compra y venta junto con niveles de precios dinámicos, ayudando a los traders a planificar sus entradas y salidas con mayor confianza. La herramienta es muy flexible: puede utilizarse como estrategia independiente o integrarse en cualquier sistema de trading existente. Funciona en todos los marcos temporales y en todos los mercados : Forex, Oro, Índices, Criptomonedas o Acciones. Balance Levels se adapta a
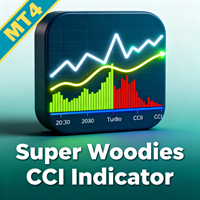
Mejore su ventaja en el trading con el Super Woodies CCI Indicator MT4, un oscilador de momentum avanzado inspirado en el renombrado sistema Woodies CCI de Ken Wood, que ganó popularidad a principios de los 2000 entre day traders por su enfoque dual-CCI para detectar patrones cíclicos y setups de alta probabilidad. Ampliamente favorecido por traders de forex, acciones y commodities, este indicador aprovecha el Commodity Channel Index (CCI) para detectar condiciones de sobrecompra/sobreventa, con

Exit Area Ultimate es un indicador técnico diseñado para mejorar las decisiones comerciales al indicar los niveles diarios de rango real promedio (ATR) y tasa diaria promedio (ADR) en el gráfico. Al comprender estos niveles, los operadores pueden evaluar fácilmente el movimiento promedio de un activo a lo largo del día. Este indicador versátil sirve para múltiples propósitos para los comerciantes diarios, ayudando en la colocación de pedidos, identificando tendencias intradía, establec

Mejore su precisión comercial con el indicador WaveTrend Oscillator Indicator MT4, una herramienta basada en momentum adaptada del icónico script de LazyBear de 2014 en TradingView, renombrado por su exactitud en detectar reversiones de mercado y cambios de momentum. Celebrado ampliamente en la comunidad comercial durante más de una década, este oscilador combina elementos similares a RSI y MACD para detectar condiciones de sobrecompra/sobreventa, convirtiéndolo en un elemento esencial para trad

La herramienta se utiliza para calcular el tamaño de la posición que puede abrirse con el riesgo asumido previamente. El riesgo puede definirse como valor porcentual de la cuenta (%), valor nominal, expresado en la divisa de la cuenta. El tamaño de la posición viene determinado por la distancia del SL previsto (línea roja).
Parámetros de entrada Pérdida_en_dinero - si es verdadero, el valor de la pérdida aceptable se determina por el parámetro "Pérdida_aceptable", de lo contrario la pérdida ace

Ichimoku Multicurrency Scanner Dashboard MT4 es una herramienta de trading poderosa diseñada para monitorear múltiples pares de divisas y marcos temporales utilizando Ichimoku Kinko Hyo. Organiza las señales en un formato de cuadrícula, con símbolos agrupados por monedas base y marcos temporales, desde M1 hasta MN1. Los traders pueden habilitar o deshabilitar marcos temporales específicos para adaptarse a sus estrategias. La herramienta muestra señales basadas en las siguientes estrategias: Kiju
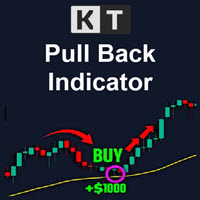
KT Pull Back Arrows muestra flechas de retroceso utilizando el RSI (Índice de Fuerza Relativa) para identificar áreas de entrada adecuadas dentro de las zonas de sobrecompra y sobreventa. El indicador detecta eficazmente los momentos favorables para iniciar operaciones de retroceso aprovechando estos umbrales del RSI. El trading de tendencia se considera a menudo la estrategia más rentable en el mercado Forex. Es como montar una ola, seguir la corriente y aprovechar el impulso del mercado. Sin e

KT MACD Alerts es una versión personalizada del indicador MACD estándar disponible en MetaTrader. Proporciona alertas y también dibuja líneas verticales cuando ocurren los siguientes dos eventos: Cuando el MACD cruza por encima de la línea cero. Cuando el MACD cruza por debajo de la línea cero.
Características Incluye un escáner MTF incorporado que muestra la dirección del MACD en todos los marcos de tiempo. Una excelente opción para traders que se enfocan en cruces del MACD con respecto a la
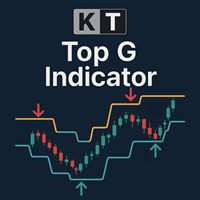
KT Top G es un indicador basado en acción del precio que combina un análisis inteligente de canales para identificar posibles techos y suelos del mercado. Cuando se detecta una posible reversión, el indicador dibuja flechas grandes y claras en el gráfico, ofreciéndote una señal anticipada antes del giro del mercado. Flechas grandes: Señalan techos y suelos de alta probabilidad detectando agotamiento del precio y cambios en el impulso. Flechas pequeñas: Indican puntos de giro de menor probabilida

Niveles de Stop Out y Margin Call – Tu asistente de gestión de riesgos Toma el control total de tu riesgo de trading con este indicador que muestra dinámicamente los niveles clave en tu gráfico: Stop Out, Margin Call, Margen Libre y un nivel personalizado. Perfecto para traders que usan alto apalancamiento o estrategias all-in, donde cada pip cuenta y la tolerancia al riesgo es mínima. Totalmente personalizable – configura color, estilo, grosor y visibilidad de cada línea por separado. Configura

Una de las secuencias numéricas se llama "Secuencia de incendios forestales". Ha sido reconocida como una de las secuencias nuevas más bellas. Su característica principal es que esta secuencia evita tendencias lineales, incluso las más cortas. Es esta propiedad la que formó la base de este indicador. Al analizar una serie de tiempo financiera, este indicador intenta rechazar todas las opciones de tendencia posibles. Y solo si falla, entonces reconoce la presencia de una tendencia y da la señal
El indicador de zona FVG es una herramienta poderosa diseñada para identificar brechas de valor justo (FVG) en el mercado, destacando los desequilibrios de precios entre el valor justo y el precio de mercado. Esta identificación precisa de brechas permite a los operadores detectar posibles puntos de entrada y salida del mercado, lo que mejora significativamente su capacidad para tomar decisiones comerciales informadas. Con su interfaz intuitiva y fácil de usar, el indicador de zona FVG escan
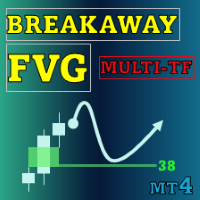
Special offer : ALL TOOLS , just $35 each! New tools will be $30 for the first week or the first 3 purchases ! Trading Tools Channel on MQL5 : Join my MQL5 channel to update the latest news from me La herramienta Breakaway Fair Value Gaps (FVG) es una solución innovadora diseñada para que los traders identifiquen áreas donde el precio se ha alejado del equilibrio, proporcionando conocimientos detallados sobre las probabilidades de mitigación. Esta herramienta no solo destaca señale

El indicador Boom and Crash Spike Detector está codificado en base a una estrategia avanzada principalmente para detectar Boom and Crash en los precios. Se implantaron algoritmos complejos para detectar auges y caídas de alta probabilidad en los precios. Alerta sobre posibles fases de auge o choque: Fase de auge: cuando el precio aumenta demasiado rápido. Crash Phase: cuando el precio baja demasiado rápido.
OFERTA POR TIEMPO LIMITADO: El indicador está disponible por solo 30$ y de por vida. Ca

Se sabe que el indicador ADX se utiliza para determinar la dirección de la tendencia. No sólo eso, sino que también tiene desviaciones (+DI y -DI) que determinan la dirección de la tendencia también. El papel del indicador es detectar la tendencia y su dirección y generar señales en consecuencia.
Configuración del indicador: - Periodo ADX : por defecto es de 14 periodos (funciona mejor con el timeframe H1). - Ancho de la señal : el tamaño de las flechas de señales. - Distancia de la señal : la
FREE

Volume Delta es un indicador muy potente que lee la oferta en el Mercado. Calcula el Delta a partir del movimiento del precio y la diferencia de los volúmenes de COMPRA y VENTA. Su estructura especial le permite obtener todos los valores de timeframe disponibles en la plataforma MT4. Una buena observación de este instrumento puede sugerir grandes puntos de entrada y posibles retrocesos. Estamos seguros de que esta herramienta le ayudará a mejorar el timing de sus operaciones. Ver también para MT

¡ Compruebe mis herramientas de pago funcionan perfecto! "Period Cross RSI" Es una nueva idea de indicador que muestra cruces de dos líneas RSI con diferentes períodos que crea zonas ascendentes y descendentes para la confirmación de operaciones largas y cortas. Este indicador es nuevo y se actualizará más adelante, por ahora recomiendo usarlo como una confirmación, indicador de filtro para la determinación de las zonas de comercio largo / corto, no como un indicador de señalizador por ahora. La
FREE

Lot Size Calculator – Herramienta de gestión de posiciones Este indicador calcula el tamaño del lote basado en el porcentaje de riesgo seleccionado y la distancia del stop loss. Está diseñado para el trading de Forex, metales, índices, materias primas y criptomonedas.
Características principales Cálculo del tamaño de posición según el saldo de la cuenta / capital disponible y el porcentaje de riesgo elegido Modos de orden de mercado y orden pendiente Niveles visuales en el gráfico: entrada, sto
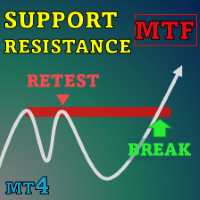
Special offer : ALL TOOLS , just $35 each! New tools will be $30 for the first week or the first 3 purchases ! Trading Tools Channel on MQL5 : Join my MQL5 channel to update the latest news from me En el siempre cambiante panorama del comercio financiero, identificar y analizar con precisión los niveles de soporte y resistencia es esencial para tomar decisiones de inversión informadas. SnR Retest and Break Multi-Timeframe es un indicador de soporte y resistencia diseñado para mejor

El indicador RoundNumbers es un sencillo y potente nivel psicológico de precios. Los operadores suelen utilizar estos niveles como Soporte y Resistencia (SnR). Entrada del Indicador: Niveles - Número de niveles dibujados en el gráfico. Por defecto 30 niveles. BoxSize - Tamaño de la caja dibujada en cada nivel, indica los topes alrededor de los niveles. Valor por defecto 1pips (10 puntos) por encima y por debajo de cada nivel. ZoneSize - Distancia entre cada nivel, valor por defecto 10pips (100 p
FREE
XAU Scalper MT4 Versión MT5 Una herramienta analítica para observar los movimientos de precios a corto plazo en los pares de oro. El indicador XAU Scalper proporciona señales de compra y venta basadas en la estabilidad de la vela, el RSI y el impulso a corto plazo. Está diseñado para ayudar a los traders a identificar posibles puntos de entrada durante breves movimientos del mercado en pares XAU. Características Índice de Estabilidad de la Vela ( Candle Stability Index ): Mide la proporción entr

El indicador incluye dos partes. Parte I: Las velas de colores muestran la tendencia principal Las velas de colores sirven para identificar el estado del mercado mediante las velas de colores. Como se muestra en las capturas de pantalla, si el color es Aqua, el mercado se encuentra en un estado en el que se deben realizar órdenes largas o salir de órdenes cortas. Si el color es Tomate, es el momento de realizar pedidos cortos o salir de pedidos largos. Si el color cambia, es mejor esperar a que

La intención del cuadro de mandos es ofrecer una visión rápida del rango diario, semanal y mensual de los activos configurados. En el "modo de activo único", el cuadro de mandos le muestra los posibles puntos de inversión directamente en el gráfico, con lo que las estadísticas son directamente negociables. Si se supera un umbral configurado, el cuadro de mandos puede enviar una alerta en pantalla, una notificación (a la MT4 móvil) o un correo electrónico. Hay varias formas de utilizar esta infor

Pivot Classic, Woodie, Camarilla, Fibonacci and Demark
Floor/Classic Los puntos de pivote, o simplemente pivotes, son útiles para identificar posibles niveles de soporte/resistencia, rangos de negociación, reversiones de tendencia y sentimiento del mercado al examinar los valores máximo, mínimo y de cierre de un activo. Los puntos de pivote Floor/Classic se pueden calcular de la siguiente manera. Pivot Point (P) = (High + Low + Close)/3 S1 = P * 2 - High S2 = P - (High - Low) S3 = Low – 2*(High
FREE
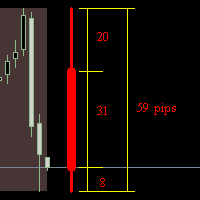
El indicador 'dibuja' una vela diaria, semanal o mensual en el gráfico actual. Muestra en puntos los tamaños de las sombras superior e inferior, el cuerpo y la vela completa. Funciona en tiempo real. Funciona en el probador de estrategias. Parámetros del indicador: How_much_to_show - cuántos bloques mostrar. Block_period - período de bloque (día / semana / mes) Shift - desplazamiento desde el borde del gráfico en barras. language - selección de idioma.
FREE

Una estrategia de puntos pivote de Forex podría ser el mejor amigo de un operador en lo que respecta a la identificación de niveles para desarrollar un sesgo, colocar stops e identificar posibles objetivos de beneficios para una operación. Los puntos pivote han sido un recurso para los operadores durante décadas. La base de los puntos pivote es que el precio a menudo se moverá en relación con un límite anterior, y a menos que una fuerza externa haga que el precio lo haga, el precio debe deteners
FREE

Este indicador separa eficazmente el volumen de ticks en el mercado de divisas en categorías alcistas y bajistas.
Además, proporciona la funcionalidad de calcular y mostrar la suma de los volúmenes de ticks alcistas y bajistas para cualquier período seleccionado de su elección.
Puede ajustar fácilmente el periodo moviendo las dos líneas azules del gráfico, lo que permite un análisis de volumen personalizable y preciso adaptado a sus necesidades de negociación.
Si lo encuentra útil, ¡sus come
FREE
Presentamos Awesome Oscillator Alert , un poderoso indicador técnico que brinda a los operadores información valiosa sobre la dinámica del mercado y las oportunidades comerciales. Con sus características integrales y su interfaz fácil de usar, este indicador es una herramienta esencial para los comerciantes que buscan obtener una ventaja en el mercado.
Una de las características destacadas de Awesome Oscillator Alert es su compatibilidad con todos los pares de divisas y plazos. Ya sea que e

El indicador Simple ICT Concepts es una potente herramienta diseñada para ayudar a los operadores a aplicar los principios de la metodología Inner Circle Trader (ICT) . Este indicador se centra en la identificación de zonas clave como los niveles de liquidez, el soporte y la resistencia, y la estructura del mercado, lo que lo convierte en un activo inestimable para los operadores de acción del precio y de conceptos de dinero inteligente. Características principales Estructura del mercado : Las e

Este indicador muestra los puntos pivote en el gráfico, incluidos los valores históricos, y admite muchos modos de cálculo para los puntos pivote y los niveles S/R. [ Guía de instalación | Guía de actualización | Solución de problemas | FAQ | Todos los productos ] Traza niveles históricos para backtesting
Permite seleccionar el marco temporal de referencia Implementa diferentes modos de cálculo de Puntos Pivote Implementa diferentes modos de cálculo de SR
Colores y tamaños personalizables
Modos
FREE

The Silent Edge of Smart Money
"Lo que cuenta no es cuánto haces, sino cuánto amor pones en lo que haces". - Madre Teresa
Dicen que el verdadero dinero del trading se hace en la sombra, donde se esconden las ineficiencias y sólo los más perspicaces sacan provecho. Ahí es exactamente donde prospera el Índice del Ladrón de Arbitraje (ATI ). Durante años, esta herramienta ha sido mi ventaja personal , identificando silenciosamente operaciones de bajo riesgo y alta recompensa antes de que la multi

Sería bueno ser siempre consciente de la "lucha" entre compradores y vendedores. Entonces sería mucho más fácil determinar la mejor dirección a seguir para no salir perdiendo. Este indicador ofrece una solución original a este problema: los valores de la oferta y la demanda se comparan con los precios Máximo y Mínimo del periodo seleccionado, tratando así de determinar el movimiento del mercado hacia el lado más fuerte sin ignorar la fuerza del lado opuesto. Todo esto se muestra en una ventana s

Indicador. Zonas de niveles de soporte y resistencia La herramienta más fiable en manos de cualquier analista técnico son los niveles de soporte y resistencia.Son estos niveles los que funcionan mágicamente en el mercado, ya que el precio rebota en ellos y, por el contrario, gana la máxima aceleración, los perfora y se esfuerza por alcanzar un nuevo punto de precio.Sin embargo, en la práctica, muchos principiantes se enfrentan a enormes dificultades para construirlos.Esto se debe al hecho de que
FREE

Este indicador es un identificador de Tendencia profesional, mide el ángulo o la pendiente de las medias móviles con diferentes métodos. Como este indicador calcula ángulos puede identificar la fuerza de la tendencia por la magnitud del ángulo. También muestra si el ángulo está aumentando o disminuyendo, lo que le da la oportunidad de obtener más información sobre la tendencia actual. Puede combinar este indicador con su estrategia como un filtro o puede utilizarlo solo para hacer su sistema de
FREE

Basado en el famoso y útil indicador - Super Trend, añadimos algunas características para hacer este indicador mucho más fácil de usar y potente. Facilidad para identificar la tendencia de cualquier gráfico. Adecuado para Scalping y Swing Mejor para usar en el mercado de tendencia tenga cuidado en el mercado lateral, podría proporcionar algunas señales falsas Ajuste : Multiplicador ATR Periodo ATR ATR Max Bars (Max 10.000) Mostrar nodo ARRIBA/ABAJO Tamaño de los nodos Mostrar señales Pull-back R
FREE

El producto Divergencia Mom Stoch Adx Osos Toros está diseñado para encontrar las diferencias entre los indicadores y el precio. Le permite abrir órdenes o establecer tendencias utilizando estas diferencias. El indicador tiene 4 características de divergencia diferentes.
Tipos de divergencia Divergencia Clase A Divergencia Clase B Divergencia Clase C Divergencia oculta
Características del producto y rec ommendaciones Hay 5 indicadores en el indicador Indicadores = Momentum Estocástico Adx Osos
FREE

¿Qué es G Force Trend? G Force Trend es un indicador de análisis técnico desarrollado para la plataforma MetaTrader 4. Analiza los movimientos de los precios para identificar la dirección de la tendencia y genera señales de compra/venta. El indicador crea un canal dinámico para seguir el comportamiento del precio dentro del canal y visualiza los cambios de tendencia. ¿Qué hace? Detección de la tendencia : Determina si el precio se encuentra en una tendencia alcista o bajista. Señales de Compra/V
FREE

Con este sistema puede detectar operaciones de alta probabilidad en dirección a tendencias fuertes. ¡Puede beneficiarse de los movimientos stop hunt iniciados por el dinero inteligente!
Información importante Cómo puede maximizar el potencial del escáner, por favor lea aquí: www.mql5.com/en/blogs/post/718109 Lea también el blog sobre el uso del indicador: Trading profesional con fuerte impulso Esta versión GRATUITA del indicador funciona sólo en EURUSD y GBPUSD. La versión completa del indicado
FREE

Indicador Institucional de Compresión de Liquidez El indicador mide el estrechamiento de la liquidez en tiempo real utilizando el ancho normalizado de las Bandas de Bollinger, el volumen y el spread promedio para identificar fases de compresión antes de rupturas de precio. Visualización:
Ventana separada de estilo profesional con histograma “Compression Score” y línea de umbral (“Threshold”). Características Clave Detección temprana: Identifica zonas de contracción antes de impulsos significati
Dominio de las señales: su ventaja en el mercado ¿Cansado de indicadores retrasados y oportunidades perdidas? Conozca Signal Mastery (Sistema EMA20-MACD) -el potente indicador sin repintado diseñado para ofrecer señales de trading de alta probabilidad justo cuando las necesita. Esto no es sólo otra herramienta MACD o EMA. Es un sistema de calidad profesional que combina de forma inteligente la EMA 20 y la lógica del MACD Crossover para señalar los puntos óptimos de entrada y salida. Lo mejor de
FREE

Algo corto pero agradable que da señales y algunas ideas para las paradas. Se utilizan cinco medias móviles para encontrar cruces y crear una zona. Todos los periodos y métodos son ajustables pero los valores por defecto ya están optimizados. Si usted tiene retrasos en la historia larga puede reducir MaxBars para que funcione más rápido. Por favor comente si necesita explicar los parámetros. También cualquier idea de mejora son bienvenidos.
FREE

GRATIS TopClock Indicador: Este indicador es un reloj analógico que muestra: Hora Local de Pc o Tiempo de Servidor de Broker o sesiones(Sydney -Tokio Londres -NuevaYork)Tiempo o Tiempo personalizado( con GMT -Base) Esto puede mostrar el tiempo de la vela Remainer con Spread en vivo. Puede ejecutar este indicador varias veces para diferentes tiempos y moverlo a diferentes lugares en el gráfico. Si lo desea, este indicador puede ser personalizado para los corredores y su IB basado en las necesida
FREE
XE Forex Strengh Indicador MT4 muestra información visual sobre la dirección y la fuerza de una señal para el par actual y los plazos elegidos (M5, M15, M30 y H1). Los cálculos se basan en múltiples factores y los resultados se muestran como un panel de color con barra de escala, valores numéricos y flechas. También se muestran los valores del precio actual y el spread del par. Se puede activar una alerta (en forma de correo electrónico o ventana emergente con sonido) para cada marco temporal d
FREE
Este indicador calcula cuánto se ha movido un símbolo en términos relativos para encontrar mercados de tendencia o planos. Muestra qué porcentaje del último rango de precios es direccional. [ Guía de instalación | Guía de actualización | Solución de problemas | FAQ | Todos los productos ] Un valor de cero significa que el mercado es absolutamente plano Un valor de 100 significa que el mercado está en tendencia total La línea azul significa que el rango de precios es saludable. La línea roja sig
FREE

Este indicador de múltiples osciladores, marcos de tiempo múltiples y símbolos múltiples identifica cuando ocurre una divergencia entre el precio y un oscilador / indicador. Identifica divergencias tanto regulares / clásicas (inversión de tendencia) como ocultas (continuación de tendencia). Tiene opciones de promedio móvil, RSI / Bollinger, ADX, barra de pines y filtro envolvente que hace posible filtrar solo las configuraciones más fuertes. Combinado con sus propias reglas y técnicas, este indi

Consulte regularmente la pestaña "Novedades" para obtener una lista completa y actualizada de todas las mejoras + parámetros. Indicador GRATUITO para mi utilidad de trading Take a Break . Este indicador le permite gestionar múltiples EAs con una sola instancia de Take a Break EA. Simplemente especifique el Grupo de Gráficos correspondiente en los ajustes del indicador(es) y del EA Take a Break y listo.
Ejemplos de configuración (Indicador + EA)
Como prerrequisito, añada la URL https://trading.
FREE

Compruebe mis herramientas pagadas que trabajan perfecto por favor valore El indicador ajustable PIN BAR es una herramienta útil que permite buscar pin bars que desea encontrar en el gráfico de precios, tiene 2 parámetros para filtrar qué tipo de pin bars desea buscar: 1) MinTailProc 75% (por defecto) que significa mostrar pin bars que tienen un tamaño mínimo de la Nariz (Cola) como 75% del tamaño completo de la vela. Si el tamaño de la Nariz Superior (Cola) de la vela es mínimo 75% del tamaño t
FREE

Sincronizar objetos de un gráfico a varios gráficos. Sincronizar objetos de un gráfico a múltiples gráficos. 1. Permite la sincronización automática de objetos nuevos y editados a otros gráficos. 2. Permite sincronizar todos los objetos del gráfico con otros gráficos en el momento actual. 3. Permite configurar los gráficos a sincronizar en función de la posición del gráfico en la ventana de MT4. Versión 1.2: Permite establecer una lista de nombres de objetos que no desea sincronizar (Separados
FREE

¿Qué es el ADR? En pocas palabras, el ADR (Average Daily Range) es la media del movimiento del precio durante un período de tiempo. Puede utilizarse como indicador de la distancia que puede recorrer el precio en un día determinado de negociación. Este indicador calcula 5, 10, 20 Average Daily Range Características: - Promedio: Rango Diario, Prev 1/5/10/20 días - Calculadora de stop loss/objetivo de beneficio máximo por porcentaje de Riesgo/Recompensa del ADR en Pips. - Cuenta atrás de velas - .
FREE
HTF Power of Three (ICT) - Indicador MT4 Visión general El indicador HTF Power of Three es una implementación profesional del concepto Power of Three del Inner Circle Trader (ICT), inspirado por Larry Williams. Este indicador visualiza en tiempo real el desarrollo de velas en un marco temporal superior (HTF) en cualquier gráfico de un marco temporal inferior, lo que lo convierte en una herramienta esencial para los operadores ICT que estudian los patrones de movimiento de los precios institucion
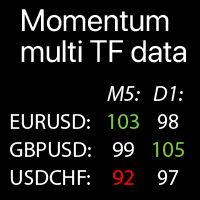
Valores de Momentum en múltiples marcos de tiempo para los Símbolos seleccionados: compare las tendencias actuales del mercado El indicador muestra los valores del indicador Momentum de todos los marcos de tiempo y Símbolos seleccionados en una sola tabla, lo que permite analizar rápidamente las tendencias actuales del mercado.
Mi utilidad multifuncional : 66+ funciones | Contácteme para cualquier pregunta | Versión para MT5 Cada Símbolo puede personalizarse: eliminarse / reemplazarse
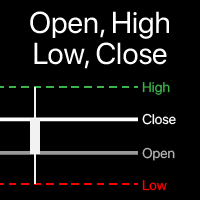
Visualización de los niveles Open, High, Low, Close en el gráfico Puede elegir cualquier marco temporal , no solo el actual . El desplazamiento de la barra calculada se puede ajustar : la barra actual (flotante), o un número fijo de barras anteriores . Utilidad multifuncional : incluye 66+ funciones | Contácteme si tiene alguna pregunta | Versión para MT5 En la configuración del indicador, puede ajustar: Desplazamiento de la barra

Indicador de Fuerza del Toro y del Oso Actualización 1.3
El indicador de Toro y Oso ahora incluye un perfil de volumen incorporado para detectar las áreas de mayor volumen dentro de un rango de barras dado. Esto se puede modificar aún más según tus propios ajustes y preferencias para la detección experta de la fuerza del toro y del oso con el mayor volumen.
Esto ayuda para: Detección temprana y oportunidades de entrada precisa Detección de reversales Detección de retrocesos Visión general:
El

El indicador Heikin Ashi es nuestra versión del gráfico Heikin Ashi. A diferencia de los productos de la competencia, este indicador ofrece amplias opciones para calcular las velas Heikin Ashi. Además, se puede mostrar como una versión clásica o suavizada.
El indicador puede calcular Heikin Ashi con media móvil mediante cuatro métodos: SMA - Media móvil simple SMMA - Media móvil suavizada EMA - Media móvil exponencial LWMA - Media móvil ponderada lineal
Características principales El indicado
FREE
¿Qué es el indicador ADX_DI? ADX_DI es un indicador de análisis técnico avanzado desarrollado para la plataforma MetaTrader. Combina los componentes del Índice Direccional Medio y del Indicador Direccional para analizar la fuerza y la dirección de la tendencia del mercado. ¿Qué hace? Mide la fuerza de la tendencia : La línea ADX muestra la fuerza de las tendencias del mercado Determina la dirección : Las líneas DI+ (verde) y DI- (roja) identifican la dirección de la tendencia. Detecta cambios de
FREE

Este INDICADOR DOJI BAR FINDER automatizado puede utilizarse para gestionar operaciones e identificar posibles zonas de soporte y resistencia tanto para comprar como para vender. Está diseñado para identificar zonas para operaciones de venta/compra y puede utilizarse eficazmente junto con otros indicadores, como indicadores de bloque de órdenes, etc. Actualmente diseñado para MT4, más adelante se adaptará para funcionar en MT5. También ofrecemos la oportunidad de personalizar el robot de acuerdo
FREE
Indicador ADX utilizado en el método de las Agujas de Didi que te facilitará mantenerte en la operación, mientras esté azul no necesitarás mirar otras señales para salir de la operación y por el contrario mientras esté amarillo mantendrás la venta. Todo de forma rápida y visual. ¡¡¡¡El indicador ADX muestra si hay una tendencia en el mercado, este indicador usado junto con las agujas es la combinación perfecta para surfear fuertes movimientos de mercado!!!!
FREE

El indicador dibuja canales de precios. Puede personalizarse para que sólo se muestren canales de compra o de venta. También se pueden mostrar líneas de tendencia en lugar de canales. Este indicador es fácil de usar, pero sin embargo, hay muchas estrategias de trading basadas en el trading de canales. Asesor basado en este indicador: https: //www.mql5.com/en/market/product/37952 Parámetros Historial - número máximo de barras para construir canales; Distancia - distancia mínima de un Máximo (o Mí
FREE
Advanced UT BOT ALERTS for MT4 Sistema profesional de detección de tendencias con múltiples filtros | Motor UT BOT mejorado Solo ofrecemos indicadores de alta calidad. Advanced UT BOT está diseñado para uso profesional, con una lógica de señales estable y un cálculo seguro que evita retrasos o actualizaciones erróneas.
No redibuja, elimina ni modifica las señales pasadas.
Todas las señales BUY y SELL se generan solo después del cierre de la vela , garantizando estabilidad y precisión.
En el trad
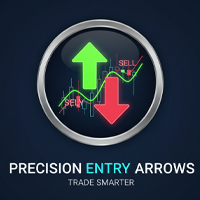
Flechas de Entrada de Precisión: ¡No vuelva a perderse una operación de alta probabilidad! Deje de adivinar y empiece a operar con confianza. El indicador Precision Entry Arro ws es una sofisticada herramienta todo en uno diseñada para ofrecer señales de compra y venta de alta calidad y sin repintado directamente en su gráfico. Combina de forma experta el poder del MACD , el Estocástico y una Cruz EMA 5 única para señalar los momentos exactos de entrada , y luego filtra todo a través de una EMA
FREE
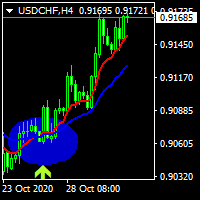
hola queridos hoy escribo un indicador de cruce de 2 medias móviles y mostrar una etiqueta para las señales de la misma . ....................... usted puede seleccionar el período de movimientos y el método de mover............... ......................y también el método de aplicar el precio y ver los movimientos y señales.................. ................también puede desactivar la visualización de los movimientos para ver sólo las etiquetas de señal.......................... ...............
FREE

TrendBite v1.5 - Indicador profesional de seguimiento de tendencias Desarrollador: 8aLt4 Versión: 1.5 Plataforma: MetaTrader 4
Descripción general TrendBite v1.5 es un indicador de análisis técnico avanzado diseñado para detectar cambios de tendencia en el mercado y proporcionar a los inversores señales claras de compra y venta. Basado en el algoritmo de las bandas de Bollinger, esta herramienta detecta con precisión los cambios de tendencia y es ideal tanto para principiantes como para trade
FREE

está diseñado para mejorar la representación visual de los gráficos financieros en MetaTrader 4 mediante la alteración dinámica de los colores de varios elementos gráficos, incluyendo velas, barras, gráficos de líneas y barras de volumen. Su objetivo principal es mejorar la intuición del operador y el compromiso durante el análisis del mercado mediante la introducción de transiciones de color suaves y cíclicos que pueden poner de relieve los cambios de impulso, las tendencias o la volatilidad s
FREE

Easy Scalp System Pro: ¡Nunca más se pierda una entrada! ¿Está cansado de complejas configuraciones de trading que le dejan adivinando? Le presentamos el Easy Scalp System Pro, su herramienta definitiva de alta precisión para obtener beneficios rápidos en cualquier mercado. Este poderoso indicador combina lo mejor de la confirmación de tendencia (EMAs Múltiples) y la sincronización de impulso (MACD) en flechas de Compra y Venta claras y sin repintado directamente en su gráfico. Está diseñado pa
FREE
El Multi-Oscillator es la navaja suiza definitiva para el comercio de múltiples monedas y marcos temporales. Traza su oscilador deseado para muchos pares de divisas y / o marcos de tiempo en un solo gráfico. Se puede utilizar para negociar el arbitraje estadístico, como una herramienta de evaluación del mercado o como un indicador de marco de tiempo múltiple refinado. [ Guía de instalación | Guía de actualización | Solución de problemas | FAQ | Todos los productos ] Fácil interpretación y confi
FREE

Alquimista de Tendencias: Convierta el caos del mercado en oro comercial ¿Está cansado de señales contradictorias y de quedar atrapado en el lado equivocado de la tendencia? El indicador Trend Alchemist corta el ruido para ofrecerle puntos de entrada y salida claros y de alta probabilidad. Este potente sistema combina el filtrado fiable de tendencias de las Medias Móviles Exponenciales Múltiples (EMA) con la sincronización precisa del Oscilador Estocástico . No sólo le muestra la tendencia, sin
FREE
El Mercado MetaTrader es la única tienda donde se puede descargar la versión demo de un robot comercial y ponerla a prueba, e incluso optimizarla según los datos históricos.
Lea la descripción y los comentarios de los compradores sobre el producto que le interese, descárguelo directamente al terminal y compruebe cómo testar el robot comercial antes de la compra. Sólo con nosotros podrá hacerse una idea sobre el programa, sin pagar por ello.
Está perdiendo oportunidades comerciales:
- Aplicaciones de trading gratuitas
- 8 000+ señales para copiar
- Noticias económicas para analizar los mercados financieros
Registro
Entrada
Si no tiene cuenta de usuario, regístrese
Para iniciar sesión y usar el sitio web MQL5.com es necesario permitir el uso de Сookies.
Por favor, active este ajuste en su navegador, de lo contrario, no podrá iniciar sesión.