Indicadores técnicos para MetaTrader 4 - 34

El propósito de esta nueva versión del indicador estándar de MT4 proporcionado en su plataforma es mostrar en una sub-ventana múltiples marcos temporales del mismo indicador. Vea el ejemplo que se muestra en la imagen de abajo. Pero la visualización no es como un simple indicador MTF. Esta es la visualización real del indicador en su marco de tiempo. Aquí están las opciones disponibles en el indicador FFx: Seleccione los marcos de tiempo a mostrar (M1 a Mensual) Definir el ancho (número de barra
FREE

Índice Dinámico de Traders (TDI) Señal Parámetros de entrada: modo de señal: ajústelo a true si desea conectarlo a STAT (Signal Tester y Trader) desplazamiento de flecha: distancia entre la línea de EMA rápida y la flecha del gráfico filtro de banda media filtro de línea de precio periodo RSI método de precio RSI Periodo de volatilidad Periodo MA 1 Periodo MA 2 Método de promediación Usted puede encontrar la mejor configuración para 4 horas EURUSD en este video
FREE

Cruz indicador de líneas de tendencia indicador de tendencia de encontrar. Este indicador, una serie de obras mediante el uso de una serie de indicador y algoritmo. Utiliza dos líneas para encontrar tendencias. La intersección de esta línea significa que el inicio de la tendencia. Estas líneas son de color verde, tienden a subir. Las líneas rojas indican la tendencia a la baja. El uso de este indicador es fácil de entender. Este indicador por sí solo o puede utilizar otros indicadores que son ap
FREE
Este indicador destaca los puntos exactos del gráfico en los que el indicador ZigZag integrado repintó sus máximos o mínimos. Se trazan flechas de color gris para mostrar dónde se desplazó posteriormente un máximo o un mínimo previamente confirmado, un comportamiento conocido como repintado . Por qué es importante:
El repintado puede inducir a error a los operadores al alterar las señales históricas, dando una falsa impresión de exactitud en el pasado. Esta herramienta ayuda a los operadores a
FREE

El indicador BB Arrows MTF se basa en el indicador de las Bandas de Bollinger . Representa las señales de entrada en forma de flechas. Todas las señales se generan en la barra actual. ¡ En 2 modos, las señales no se vuelven a dibujar (Excepción de saltos muy bruscos)! Todas las señales en el modo MTF corresponden a señales del periodo especificado en MTF. Su uso se simplifica al máximo tanto para operar con un solo indicador como para utilizar el indicador como parte de sus sistemas de trading.
FREE

¡Conquiste el mercado con Velocity Crossover ! Deje de adivinar y empiece a operar con confianza . El indicador Velocity Crossover es su poderosa herramienta para señalar entradas y salidas de alta probabilidad, combinando lo mejor de las Medias Móviles (MA) y el impulso MACD en señales de trading cristalinas. Este no es sólo otro indicador de media; es un motor de confirmación inteligente . Espera a que el precio cruce una MA clave y luego cruza referencias de ese movimiento con el poderoso ca
FREE

Por favor, póngase en contacto conmigo en telegrama https://t.me/smartforex7 Después de comprar SmartForex Indicador a continuación, utilizar este indicador ...................... SMART EXIT PROFIT LINE Indicador es muy útil con SmartForex Indicador ........................................ SMART EXIT PROFIT LINE Indicador Adjuntar con SmartForex Indicador después de entonces la línea roja muestra la salida de compra de beneficios, la línea verde muestra la salida de venta de beneficios.........
FREE

Panel de control MACD Este indicador le ayuda a escanear los símbolos que se encuentran en la ventana Market Watch y filtrar una tendencia según MACD.
La divergencia de convergencia de la media móvil (MACD) es un indicador de impulso que sigue la tendencia y muestra la relación entre dos medias móviles del precio de un valor. El MACD se calcula restando la media móvil exponencial (EMA) de 26 períodos de la EMA de 12 períodos.
El resultado de ese cálculo es la línea MACD. Una EMA de nueve
FREE

Zentrade es tu paso al nivel profesional. Es un indicador que te brinda consistencia, claridad y precisión para que operes con confianza, sabiendo que tu señal no desaparecerá y tu lógica se mantendrá intacta.
Sin recalcular. Nunca. Las señales de COMPRA y VENTA se generan instantáneamente en la vela actual y son permanentes. Lo que ves es la realidad.
Lógica inalterada. Las señales pasadas no se eliminan ni se modifican. Puedes analizar el historial con total confianza en que tus prueb
FREE

(traducción de Google) Este indicador implementa el " Promedio Verdadero Rango (ATR) " desarrollado por John Welles Wilder Jr. , como se describe en su libro: Nuevos conceptos en sistemas técnicos de comercio [1978] . Utiliza el promedio móvil de Wilder , también conocido como promedio móvil suavizado (SMMA) , en lugar de un promedio móvil simple (SMA) como se usa en el indicador ATR incorporado de MetaTrader . El período predeterminado aplicado es 7, en lugar de 14, según la descripción en su l
FREE

El indicador TLR es un indicador de identificación de tendencias de mercado. La idea de este indicador es utilizar 3 líneas de regresión lineal, una a corto plazo, otra a medio plazo y otra a largo plazo. La TENDENCIA ALCISTA se determinará cuando La línea de regresión lineal a largo plazo y la línea de regresión lineal a medio plazo tienen una tendencia alcista. La línea de regresión lineal a largo plazo tiene una tendencia alcista, la línea de regresión lineal a medio plazo tiene una tendencia
FREE

Descarga los datos que faltan para todos los pares de divisas disponibles en Market Watch. Muy útil para realizar pruebas retrospectivas de EA y estrategias y descargar todo el historial a la vez en lugar de individualmente. El indicador se ejecutará hasta que se hayan descargado todos los datos históricos de los pares de divisas seleccionados. El indicador tiene múltiples opciones: 1. Descargar datos para un solo par 2. Descargar solo para el par actual 3. Descargar para parejas seleccionadas 4
FREE

Ultimate Super Rejection Zones es un indicador avanzado diseñado para detectar automáticamente las zonas críticas del mercado , como el máximo y el mínimo del día , y mostrar flechas de rechazo precisas cada vez que el precio reacciona con fuerza en esas áreas.
Combina acción del precio, niveles diarios y un sistema de confirmación basado en dos estocásticos (H1 + M5) para ofrecer señales claras, limpias y de alta probabilidad. Ideal para traders intradía, scalpers y swing traders que buscan señ

Este indicador está diseñado para detectar las mejores divergencias entre precio/MACD y precio/RSI. MACD y RSI producen con mucho las mejores señales de divergencia por lo tanto este indicador se centra en esas dos divergencias. Esta es la versión GRATUITA del indicador: https://www.mql5.com/en/market/product/28375
Información Importante Cómo puede maximizar el potencial del escáner, por favor lea aquí: www.mql5.com/en/blogs/post/718074
La versión gratuita sólo funciona con EURUSD y GBPUSD. Es
FREE

Los Cuatro Pilares: Su centro de operaciones todo en uno ¿Cansado de hacer malabarismos con múltiples indicadores y de perder entradas perfectas? Los Cuatro Pilares es la solución definitiva, la fusión de cuatro herramientas de análisis de mercado probadas en un indicador potente y fácil de usar. Obtenga señales de compra y venta cristalinas y de alta convicción directamente en su gráfico, filtradas para obtener la máxima precisión. Deje de adivinar y empiece a operar con confianza. Principales
FREE

Indicador que debe colocarse en la misma carpeta que Dash para activar el filtro de alertas con Heiken Aish. Después de descargar el indicador, cópielo en la misma carpeta para que Dash pueda leer el indicador. No es necesario insertarlo en el gráfico, esto es sólo para que Dash busque señales e informe la dirección de compra y venta del Indicador. Comprueba si la ruta del indicador es correcta dentro de Dash.
FREE

Indicador que muestra la ruptura tras al menos X velas del mismo signo, seguidas de una vela opuesta. PARÁMETROS: BARRAS A MOSTRAR = Historia de los Indicadores (0 = todas las barras) Barras Consecutivas para Breakout = Cuántas Barras de la misma dirección y después una Barra con dirección opuesta Punto Mínimo entre H/L = Para considerar válida una barra, debe tener un valor Mínimo Hi/Lw Punto Mínimo entre O/C = Para considerar válida una barra, debe tener un valor Mínimo de Apertura/Cierre Los
FREE

El RSI Estocástico (StochRSI) es un indicador técnico que combina las características del Índice de Fuerza Relativa (RSI) con el Oscilador Estocástico, dando como resultado una herramienta más sensible que genera un mayor número de señales de trading. Desarrollado por Tushar Chande y Stanley Kroll, el indicador fue diseñado para superar una limitación percibida del RSI tradicional: la baja frecuencia de activación de los niveles de sobrecompra y sobreventa (comúnmente 80 y 20), especialmente en
FREE

Este indicador mostrará el mínimo de la semana y del mes, muy útil para entender el sentimiento del mercado. Para operar dentro del rango / romper. Bajo- puede actuar como soporte- puede usarse para retroceder o romper. Alto- puede actuar como resistencia- puede usarse para retroceder o romper. La estrategia de ruptura se refiere a la técnica de negociación diaria que ofrece a los operadores múltiples oportunidades para ir en largo o en corto . La idea principal es identificar la tendencia en su
FREE

Circle Rising Point" es un indicador basado en la teoría de los ciclos. No importa si su ciclo de negociación es corto o largo, puede utilizar este indicador para encontrar los puntos de subida y bajada de diferentes ciclos y diferentes bandas. Por lo tanto, las señales que se le muestran en gráficos de diferentes ciclos son diferentes, y aplicables a las operaciones del lado izquierdo. Se recomienda utilizar este indicador junto con la ventana multiciclo para el análisis. Introducción del indic
FREE

El Scaled Awesome Oscillator (SAO) representa una adaptación refinada del Awesome Oscillator, cuyo objetivo es establecer puntos de referencia coherentes para identificar las aristas del mercado. A diferencia del Awesome Oscillator estándar, que registra la variación en pips a través de diferentes materias primas, el único punto de referencia invariable es la línea cero. Esta limitación impide a los inversores y operadores señalar niveles específicos para los cambios o continuaciones de tendenci
FREE

Oscilador 5/35 para ser utilizado con nuestro Indicador de Onda de Elliott como parte de la estrategia global de trading de la 5ª onda. El conjunto de indicadores de ondas de Elliott está diseñado en torno a una estrategia simple pero eficaz Swing Trading. El conjunto de indicadores es ideal para el comercio de acciones, futuros y divisas en múltiples marcos temporales. Puede encontrar el principal Indicador de Onda de Elliott aquí https://www.mql5.com/en/market/product/44034
FREE

La idea del indicador es muy simple y es probable que sea útil para aquellos que utilizan un gráfico de líneas para el análisis técnico. Este indicador fue escrito con el fin de eliminar las "irregularidades" (-: del gráfico de líneas). La línea del gráfico conecta los precios de cierre de las velas, como en un gráfico lineal clásico, pero ignora los precios que fueron en la dirección de la línea y un nuevo extremo se produce sólo cuando el precio de cierre de la última vela es claramente inferi
FREE
Powered by SVX Strategies Quant Team Este indicador es una herramienta interna de SVX Strategies para el análisis de volatilidad. Lo hacemos público de forma gratuita. ¿Busca Resultados Automatizados?
Si prefiere una operativa gestionada por nuestro equipo sin errores manuales, puede copiar nuestras señales oficiales en MQL5: Copiar "Friday Pulse" (Conservadora) Copiar "SVX AI Systems" (Alto Rendimiento) SOBRE ADAPTIVE RSI BANDS
A diferencia del RSI tradicional, este indicador ajusta las banda
FREE
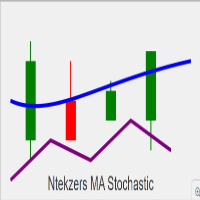
Por favor, recuerde dejar una reseña para mejoras gracias Resumen de las principales funciones: Condiciones de la señal de compra : La línea principal del oscilador estocástico cruza por encima de la línea de señal. El precio de cierre de la vela actual es superior al de la vela anterior. El precio de cierre actual está por encima de la EMA (Media Móvil Exponencial). El valor del estocástico es inferior a 50. Cuando se cumplen estas condiciones, se traza una flecha de compra y se activan las ale
FREE

Este indicador determina la volatilidad del precio utilizando la correlación entre el precio y el tiempo. ADVERTENCIA: No es adecuado para el marco de tiempo 1M, ¡no verá ninguna línea en este marco!
Como usarlo:
Cuanto más se acerque el valor del indicador a 0, el precio se considera más volátil. Cuando se inicia una reversión, el valor del indicador aumenta o disminuye significativamente. Durante una tendencia fuerte, el valor del indicador estaría más cerca de 1 o -1, depende de la tendencia
FREE

Concepto
El Mercado ordena en el Tiempo las Fases venideras en función de los Resultados actuales de su Interés. Las Modulaciones Directivas son una Interacción de Períodos inmanentes, que muestran en Referencia a la Actividad cíclica en el Tiempo y a la Actividad de Nivelación de Precios. SensorMap es una Máscara de Volumen reflectante de este Concepto de Tiempo y Precio y repartiendo los Movimientos de Precios desarrollados en un 100 % igualado - Rango: ¿cuánto se movió? indicando su Estado m
FREE

BillWill El indicador se basa en materiales extraídos del libro: Bill Williams. Caos comercial. Técnicas expertas para maximizar los beneficios. Las lecturas del indicador en la parte superior de cada barra se calculan en función de la posición de los precios de apertura y cierre en relación con un tercio de la barra. La barra está dividida en tres partes, el tercio inferior de la barra es el número tres (3), el tercio medio de la barra es el número dos (2), el tercio superior de la barra es e
FREE
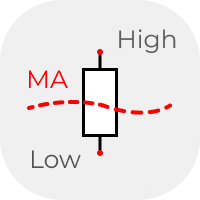
La idea clásica de comparar el tamaño de las velas. Por encima / por debajo - la media de un período determinado. Por lo general se utiliza en D1, W1 y marcos de tiempo más altos en los patrones de análisis de velas. Pero también puede utilizar los datos del indicador en su sistema de análisis. Los datos se presentan como un histograma en una ventana separada. El método de promediación se puede seleccionar en la configuración.
FREE

Dynamic MA Trend Zone - Zona de Tendencia de la Media Móvil Dinámica
El Dynamic MA Trend Zone es un indicador visualmente atractivo que rastrea dinámicamente los cambios en las tendencias del mercado. Al mostrar las medias móviles en tres niveles de precios diferentes (cierre, máximo y mínimo), crea una zona de tendencia codificada por colores que indica claramente la dirección y la fuerza de la tendencia.
Características y funciones :
- Codificación por colores de la dirección de la tendenc
FREE
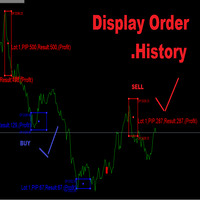
Mostrar historial de órdenes Intentar operar.
Botón Marcar - Rojo : Orden de VENTA - Azul : Orden COMPRAR
Botón Lote - Ej. (Lote : 0.01)
Botón Profit,Lost - Ej. (Beneficio:1,Perdida:-1) Botón PIP - Ej. (PIP:100) Botón Abrir,Cerrar - Ej. Abrir:3300,Cerrar:3301 VLine M30,H1,H4,D1 IMport CSV Botón Todos Botón Resumen M30,H1,H4,D1 Beneficio,Perdido Número Orden _____________ Empezar a operar Mostrar en gráfico ____________
FREE
CUADRO DE INDICADORES ADELANTADOS Y ATRASADOS https://www.mql5.com/en/users/earobotkk/seller#products P/S: Si te gusta este indicador, por favor califícalo con 5 estrellas en la sección de comentarios, esto aumentará su popularidad para que otros usuarios se beneficien de su uso.
Este dashboard escanea todos los marcos de tiempo(M1,M5,M15,M30,H1,H4,D1,W1,MN1) y muestra la tendencia alcista y bajista para MACD, PSAR, RSI, STOCHASTIC, MOVING AVERAGE, BOLLINGER BANDS cambiando los colores de las ca
FREE

Este indicador muestra ratios entre extremos en el gráfico. Puede especificar sus propios ratios (por ejemplo, Fibonacci).
Parámetros Más importantes Densidad - cuanto en detalles buscar ratios en extremos. Un número mayor significa menos detalles, un número menor significa más detalles. La unidad base es 1 barra en el gráfico. Historia - hasta dónde ir en la historia mientras se busca. Cuando se establece -1, el indicador procesa todas las barras del historial. La unidad base es 1 barra del gr
FREE

La media móvil adaptativa (AMA), creada por Perry Kaufman, es una variación de la media móvil diseñada para tener una baja sensibilidad al ruido y la volatilidad del mercado, combinada con un desfase mínimo para la detección de tendencias. Estas características la hacen ideal para identificar la tendencia general del mercado, cronometrar los puntos de inflexión y filtrar los movimientos de los precios. Un análisis detallado de los cálculos para determinar la AMA se puede encontrar en MetaTrader
FREE

Dé rienda suelta a la precisión con Fusion Multi-Trend Pro ¿Está cansado de señales contradictorias y oportunidades perdidas? Le presentamos Fusion Multi-Trend Pro, el indicador diseñado para eliminar el ruido del mercado y ofrecer puntos de entrada y salida de alta convección. No se trata de un indicador más, sino de un asistente de negociación unificado que fusiona el poder del impulso, la tendencia y la volatilidad en una señal clara y decisiva. Ventajas clave: Por qué necesita Fusion Multi-
FREE

Broker recomendado para utilizar el indicador: https://tinyurl.com/5ftaha7c Indicador desarrollado por Diogo Sawitzki Cansi para mostrar posibles puntos de comercio. No repinta. Los resultados mostrados en el pasado son exactamente lo que sucedió. También lo utilizamos para mantener las operaciones más tiempo y no salir en falsas señales de reversión que en realidad son sólo una toma de beneficios de las operaciones y nadie está tratando de invertir la dirección de la tendencia. Parámetros del I
FREE

Comb El indicador muestra una cuadrícula de panal o un hexágono regular. Alternativa a la red de terminales comerciales estándar. Descripción de la configuración del indicador: color_comb - color de la cuadrícula ancho - ancho, ejemplo: 22 para una pantalla con una resolución de 1920 * 1080, 15 para una pantalla con una resolución de 1366 * 768, etc. altura - altura, por ejemplo: 6 para una pantalla con una resolución de 1920 * 1080, 4 para una pantalla con una resolución de 1366 * 768, etc.
FREE
What is so remarkable about the Nema general PRT indicator? It calculates all known derivatives of "EMA" (you know some: DEMA - or, more simply, EMA of the 2nd depth level, TEMA - EMA of the 3rd depth level...DecEMA ...and so you can dive into your research up to level 50...) If you set the depth = 1, then it will be an analogue of "EMA"; I repeat - depth 2 = "DEMA"; depth 3 = "TEMA"...Experiment - check the behavior of the created average at other depths. The indicator also has the abili
FREE
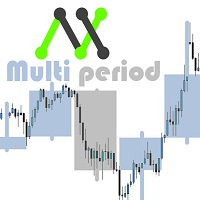
Con este indicador personalizable podrás observar otros timeframes además del habitual. De esta forma conocerás mejor el entorno general en el que se mueve el precio y probablemente así será mejor tu efectividad. *Es importante que el timeframe en el indicador sea mayor que el establecido en Metatrader. Muy pronto compartiré más indicadores gratis. Si tienes alguna idea específica de un indicador que desees tener puedes escribirme directamente un mensaje privado. Se aceptan opiniones, críticas,
FREE

AHORA PUEDE DESCARGAR VERSIONES GRATUITAS DE NUESTROS INDICADORES DE PAGO . ES NUESTRA FORMA DE RETRIBUIR A LA COMUNIDAD. >>> IR AQUÍ PARA DESCARGAR
V1 Scalper es una herramienta fácil de usar diseñada para el scalping de tendencia. Trata de detectar buenos puntos de entrada en una tendencia importante mediante el swing de máximos y mínimos formados a lo largo de la tendencia. Esta herramienta se puede utilizar en pares de divisas, índices, materias primas y acciones. No es frecuente, pero en
FREE

...................................................................................................................... ............rsi................ ...........................................rsi para tiempos M30 y D1............................................. ...............................casi todo el mundo utiliza rsi en 1 marco de tiempo pero.............................. ..................................cuando tenemos 2times rsi lo que puede ver ................................... escr
FREE

Tener que comprobar constantemente si su CCI ha alcanzado un nivel específico puede resultar tedioso y agotador en ocasiones, especialmente si tiene que supervisar diferentes clases de activos a la vez. El indicador Alert CCI le ayudará en esta tarea, asegurándole que obtiene el máximo con poco esfuerzo. Cuando los valores del CCI lleguen a un nivel especificado, se activarán las alertas, en el gráfico, en la aplicación de teléfono de MT4 o por correo electrónico (puede recibir mensajes de texto
FREE

Simple Candlestick Timer - Indicador MT4 gratuito Simple Candlestick Timer es un indicador MT4 ligero y fácil de usar que muestra una cuenta atrás precisa hasta el cierre de la vela actual. Esta herramienta ayuda a los operadores a mejorar el tiempo, la disciplina y la toma de decisiones, mostrando exactamente cuánto tiempo queda antes de que comience la siguiente vela. Características principales: Cuenta atrás limpia directamente en su gráfico. Ayuda con el tiempo de entrada y salida. Ligero, s
FREE

Indicador de líneas verticales en los marcos temporales М5 y М1. Dibuja las líneas para el período del día actual y el día anterior. Este indicador muestra visualmente al trader el comienzo y el final de la hora del gráfico, así como los periodos horarios pasados, intervalos de 30 minutos y 5 minutos del gráfico. La ventaja que ofrece este indicador es que el operador que lo utilice en un gráfico de un par de divisas con el marco temporal más pequeño siempre sabrá cuándo comienza la nueva hora.
FREE

TrendFinder VolumeI son velas de colores que muestran la tendencia basada en el Volumen y la Pendiente de la Tendencia
Este indicador le dará el cambio de color en la siguiente barra en la vela de confirmación y nunca se repintará Verde lima = Posible compra (Volumen al alza), Verde cerceta = Alcista débil (Volumen a la baja), Rojo = Posible venta (Volumen al alza) , Naranja = Bajista débil (Volumen a la baja) .
TrendFinder Volume está optimizado para operar en cualquier mercado y para ser util
FREE

Después de 7 años, he decidido publicar algunos de mis propios indicadores y EA de forma gratuita.
Si los encuentras útiles, por favor ¡Muestra tu apoyo con una valoración de 5 estrellas! Tus comentarios mantienen llegando las herramientas gratuitas. Ve también mis otras herramientas gratuitas y mi señal en vivo aquí aquí
_________________________________ Detector de Engulf - Indicador de Trading Simplificado Descubre el Detector de Engulf, una herramienta directa creada en MQL
FREE

El Indicador Acelerador ATR le informa sobre los movimientos fuertes de los precios basándose en el Indicador ATR. Este indicador funciona para todos los marcos de tiempo y símbolos, la fuerza de los movimientos se puede configurar.
Importante: Infórmate sobre nuevos Productos, únete a nuestro Canal MQL: h ttps:// www.mql5.com/en/channels/etradro
Uso Este Indicador funciona para todos los Timeframes y Símbolos, la fuerza de los movimientos puede ser configurada. Características Funciona en to
FREE

El RSI tradicional es uno de los indicadores más populares y conocidos que todos los operadores utilizan. En esta combinación, utilizamos dos periodos RSI con un factor suavizado para suavizar las líneas RSI y obtener mejores resultados. Además, en la parte inferior del indicador se muestra el filtro de tendencias en diferentes colores para que los operadores puedan identificar las tendencias con mayor facilidad. Gris : Mercado lateral Azul claro : Tendencia débil al alza Azul : Fuerte tendencia
FREE

Es un simple indicador de tick del precio Bid y Ask. El separador del período (1 minuto) se muestra en forma del histograma. Parámetros Price_levels_count - número de niveles de precio a mostrar. Bar_under_calculation - número de barras del indicador mostradas en el gráfico.
FREE

Candlestick Oscillator es un Oscilador verdaderamente único que utiliza los conceptos de dentro del comercio de velas llamado Record Session High. Este es un método de análisis de velas para medir cuando una tendencia podría estar desgastándose y por lo tanto lista para una reversión o pausa. Llamamos a una sesión récord alta cuando tenemos 8 o más velas anteriores que tienen cierres más altos. Se habla de mínimo histórico de la sesión cuando hay 8 o más velas anteriores con cierres más bajos.
FREE

ATR on Prices es simplemente un indicador que muestra líneas para Soporte y Resistencia, restando o sumando el valor del ATR a partir de una referencia que puede ser fija, con el precio de apertura de la vela diaria o móvil con el precio medio (H+L/2) o agregado desde el máximo y mínimo del día. También puede escojer entre aplicar todo el rango del ATR o solo la mitad (referido como Medium en la propiedad Range del indicador). Usted puede cambiar el número de períodos para calcular el ATR diari
FREE

Para la versión Multi Time Frame, haga clic aquí. BASE TRADING SYSTEM es una herramienta útil para operar con una estrategia simple. Dibuja automáticamente la base hacia arriba para el comercio a largo y la base hacia abajo para el comercio a corto. Borrar el comercio cuando la base va en dirección opuesta. El usuario puede operar por la entrada instantánea en el mercado o por la entrada de órdenes pendientes. Depende de la mejor estrategia del usuario. entrada: Base Box Color- UP base box , DOW
FREE
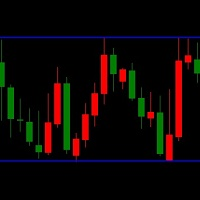
LT Triple Support Resistance Screen Method es un tipo de indicador de niveles que consta de tres líneas SR. Es construido por el lenguaje de programación MQL4 y puede ser utilizado para la plataforma MT4. Un indicador de versión gratuita para determinar los niveles de soporte y resistencia fácilmente . Este indicador funciona basado en el método de pantalla para calcular el valor más apropiado para cada tope. Un complejo algoritmo basado en una larga investigación se aplica a este indicador pers
FREE

El propósito de esta nueva versión del indicador estándar de MT4 proporcionado en su plataforma es mostrar en una sub-ventana múltiples marcos temporales del mismo indicador. Vea el ejemplo que se muestra en la imagen de abajo. Pero la visualización no es como un simple indicador MTF. Esta es la visualización real del indicador en su marco de tiempo. Aquí están las opciones disponibles en el indicador FFx: Seleccione los marcos de tiempo a mostrar (M1 a Mensual) Definir el ancho (número de barra
FREE

El indicador calcula la velocidad media de los precios durante el periodo de tiempo especificado. Se sabe que el tiempo de negociación fluye de forma irregular, en ráfagas. O bien se acelera, o bien se ralentiza. Este indicador le dirá si el tiempo de negociación se ha acelerado y es necesario ir a los marcos de tiempo más pequeños para buscar señales de comercio.
Uso La alerta se genera cuando la velocidad del precio supera el umbral especificado. El valor del umbral puede modificarse mediante
FREE

Indicador MetaTrader que detecta WRBs (Wide Range Bodies/Bars) y Gaps Ocultos.
WRB Hidden Gap El indicador de MetaTrader detecta WRB y lo marca. WRB puede ser una Barra de Rango Amplio (una barra muy grande) o un Cuerpo de Rango Amplio (una vela que tiene un cuerpo muy largo). WRB por sí solo no proporciona mucha información por lo que el indicador utiliza WRB para detectar Gaps Ocultos. El indicador también muestra los Gaps Ocultos llenos y sin llenar de una manera diferente, haciendo más fác
FREE
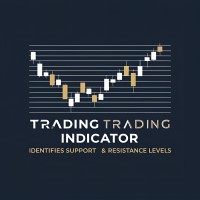
Indicador Price Grid Navigator
El Price Grid Navigator es una potente e intuitiva herramienta de trading diseñada para ayudar a los traders a identificar dinámicamente los niveles clave de soporte y resistencia. Proporciona señales visuales claras para posibles puntos de entrada, salida y zonas de reversión, convirtiéndose en una herramienta esencial para traders de todos los niveles de experiencia. Al calcular y graficar dinámicamente estos niveles, el indicador ofrece una representación visua
FREE

Las tendencias son como el "Santo Grial de los traders": pueden darte una mayor tasa de ganancias, una mejor relación riesgo-recompensa, una gestión de posiciones más sencilla, etc...
Pero es realmente difícil determinar la tendencia con exactitud, evitando señales de fase, y con el momento adecuado, con el fin de tomar movimientos masivos. Por eso he creado el Validador de Tendencias: una nueva y FACIL herramienta que hará que la identificación de tendencias y la construcción de nuevas estrate
FREE

Este índicador técnico calcula directamente el valor del dólar index basado en la fórmula del índice que se negocía en la ICE por lo que no necesitas que tu broker tenga disponible este índice (DX) para ayudarte como referencia. Pequeñas discrepancias pueden encontrarse en el valor exacto de las velas y el tiempo debido a diferencias de horarios del cierre de piso de remates y el manejo de decimales. Pero en general te servirá bien de referencia. Necesitas que tu broker ofrezca el feed de los s
FREE

Este indicador es la versión traducida del indicador MOST de Anıl ÖZEKŞİ, desarrollado en el Matriks Data Terminal, al lenguaje MQL4. Es un indicador de seguimiento de tendencia y bastante exitoso. Su uso será gratuito e ilimitado de por vida. Puede hacer clic en mi perfil para acceder a la versión MQL5 de este indicador. También puede obtener sus solicitudes de programación para los lenguajes MQL4 y MQL5 hechas en İpek Bilgisayar con un servicio facturado. Puede ponerse en contacto con İpek Bil
FREE

SmartStochasticMt4 es un indicador universal para tomar decisiones de trading. Es una herramienta indispensable para los operadores principiantes, ya que no tiene ajustes y está listo para trabajar después de la instalación.
Ventajas del indicador:
1. Funciona con cualquier símbolo de negociación
2. Funciona en cualquier período de tiempo
3. No tiene parámetros configurables
4. Proporciona una imagen completa de la situación de la negociación en diferentes periodos de tiempo
5. No se retrasa
T
FREE

¿Estás listo para obtener Alerta, apuntar, disparar y tomar ganancias? Bueno, encantado de conocerte soy Martin del NEGRO de Argentina, permítanme presentarles acerca de su nuevo indicador, éste tiene el conocimiento para encontrar puntos de pivote en el gráfico, más específicamente cuando el precio de su inicio de una nueva tendencia fuerte (compra) alcista o bajista (venta), y cuando "Victory Ravage Days.ex4" indicador de encontrar este punto de pivote, de inmediato se pondrá en contacto con u

RSI Color y Notificación Ajustes Usos :: 1. Establecer valor de Sobreventa y Sobrecompra 2. Establecer periodo RSI 3. Establecer Color 4. Notificar a la alerta, correo electrónico y móvil.
Para Trading :: Forex y Opciones Binarias 1. Cuando se produce la alarma de color en el área OVB, haga la preparación. Para introducir una orden de Venta 2. Cuando la alarma de color se produce en el área OVS, hacer la preparación. Para introducir una orden de Compra 3. Cuando el RSI está entre OVB y OVS, con
FREE

Indicador sencillo que muestra la reducción máxima de la cuenta desde que se añadió el indicador al gráfico. El indicador no tiene en cuenta el historial de operaciones, ya que es imposible calcular la reducción a partir del historial de entradas y cierres de operaciones. El indicador será gratuito en esta forma básica. Con el tiempo se desarrollará, pero el objetivo es mantenerlo simple y sencillo.
FREE

Introducción y descripción
Velas de colores que muestran la tendencia basada en dos medias móviles y la pendiente de la media móvil lenta. Una tendencia es la dirección general del precio de un mercado o de un activo. En el análisis técnico, las tendencias se identifican por las líneas de tendencia o la acción del precio, que destacan cuándo el precio está haciendo máximos y mínimos más altos en una tendencia alcista, o mínimos y máximos más bajos en una tendencia bajista. Muchos operadores opta
FREE
Canal híbrido de los indicadores Media móvil, Bandas de Bollinger, RSI y CCI. El filtrado único de las señales sin redibujar el indicador permite realizar diversas operaciones, tanto a medio como a corto plazo. El principio de funcionamiento del indicador radica en la búsqueda de los patrones de inversión del mercado. El método de detección de inversión de tendencia utiliza el canal de Media Móvil Triangular, que traza canales equidistantes no redibujables con un periodo de Desviación especifica
Este indicador permite ocultar el Volumen (en todos los timeframes de MT4) a partir de una fecha definida por el usuario con una línea vertical (Alone) o un panel (con "Hidden Candles"). El color de cada barra depende de si esta es superior o inferior a la barra anterior. Entradas del Indicador: No hay entradas para este indicador Información sobre el indicador "Volumen" está disponible en este post: https: //www.mql5.com/en/forum/134260 **********************************************************
FREE

## Daily SR Navigator: Su mapa diario de operaciones ¡Navegue por el mercado con precisión utilizando el poder del Precio de Apertura Diario! ¿Está cansado de trazar manualmente líneas de soporte y resistencia (SR) cada día, sólo para descubrir que son inexactas? Daily SR Navigator es la solución inteligente para automatizar su análisis técnico, proporcionando niveles clave que son relevantes y respetados por el mercado, especialmente para XAUUSD (Oro) . Este indicador nació de un descubrimiento
FREE

Este indicador le ayuda a escanear todos los símbolos que están en la ventana de Observación del Mercado y filtrar una tendencia con alertas. Funciona con los cinco indicadores más eficaces utilizados por la mayoría de los operadores: Media móvil Momento direccional medio (ADX) Índice de Fuerza Relativa (RSI) SAR Parabólico MACD Calcula dos barras para escanear. Cuando el color de la caja cambia a coral o azul real, le indica el cambio de tendencia para la entrada larga y corta. También recibirá
FREE

El Sexteto es un indicador MT4 que muestra 6 niveles de Medias Móviles, donde el segundo es la media móvil del primero, el tercero del segundo, y así sucesivamente. Da una señal cuando todos los niveles de medias móviles se alinean en orden. Obtenga un Sexteto EA gratis, y lea las discusiones sobre el uso del Indicador Sexteto en Forex Factory:
El Sexteto EA @ Forex Factory Echa un vistazo a The Sextet Scalper Pro para una estrategia de scalping más elaborada también con EA gratuito . Caracterís
FREE
MetaTrader Market es el mejor lugar para vender los robots comerciales e indicadores técnicos.
Sólo necesita escribir un programa demandado para la plataforma MetaTrader, presentarlo de forma bonita y poner una buena descripción. Le ayudaremos publicar su producto en el Servicio Market donde millones de usuarios de MetaTrader podrán comprarlo. Así que, encárguese sólo de sus asuntos profesionales- escribir los programas para el trading automático.
Está perdiendo oportunidades comerciales:
- Aplicaciones de trading gratuitas
- 8 000+ señales para copiar
- Noticias económicas para analizar los mercados financieros
Registro
Entrada
Si no tiene cuenta de usuario, regístrese
Para iniciar sesión y usar el sitio web MQL5.com es necesario permitir el uso de Сookies.
Por favor, active este ajuste en su navegador, de lo contrario, no podrá iniciar sesión.