Indicadores técnicos para MetaTrader 4 - 21

Pullback Viewer está diseñado para mostrar puntos de retroceso válidos en una tendencia bajista o alcista.
¿Qué se considera un pullback válido?
Un pullback válido necesita tener un cuerpo de cierre fuera del máximo de la vela anterior (en una tendencia bajista ) o del mínimo de la vela anterior (en una tendencia alcista ). Si la vela sale de la vela anterior, no es un pullback válido.
El pullback debe liquidar la vela anterior con un cierre de cuerpo de vela limpio.
¿Cuándo es útil este
FREE

El marco temporal recomendado es H1.
El indicador tiene dos tipos de señal.
Se trata de una señal para abrir una posición a partir de la aparición de una flecha. El precio sale del canal En el primer caso, el indicador construye flechas basadas en el canal construido y las Bandas de Bollinger años.
En otro caso, el operador puede operar si el precio acaba de ir más allá del canal. Si el precio es superior al canal - vendemos. Si el precio es inferior al canal, entonces usted puede buscar un l
FREE

Smart Liquidity Levels es una valiosa herramienta para identificar los niveles óptimos de liquidez, lo que permite a los operadores minoristas como nosotros establecer estratégicamente nuestras órdenes stop-loss. La herramienta esencial para los operadores que buscan maximizar su éxito en la negociación. El nivel de liquidez es un componente crítico de la negociación en el círculo interno (TIC). Nos ayuda a determinar cuándo y cómo debemos entrar en el mercado. Vea el vídeo para obtener instruc

¡Enorme venta de Halloween del 70% sólo durante 24 horas!
¡Envíenos un mensaje después de su compra para recibir más información sobre cómo obtener su BONUS GRATIS que funciona en gran combinación con Bull vs Bear! Bull vs Bear es un indicador de Forex fácil de usar que ofrece a los operadores señales claras y precisas basadas en reexaminaciones claras de la tendencia . Olvídese de los indicadores rezagados o de mirar los gráficos durante horas porque Bull vs Bear proporciona entradas en tiem

Sistema de trading para scalping. El indicador muestra la dirección del precio, la amplitud (canal) de su movimiento y el punto de pivote. El sistema analiza automáticamente el mercado utilizando el algoritmo de promediación del volumen de ticks durante un periodo de tiempo determinado. Después de eso, Scalper Thunder compara los datos con otros indicadores de análisis para identificar posibles puntos de pivote. Tan pronto como se encuentra un punto de este tipo, el indicador muestra la inversió

Título del producto Smart Accumulation (MT4) – parte de la serie SmartView Indicators Descripción breve Indicador Accumulation con una experiencia de usuario única en la plataforma MetaTrader. Ofrece capacidades avanzadas no disponibles anteriormente, como abrir configuraciones con doble clic, ocultar y mostrar indicadores sin eliminarlos, y mostrar la ventana del indicador a tamaño completo del gráfico. Diseñado para funcionar perfectamente con el resto de la serie SmartView Indicators. Visión
FREE

Cómo funciona el indicador:
Este es un indicador multimedidor Multi-timeframe MA que estudia si el precio está por encima o por debajo de un rango EMA particular y muestra señales rojas / verdes / amarillas. Rojo: Precio por debajo del rango EMA Verde: Precio por encima del rango Amarillo: Precio dentro del rango
Propiedades del indicador:
Ajustes EMA: - El periodo por defecto es 200. Puede cambiar todos los ajustes de MA como Período, Método MA (SMA, EMA, etc) o Precio MA Aplicado (Cierre, Ape
FREE

Indicador que mostrará tu Balance , y tu Equidad . Realmente simple de usar, no hay requerimientos específicos para instalarlo. Sin embargo usted puede configurarlo profundamente para sus propios deseos.
El panel tiene 4 botones. Sólo el actual mostrará la información del gráfico al que se vinculó el indicador. Si esta deseleccionado, tendrá la información de toda la cuenta. Only Buys mostrará sólo las órdenes de COMPRA y Only Sells mostrará sólo las órdenes de VENTA. Mostrar Cero mostrará el 0
Magic Channel es un indicador de canal para el terminal MetaTrader 4. Este indicador permite encontrar los puntos de inversión de tendencia más probables. A diferencia de la mayoría de los indicadores de canal, Magic Channel no se redibuja. El sistema de alertas (alertas, correo electrónico y notificaciones push) le ayudará a supervisar simultáneamente varios instrumentos de negociación. Adjunte el indicador a un gráfico y la alerta se activará en cuanto aparezca una señal. Con nuestro sistema d

Estrategia Óptima
Sea su asistente de trading MT Merit Conteo de Velas :
Diseñado para la negociación de opciones binarias, el indicador cuenta el número de velas alcistas o bajistas, por lo que es adecuado tanto para estrategias de martingala como de negociación estándar.
Es ideal para operadores experimentados y aplicable a Forex, ya que ayuda a calibrar el volumen y a identificar tendencias o posibles retrocesos en el gráfico. Indicador para operadores que prefieren el trading manual.
OPER
FREE

está diseñado para mejorar la representación visual de los gráficos financieros en MetaTrader 4 mediante la alteración dinámica de los colores de varios elementos gráficos, incluyendo velas, barras, gráficos de líneas y barras de volumen. Su objetivo principal es mejorar la intuición del operador y el compromiso durante el análisis del mercado mediante la introducción de transiciones de color suaves y cíclicos que pueden poner de relieve los cambios de impulso, las tendencias o la volatilidad s
FREE
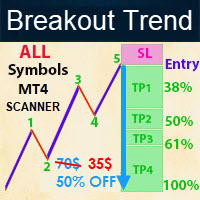
- Precio real es de 70 $ - 50% de descuento (Es 35 $ ahora) ¡Póngase en contacto conmigo para la instrucción, cualquier pregunta! - Actualización de por vida gratis - No repintar - Yo sólo vendo mis productos en Elif Kaya Perfil, cualquier otro sitio web son robados versiones antiguas, Así que no hay nuevas actualizaciones o apoyo. Introducción Breakout Trend Scanner indicador funciona sobre la base de la onda de Elliott en el análisis técnico describe los movimientos de precios en el mercado f

El indicador VR Grid está diseñado para crear una cuadrícula gráfica con configuraciones definidas por el usuario. A diferencia de la cuadrícula estándar , VR Grid se utiliza para construir niveles circulares . Dependiendo de la elección del usuario, el paso entre los niveles de ronda puede ser arbitrario. Además, a diferencia de otros indicadores y utilidades, VR Grid mantiene la posición de la grilla incluso cuando cambia el período de tiempo o se reinicia el terminal. Las configuraciones, arc
FREE

Indicador de scalping. Tiene en cuenta la volatilidad, el movimiento del precio en el intervalo local y la dirección de la tendencia actual. Marco temporal recomendado - M5. Ventajas: La baja volatilidad cuando aparece una señal asegura un movimiento mínimo contra una posición abierta. El indicador no redibuja sus señales. Hay señales de alerta. Es una gran herramienta para el day trading.
Ajustes: Nombre Descripción Período Período del indicador Rango de cada barra en el periodo (pp.) El tamañ
FREE

¡Libere su ventaja comercial con TrendSight Pro! ¿Cansado de indicadores retrasados y gráficos confusos? TrendSight Pro: Signal Paint Engine es la solución que necesita. Este indicador inteligente corta el ruido del mercado, dándole señales claras y de alta probabilidad directamente en su gráfico. Está diseñado para que sus operaciones sean más sencillas, rápidas y rentables, ya que combina un rápido análisis del impulso con un potente filtro de tendencias a largo plazo. Principales ventajas y
FREE

El temporizador de cuenta atrás de velas para MetaTrader 4 (también disponible para MT5) es un indicador vital diseñado para ayudarle a gestionar su tiempo de negociación con eficacia. Le mantiene informado sobre las horas de apertura y cierre del mercado mostrando el tiempo restante antes de que se cierre la vela actual y se forme una nueva. Esta poderosa herramienta le permite tomar decisiones de trading bien informadas. Características principales: Rango de Asia: Viene con una opción para am
FREE

Cómo utilizar Pair Trading Station La Estación de Operaciones de Pares se recomienda para el marco temporal H1 y puede utilizarla para cualquier par de divisas. Para generar señales de compra y venta, siga los siguientes pasos para aplicar la Estación de Comercio de Pares a su terminal MetaTrader. Cuando cargue la Estación de Comercio de Pares en su gráfico, la Estación de Comercio de Pares evaluará los datos históricos disponibles en sus plataformas MetaTrader para cada par de divisas. En su gr

BeST_Gann Swing Oscillator es un indicador de MT4 que se basa en el trabajo correspondiente de Robert Krausz quien lo introdujo en el libro " A.W.D Gann Treasure Discovered " .
El Oscilador de Oscilación de Gann es un indicador técnico de rango que oscila entre +1 y -1 y por lo tanto describe las oscilaciones del mercado.
Generalmente cuando el mercado está en un alza, el Oscilador de Oscilación de Gann lo describe como 2 máximos más altos con el valor de +1 mientras que después de un alza, se
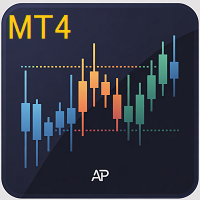
AP Día-Semana-Mes Máximo-Mínimo MT4
Superposición ligera que dibuja los máximos/mínimos del Día, Semana y Mes anteriores en cualquier gráfico. Ideal para planificar sesiones, confluencias y alertas cuando el precio vuelve a niveles de oscilación importantes.
Qué hace Traza 6 líneas: Máximo/Mínimo del día, Máximo/Mínimo de la semana, Máximo/Mínimo del mes (de las sesiones anteriores completadas).
Alerta cuando el precio alcanza una línea seleccionada (con una tolerancia fijada por el usuario)
FREE

STOCH Y RSI ALERTA https://www.mql5.com/en/users/earobotkk/seller#products (He creado un tablero de instrumentos de este producto, por favor eche un vistazo haciendo clic aquí ) (También he creado un EA de este producto, AHORA usuario puede ir automatización, haga clic en aquí ) P / S: Si te gusta este indicador, por favor calificarlo con 5 estrellas en la sección de comentarios, esto aumentará su popularidad para que otros usuarios se beneficiarán de su uso. Este indicador notifica y dibuja una
FREE

El indicador muestra la distribución de precios en un histograma horizontal. El histograma horizontal ayuda a encontrar los niveles clave del precio para que pueda tomar una buena decisión sobre el punto de toma de beneficios, stop loss... Con el histograma de precios puede mejorar su estrategia de negociación u obtener nuevas ideas.
Características destacadas Soporta múltiples marcos de tiempo : puede elegir trabajar con datos históricos en cualquier marco de tiempo que desee. No depende del m
FREE

Este indicador mide el 1º Canal de Referencia y la 1ª Zona Neutra. * configurar el canal macro para comprobar la frecuencia MAYOR H1 H4 1D * configurar el canal micro para comprobar la frecuencia MENOR 1M 5M 15M Cómo instalar el indicador fimathe. Y pre-mentoring Hay una estrategia secreta extra en este video. Mira el video para entender la lógica de cómo empezar con este indicador.
https://www.youtube.com/playlist?list=PLxg54MWVGlJzzKuaEntFbyI4ospQi3Kw2
FREE

Pinbar Detector es un indicador de MetaTrader que trata de detectar Pinbars (también conocido como "Pin-bar" o "Pin bar") y los marca mediante la colocación de una "cara sonriente" símbolo debajo de los Pinbars alcistas y por encima de los Pinbars bajistas. Es un indicador de acción de precios puro, que no utiliza ningún indicador técnico estándar en su código. La configuración de la detección de Pinbars se puede hacer a través de los parámetros de entrada del indicador. Pinbar Detector puede em
FREE

Cuando los niveles de resistencia de ruptura de precios se combinan con el oscilador Larry Williams' Percentage Range "WPR " rompe sus niveles de resistencia históricos, entonces surge la probabilidad de registrar precios más lejanos . Se recomienda encarecidamente confirmar la ruptura de precios con la ruptura del oscilador, ya que tienen efectos comparables a los niveles de soporte y resistencia de ruptura de precios; seguramente, las operaciones cortas tendrán la misma percepción. El concepto
FREE
Es una herramienta de análisis técnico. Permite realizar mediciones: Fibo, incluida la búsqueda de grupos de niveles Fibo (por el método DiNapoli) Desequilibrio Línea de tendencia Selección de niveles S/D
Parámetros de entrada Trend_Color - color de la línea de tendencia Trend_Width - anchura de la línea de tendencia Trend_info - si es verdadero, junto con la línea de tendencia se muestra información adicional (bajo, alto, medio de la línea de tendencia) Trend_info_color_up_dn - color del texto

Señales y Alertas para el indicador AMA (Media Móvil Adaptativa) basadas en estos posts de MQL5: Media Móvil Adaptativa (AMA) y Señales del Indicador Media Móvil Adaptativa . Nota : esta herramienta está basada en el código del indicador AMA desarrollado por MetaQuotes Software Corp.
Características Las señales se activan al cierre de la última barra/apertura de una nueva barra; Se puede activar cualquier tipo de alerta: Cuadro de diálogo, Mensaje de correo electrónico, Notificaciones SMS para
FREE

soporte y resistencia ocultos actualizados del mercado. este indicador esta hecho para el nuevo mercado actual que tiene nuevos soportes y resistencias que algunos traders luchan por ver. El indicador funciona en todos los marcos de tiempo desde el marco de tiempo de 1 minuto hasta el mensual Un consejo de Trading para usar Cuando el precio está en resistencia y el indicador aparece, espere a que se cierre una vela bajista y realice una operación de venta. Lo mismo se aplica para una operació
FREE
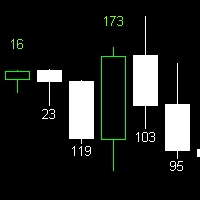
Indicador de Tamaño de Vela Descubre el tamaño de la vela con este indicador fácil de usar. Funciona en todos los marcos de tiempo, proporcionando información valiosa para tu análisis técnico. Características: Muestra el tamaño de la vela después de configurar el indicador. Compatible con todos los marcos de tiempo. El tamaño de la vela es una métrica importante en el análisis técnico, ya que puede indicar la fuerza y volatilidad del mercado. Con este indicador, puedes visualizar de manera clara
FREE

MACD es un indicador bien conocido que todavía se puede utilizar para la predicción de donde el precio va a ir próximos minutos, horas o incluso semanal Con color barra de Macd, sus ojos pueden coger fácilmente cuando el color se cambia basado qué movimiento del precio de mercado para encontrar cualquier tendencia temprana en mercado. Aquí está el parámetro del indicador: TF_MACD , por defecto es 1 Hora , esto significa que usted puede ver claramente MACD de 1 Hora TimeFrame en TimeFrame inferio
FREE

El indicador TwoMA Crosses muestra flechas en función de si la media móvil a corto plazo cruza por encima o por debajo de la media móvil a largo plazo. Una media móvil no predice la dirección del precio. En su lugar, define la dirección actual. A pesar de ello, los inversores utilizan las medias móviles para filtrar el ruido. Los operadores y los inversores tienden a utilizar el indicador EMA, especialmente en un mercado altamente volátil, ya que es más sensible a los cambios de precios que el
FREE
Desbloquee Señales Imparables : Su ventaja en el trading ¡Deje de adivinar y empiece a operar con confianza! El indicador Señales Imparables (Sistema BB-AO-MACD) es su herramienta todo en uno para captar movimientos de alta probabilidad en el mercado. Hemos fusionado el poder de tres indicadores probados - Bandas de Bollinger (BB) , Oscilador Asombroso (AO) y MACD - en un sistema simple que le da señales confirmadas, sin repintar , directamente en su gráfico. Por qué necesita este indicador Est
FREE
¡Domine el mercado con el indicador Laguerre Edge Signal! ¡Deje de adivinar y empiece a operar con confianza! Nuestro indicador Laguerre Edge es la herramienta definitiva para detectar puntos de entrada de alta probabilidad. Este indicador combina la potencia de dos métodos de análisis clásicos: las medias móviles para la dirección de la tendencia y el RSI de Laguerre para detectar los retrocesos, todo ello filtrado por la sólida línea de tendencia EMA 200 . Está diseñado para ofrecerle señales
FREE

Indicador avanzado de un comerciante profesional - es un indicador profesional basado en el popular oscilador estocástico. Advanced indicator of a professional trader es un oscilador con niveles dinámicos de sobrecompra y sobreventa, mientras que en el oscilador estocástico estándar, estos niveles son estáticos y no cambian. Esto permite a Advanced indicator of a professional trader adaptarse a los constantes cambios del mercado. Cuando aparece una señal de compra o de venta, se dibuja una flec
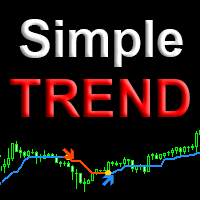
Simple trend es una versión profesional del indicador de tendencia y puntos de entrada. Utiliza la acción del precio y un algoritmo de filtrado único para determinar la tendencia. Muestra el cambio en la dirección del movimiento del precio en cualquier par de divisas, sin redibujar el resultado. Adecuado para determinar puntos de entrada para scalping y swing, así como para operaciones intradía y a medio plazo. Características Marca las direcciones y ubicaciones de los cambios de tendencia. Ade

El indicador se basa en el indicador CCI clásico. Recomiendo ver mi asesor - Noche Zen EA No redibuja sus señales. Hay alertas para la señal entrante. Contiene 2 estrategias: Entrada de la línea CCI en la zona de sobrecompra (para operaciones de compra) / en la zona de sobreventa (para operaciones de venta) Salida de la línea CCI de la zona de sobrecompra (para operaciones de venta) / de la zona de sobreventa (para operaciones de compra)
Ajustes: Nombre Ajuste Descripción Periodo Periodo del in
FREE
Optimice la estrategia de negociación de sus indicadores personalizados con "Indicator Combiner Into One Indicator". Esta avanzada herramienta combina múltiples indicadores, incluidos sus indicadores personalizados, en una única interfaz fácil de usar. Genera una señal de flecha basada en sus indicadores personalizados, simplificando su proceso de toma de decisiones. Ideal para operadores de todos los niveles, este indicador ofrece:
Señales de flecha : Obtenga una señal de flecha única y clara
FREE

Buscar una entrada con bajo riesgo para el comercio por Lisek Waves Indicador. Usando Lisek Waves Indicador puede mejorar su rendimiento comercial. En su forma más simple, esta herramienta de negociación que sea fácil de buscar una entrada con bajo riesgo y para gestionar su comercio y el riesgo. El análisis de ondas Lisek se basa en la noción de que los mercados siguen patrones específicos llamados ondas, que son el resultado de un ritmo natural de la psicología de la multitud que existe en tod
FREE
Como la mayoría de las cosas que funcionan en el trading, es muy simple. Sin embargo, es una de las herramientas más potentes que tengo y que hace que las entradas de muchos sistemas sean mucho más precisas.
En su esencia, mide la volatilidad reciente frente a la media a medio plazo. ¿Cómo funciona? Los mercados tienden a ser propensos a fuertes movimientos de tendencia cuando la volatilidad relativa es baja y tienden a ser de reversión a la media cuando la volatilidad relativa es alta.
Se pue
FREE

Ahora no hay necesidad de comprobar la volatilidad en sitios web de terceros con el fin de determinar la rabia media de movimiento de un determinado par de divisas. El indicador Truly Volatility está diseñado para determinar la volatilidad para el período especificado y se muestra en una ventana separada como un histograma y una línea. Si se adjunta a un gráfico con el marco temporal Н1, el indicador muestra el movimiento medio del precio para cada hora (de 0 a 23) basado en los datos históricos
FREE

El indicador BinaryFortune ha sido desarrollado y adaptado específicamente para operar con opciones binarias a corto plazo. El algoritmo del indicador analiza numerosos factores antes de generar una señal. El indicador se instala de la forma convencional. El indicador consta de una ventana de información, que muestra el nombre del instrumento de negociación, los niveles de soporte y resistencia, y la propia señal (COMPRA , VENTA o ESPERA ). La señal va acompañada de un sonido y una alerta emerge
FREE
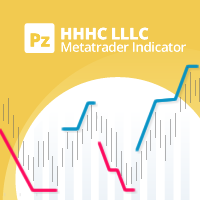
Una implementación personal de un famoso principio de tendencia conocido como higher high, higher close, lower low, lower close (HHHC - HHHL). Utiliza únicamente la acción del precio para determinar la dirección de la tendencia, los cambios de tendencia y las zonas de retroceso. [ Guía de instalación | Guía de actualización | Solución de problemas | FAQ | Todos los productos ] Periodo de ruptura personalizable Colores y tamaños personalizables No repinta ni retropinta Implementa alertas de todo
FREE

¿Alguna vez ha querido detectar una tendencia justo cuando empieza? Este indicador trata de encontrar los máximos y mínimos de una tendencia. Utiliza indicadores incorporados y estudia sus patrones de inversión. No se puede utilizar por sí solo, requiere estocástico (14) para confirmar la señal. Rojo para vender, Azul para comprar. No hay parámetros necesarios sólo tiene que adjuntar a un gráfico y está listo para ir. Echa un vistazo a otros grandes productos de https://www.mql5.com/en/users/aug
FREE
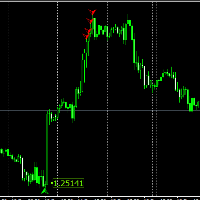
Los que han seguido mi hilo FCK Quantum S calping conocen el indicador FCK Quantum Scalping y han llevado el indicador a diferentes niveles (Mastermind) para adaptarlo a su estilo de trading. En este sistema, el indicador Quantum sólo sirve para mostrarnos entradas de trading, y ya está. Los objetivos y niveles de stop son un poco posteriores. Para los que no sepan qué es el indicador FCK Quantum Scalping , os lo cuento. El indicador FCK Quantum S calping es básicamente un indicador de Onda mo
FREE

El indicador muestra los niveles probables (de soporte y resistencia ). El indicador dibuja niveles horizontales y de tendencia de soporte y resistencia. Los ajustes del indicador: Tendencias - el modo de visualización de líneas de tendencia o líneas horizontales de soporte y resistencia. Sí - mostrar sólo líneas de tendencia No - mostrar sólo líneas horizontales UseResource - utiliza los recursos incorporados en el indicador. Sí - utilizar el indicador ZigZag de los recursos del producto. No -
FREE

Estocástico con Filtro de Tendencia: Señales de Precisión Este es un indicador potente y fácil de usar diseñado para operadores que desean señales más fiables del oscilador estocástico clásico. Cómo funciona: Este indicador mejora el Estocástico estándar añadiendo un potente filtro de tendencia. Utiliza una Media Móvil Exponencial (EMA) para determinar la dirección general del mercado. El indicador sólo generará una señal de "compra" cuando el cruce del estocástico sea alcista y el precio esté p
FREE

MA MTF Overlay Chart es un software que permite superponer el gráfico de velas de un instrumento financiero con un segundo gráfico de velas del mismo, o de otro, instrumento financiero, estableciendo un marco temporal diferente al del gráfico básico. El software es muy sencillo de utilizar y los parámetros de entrada se indican a continuación.
Parámetros de entrada: Configuración del gráfico de superposición Instrumento financiero : instrumento financiero que desea superponer en el gráfico base
FREE

Recordatorio plano Vista general Flat Reminder es una potente herramienta de análisis técnico que identifica y resalta las zonas de consolidación de precios en su gráfico. Detecta cuándo la acción del precio se ralentiza y se mueve lateralmente, indicando posibles puntos de reversión, configuraciones de continuación o zonas de decisión clave en el mercado. Características principales Detección de consolidaciones : Identifica automáticamente las zonas de precios planos en las que disminuye el imp
FREE
Indicador de Cruce de Medias Móviles (MM) con Optimización Automática Este indicador encuentra automáticamente los mejores períodos para las Medias Móviles (MM) en un rango de barras específico. Busca la combinación que genere la mayor ganancia o el mejor ratio de ganancias/pérdidas. Cómo funciona: Señal de compra: La MM rápida cruza la MM lenta de abajo hacia arriba. Señal de venta: La MM rápida cruza la MM lenta de arriba hacia abajo. El indicador prueba varias combinaciones de períodos, selec
FREE
La fórmula clásica de ZigZag. Pero sin rezagos y repintados. Usted puede ver en las capturas de pantalla que muestra los valores entre los picos y es útil para probar estrategias basadas en el indicador. Porque a veces la gente encuentra una buena idea sobre él, pero no entienden que los indicadores de repintado tienen algunas cosas a tener en cuenta. Los parámetros son los mismos que el indicador ZigZag original: Profundidad, Desviación y Retroceso.
FREE

Introducción al Indicador de Segmentación Universal: La segmentación de línea universal se basa en dos medias entrelazadas, de acuerdo con la horquilla dorada y muerta como estándar, los puntos altos y bajos a ambos lados de la horquilla dorada y muerta conectados para abrirse en una segmentación de línea. Este indicador puede ajustarse a diferentes parámetros de uso apilado multinivel. El principio de segmentación universal: En cualquier grupo de promedios compuesto por sistema de promedios, l
FREE

A veces un trader necesita saber cuando se cerrará una vela y aparecerá una nueva para tomar las decisiones correctas, este indicador calcula y muestra el tiempo restante de la vela actual . Es fácil de usar, basta con arrastrarlo en el gráfico. Por favor, utilice y expresar su opinión, expresar sus opiniones promoverá los productos. Para ver otros productos gratuitos, por favor visite mi página .
FREE

Este indicador utiliza el indicador Zigzag para identificar los máximos y mínimos de oscilación en el gráfico de precios. Una vez identificados los máximos y mínimos de oscilación, puede utilizarlos para determinar posibles niveles de soporte y resistencia. Un nivel de soporte se forma cuando el precio cae y rebota desde un mínimo oscilante, lo que indica que hay presión compradora en ese nivel. Un nivel de resistencia se forma cuando el precio sube y retrocede desde un máximo oscilante, lo que
FREE
Indicador de Bandas de Bollinger altamente configurable. Características: Funciones de alerta altamente personalizables (en niveles, cruces, cambios de dirección vía email, push, sonido, popup). Capacidad multi timeframe Personalización del color (en niveles, cruces, cambios de dirección) Opción de interpolación lineal Funciona en el probador de estrategias en modo multi timeframe (también en fin de semana sin ticks) Parámetros:
Bollinger Bands Timeframe: Puede establecer los marcos de tiempo i
FREE

BeST_Darvas Boxes es un indicador MT4 basado en el método de trading desarrollado en los años 50 por el húngaro Nicolas Darvas . Indicador BeST_Darvas Boxes dibuja la parte superior e inferior de cada caja Darvas que se pueda confirmar en el gráfico actual. dibuja flechas de compra y venta para cada ruptura al alza o a la baja confirmada de los niveles anteriores. dibuja siempre después del cierre de la barra y por lo tanto no repinta ni retropinta .
Nota : Cada cliente que quiera tener la ver

El indicador Multi Trendlines dibuja automáticamente las líneas de tendencia dominantes en el gráfico actual. El indicador busca las 5 mejores tendencias alcistas y las 5 mejores tendencias bajistas en el precio actual, dibujando cada línea de tendencia si se cumplen las condiciones del filtro. Las líneas de tendencia se denominan "Trendline "+[Direction]+Symbol()+TrendlineSequenceNumber Por ejemplo: La segunda línea de tendencia alcista en un gráfico EURUSD se llamaría "TrendlineUpEURUSD2". Par
FREE

Este indicador demuestra que el cambio de precio de los instrumentos financieros NO es un proceso de paseo aleatorio, como defiende la "Hipótesis del paseo aleatorio", y como popularizó el exitoso libro "A Random Walk Down Wall Street". La psicología engañosa del mercado y el tira y afloja entre toros y osos ponen las cosas en contra de los operadores en todos los instrumentos y en todos los plazos. Como operador, ¿cuántas veces ha visto cómo sus beneficios en una operación subían bruscamente, p
FREE
Siga y opere fácilmente con la tendencia utilizando este indicador. Utiliza un círculo y una línea para indicar la dirección de la tendencia. Excelente para canales. Función de alerta.
Parámetro TrendPeriod se puede cambiar a su preferencia. Cómo utilizarlo: Simplemente adjuntar a cualquier gráfico. Círculo azul más línea azul cruzada por debajo del precio = Comprar. Círculo rojo más línea roja cruzada por encima del precio = Vender. Los mejores resultados se obtienen cuando se tienen en cuenta
FREE
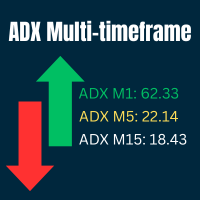
Indicador Ultimate ADX Multi-marco temporal Este indicador proporciona valores ADX en tiempo real para múltiples marcos temporales en un panel de etiqueta discreta. Es especialmente útil para medir la fuerza de la tendencia a través de los marcos de tiempo sin cambiar constantemente los gráficos. Elija qué periodos mostrar, ancle el panel a cualquier esquina del gráfico y coloree los niveles de intensidad del ADX a su gusto. Características principales y personalización Multi-Timeframe ADX - Alt
FREE

Este indicador muestra un gráfico de tick completo con dos medias móviles opcionales, y hace que prestar atención a los datos de precios sub-m1 sea realmente fácil. [ Guía de instalación | Guía de actualización | Solución de problemas | FAQ | Todos los productos ] Identifique fácilmente los picos de precios La línea azul es el precio de compra La línea roja es el precio de oferta El indicador no pierde datos de tick cuando se recarga Implementa dos medias móviles opcionales El indicador no repin
FREE
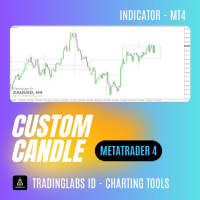
Custom Candle - Visualización Multi-Timeframe Analizar múltiples marcos temporales es esencial para tomar decisiones de trading precisas, pero cambiar de un gráfico a otro puede resultar incómodo e ineficaz. El indicador Custom Candle resuelve este problema mediante la superposición de velas de tiempo superior (HTF) directamente en su gráfico de tiempo inferior (LTF). Esto le permite ver el panorama general de un vistazo, alinearse con la tendencia superior y mejorar la precisión de las operacio
FREE
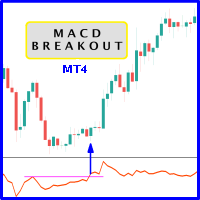
Surge la probabilidad de registrar precios más altos cuando MACD rompe el nivel de resistencia histórico del oscilador. Se recomienda encarecidamente confirmar la ruptura del precio con la ruptura del oscilador, ya que tienen efectos comparables a la ruptura de los niveles de soporte y resistencia del precio; seguramente, las operaciones cortas tendrán la misma percepción. Como ventaja, muchas veces la ruptura del oscilador precede a la ruptura del precio como una alerta temprana de un evento pr
FREE

El Indicador Wave Rider: Su clave para operar con confianza ¿Cansado de intentar adivinar los movimientos del mercado? El indicador Wave R ider es su solución. Es una herramienta inteligente diseñada para ayudarle a detectar tendencias rentables con facilidad y confianza. ¿Por qué es tan potente? Vea las tendencias con claridad : Wave Rider simplifica los complejos datos del mercado, para que pueda identificar fácilmente la dirección de la tendencia y tomar decisiones más inteligentes. Obtenga
FREE

FUNDING DEVIL INDICATOR ha sido desarrollado por traders para traders y no es otra combinación de indicadores ya existentes o una herramienta "mágica, que resuelve todas las situaciones".
PASE LAS CUENTAS FINANCIADAS CON ÉL.
Es la respuesta para los principiantes y los comerciantes experimentados sobre los conceptos engañosos de la corriente principal, causando el 90% de los comerciantes al por menor, nunca ganarse la vida con el comercio.
Los traders exitosos "siguen al dinero inteligente"
FREE

Este indicador de marco de tiempo múltiple y símbolo múltiple identifica doble arriba / abajo, cabeza Y hombros, banderines / triángulos y patrones de bandera. También es posible configurar alertas solo cuando se ha producido una ruptura del escote / triángulo / asta de bandera (ruptura del escote = señal confirmada para arriba / abajo y cabeza y hombros). El indicador también se puede utilizar en modo de gráfico único. Lea más sobre esta opción en el producto blog . Combin

El indicador Candle GAP es una herramienta esencial para los comerciantes que utilizan estrategias de negociación de brechas , ya que identifica automáticamente las brechas de velas para cada día de la semana. Una brecha se refiere a una diferencia de nivel de precios entre el cierre y la apertura de dos días consecutivos. Este indicador reconoce cuatro tipos de patrones de brecha: común, ruptura, continuación y agotamiento. Al incorporar este indicador en cualquier gráfico, los operador
FREE

ChannelRSI4 El indicador de índice de fuerza relativa (RSI) con niveles dinámicos de zonas de sobrecompra y sobreventa.
Los niveles dinámicos cambian y se ajustan a los cambios actuales en el indicador y los precios, y representan una especie de canal.
Configuración del indicador period_RSI: período promedio para calcular el índice RSI. apply_RSI: el precio aplicado. Puede ser cualquiera de las constantes de precio: PRICE_CLOSE: precio de cierre, PRICE_OPEN: precio de apertura, PRICE_HIGH: pre
FREE

Visión general del indicador La Copa de Oro Final es un completo sistema de negociación diseñado para simplificar el análisis técnico. Combina las herramientas de negociación más potentes en un paquete fácil de usar, que le ofrece una visión cristalina de la acción del precio y le ayuda a tomar decisiones de negociación informadas. El indicador funciona eficazmente en todos los activos y plazos. [ Imagen ilustrativa del indicador en el gráfico ] Características principales Zonas dinámicas de so

Versión MT5 Visión general
El indicador Lowess Channel es una herramienta de seguimiento de tendencia suavizada diseñada para ayudar a los operadores a identificar la dirección de la tendencia , detectar mercados planos o con oscilaciones y detectar rupturas de zonas de consolidación. Crea una línea central suavizada con los límites superior e inferior del canal, adaptándose al ruido del mercado y manteniendo la claridad. Cómo funciona El indicador construye un canal alrededor de una línea de
FREE
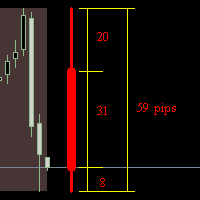
El indicador 'dibuja' una vela diaria, semanal o mensual en el gráfico actual. Muestra en puntos los tamaños de las sombras superior e inferior, el cuerpo y la vela completa. Funciona en tiempo real. Funciona en el probador de estrategias. Parámetros del indicador: How_much_to_show - cuántos bloques mostrar. Block_period - período de bloque (día / semana / mes) Shift - desplazamiento desde el borde del gráfico en barras. language - selección de idioma.
FREE
Libere todo el potencial de su estrategia de negociación con el indicador Dynamic Range Breaker . Esta herramienta esencial está diseñada para señalar puntos de inflexión significativos en el mercado y fuertes continuaciones de tendencia, dándole la claridad y la confianza para actuar. El indicador Dynamic Range Breaker se centra en identificar "rupturas" claras de los puntos máximos y mínimos anteriores, señalando cuándo el mercado está listo para realizar un movimiento decisivo. Olvídese de la
FREE
MetaTrader Market ofrece a todos los desarrollador de programas de trading una sencilla y cómoda plataforma para ponerlos a la venta.
Le ayudaremos con la presentación y explicaremos cómo preparar la descripción de su producto para el Market. Todos los programas que se venden a través del Market están protegidos por una codificación adicional y pueden ser iniciados sólo en el ordenador del comprador. La copia ilegal es imposible.
Está perdiendo oportunidades comerciales:
- Aplicaciones de trading gratuitas
- 8 000+ señales para copiar
- Noticias económicas para analizar los mercados financieros
Registro
Entrada
Si no tiene cuenta de usuario, regístrese
Para iniciar sesión y usar el sitio web MQL5.com es necesario permitir el uso de Сookies.
Por favor, active este ajuste en su navegador, de lo contrario, no podrá iniciar sesión.