MESA Cycles
- Indicadores
- Versión: 1.5
- Actualizado: 5 diciembre 2018
- Activaciones: 5

Versión 1.05 - añadida la opción de usar el ratón para fijar el Desplazamiento de Datos (ancla). Simplemente mantenga pulsada la tecla SHIFT, haga doble clic en cualquier parte del gráfico, luego suelte la tecla SHIFT y el ancla se establecerá en la barra más cercana a su doble clic.
Versión 1.04 - se ha añadido una corrección para el modo demo (es decir, el funcionamiento en el Probador de Estrategias). Usar sólo precios abiertos y marcar Usar fecha (seleccionar un rango de fechas)
El indicador Ciclos MESA calcula el espectro de potencia de una serie de datos utilizando el método de Estimación del Espectro de Máxima Entropía y produce un gráfico de los ciclos más fuertes en la fase y amplitud relativa correctas. A continuación, estos ciclos se extienden hacia el futuro en un número de barras definido por el usuario. El algoritmo de máxima entropía, a diferencia de una simple transformación FFT, incluirá frecuencias de todo el plano de frecuencias complejo y no sólo del intervalo de Nyquist, lo que, en términos generales, significa que puede resolver periodos de ciclo mayores que la ventana de datos pasada a la función. Además, MESA tiene la capacidad de ajustar características espectrales muy nítidas que a menudo no son detectadas por otros métodos de análisis.
Antes de pasarlo al algoritmo MESA, el logaritmo de los datos de precios se detrae utilizando un filtro de mínimos medios cuadrados.
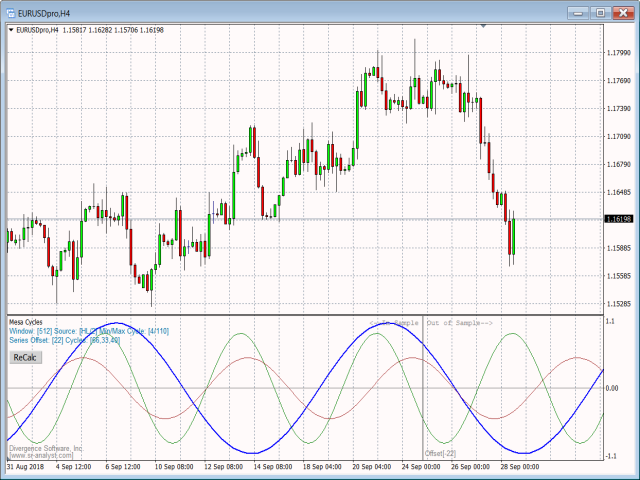
La herramienta Ciclos de M ESA es extremadamente útil para identificar ciclos en los datos de precios que pueden continuar durante algún tiempo en el futuro. El método recomendado consiste en fijar el desplazamiento justo después de un máximo o mínimo reciente. A continuación, compare los ciclos trazados DESPUÉS del desplazamiento con lo que realmente ocurrió en la acción del precio, y busque cualquier ciclo que siga muy de cerca la acción del precio en este período fuera de la muestra. Sólo los datos de precios a la izquierda de su Desplazamiento se utilizarán para fines de análisis de ciclos. Todo lo que esté a la derecha del Offset está fuera de la muestra y no es visto ni utilizado por las rutinas de análisis de ciclos.
Vea la instantánea EURAUD H4 a continuación para ver un ejemplo. Aquí fijamos el Desplazamiento/anclaje a un máximo de oscilación 77 barras atrás en el tiempo. En el periodo fuera de la muestra vemos que el ciclo verde (periodo de 36) sigue muy de cerca la acción del precio y, por lo tanto, sería un buen ciclo a seguir en el futuro para predecir las próximas oscilaciones. A medida que se completa cada nueva oscilación, repetimos el proceso y realizamos pruebas estableciendo el Desplazamiento a un máximo o mínimo de oscilación reciente, y manteniendo el Desplazamiento que nos proporciona un buen rendimiento fuera de la muestra para uno o más ciclos. Por lo general, querrá establecer el Desplazamiento justo después de uno de los 3 máximos o mínimos de oscilación más recientes. No se recomienda retroceder más de 3 oscilaciones a menos que las oscilaciones sean muy cortas.
Tenga en cuenta que, en muchos casos, el ciclo dominante puede no ser necesariamente el ciclo más útil para utilizar con fines de previsión.
El indicador MESA Ciclos es un indicador compañero de nuestro indicador MESA Espectro, que también está disponible en el MQL Marketplace.
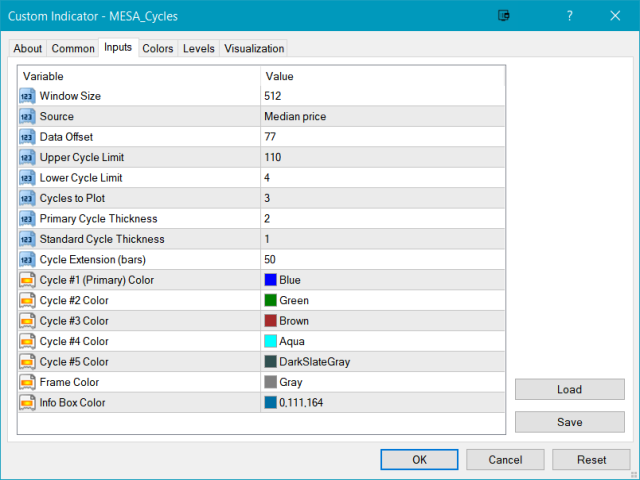
Opciones:
| Menú Opción | Descripción |
|---|---|
| Tamaño de Ventana | Seleccione entre 1024, 512, 256, o 128. Generalmente se recomienda el tamaño de ventana 512 o 256. El valor predeterminado es 512. |
| Fuente | Seleccione la fuente de entrada de precios. El valor predeterminado es Precio medio. |
| Desplazamiento de datos | Establece el desplazamiento en la serie de precios. Por defecto es 1 (bar). |
| Límite superior de ciclo | Seleccione la mayor longitud de ciclo aceptable. Por defecto es 110. El rango es 1-512. |
| Límite inferior de ciclo | Seleccione la menor longitud de ciclo aceptable. El valor por defecto es 4. El rango es 1-512. |
| Ciclos a trazar | Establece el número total de ciclos a trazar. El rango es de 1 a 5. Por defecto es 3. |
| Grosor del ciclo primario | Ajuste el grosor de la línea para el trazado del ciclo primario. El rango es de 1 a 6. Por defecto es 2. |
| Grosor de ciclo estándar | Ajuste el grosor de línea para todos los demás gráficos de ciclo. El intervalo va de 1 a 6. Por defecto es 1. |
| Extensión del Ciclo | Establece el número de compases en el futuro que debe extenderse cada gráfico de ciclo. Por defecto es 20 barras. |
| Color Ciclo #1 (Primario) | Establece el color del ciclo primario (dominante). |
| Color Ciclo #2 | Establece el color para el gráfico del 2º ciclo. |
| Ciclo #3 Color | Establece el color para el gráfico del 3er ciclo. |
| Color del ciclo nº 4 | Establece el color para el gráfico del 4º ciclo. |
| Ciclo #5 Color | Establece el color para el gráfico del 5º ciclo. |
| Color del marco | Establece el color para las líneas del marco y el texto. |
| Color del cuadro de información | Establezca el color para el cuadro de información que se muestra debajo del título. |