Indicadores técnicos para MetaTrader 4 - 36

"Giant" es un sistema flexible en relación con las estrategias de negociación. Consta de dos indicadores de alta calidad que se instalan en cinco marcos temporales diferentes del mismo par de divisas (véase la captura de pantalla). Supervisa la tendencia y da señales de apertura. El sistema superó un gran número de comprobaciones y mostró una gran precisión. Los indicadores se venden por separado. La segunda palabra del nombre principal es el propio indicador. En esta edición se vende el indicad
FREE
La Herramienta Definitiva para Ajustar Medias Móviles
Esta es una herramienta avanzada diseñada para simplificar y optimizar la configuración de tu Media Móvil. Con MA Tuner, puedes ajustar fácilmente parámetros clave (Período, Desplazamiento, Método y Precio) a través de un panel fácil de usar y acceder instantáneamente a estadísticas detalladas sobre la frecuencia con la que las velas cruzan la línea MA y sus posiciones de apertura y cierre en relación con ella.
¿Por qué es mejor que el indi
FREE

FlatBreakout (Versión Gratuita) Detector de Rango Plano y Panel de Breakout para MT4 - Sólo GBPUSD FlatBreakout es la versión gratuita del indicador profesional FlatBreakoutPro, especialmente diseñado para la detección plana (rango) y señales de ruptura en el par GBPUSD solamente.
Perfecto para los traders que quieren experimentar la lógica fractal única de FlatBreakout y probar las señales de ruptura en un mercado en vivo sin limitaciones. ¿Para quién es este producto? Para traders que prefiere
FREE

La barra Time End de MMD es un indicador simple que muestra la cantidad de segundos restantes en los tres intervalos seleccionados. De acuerdo con la metodología MMD, el momento en que ocurre un movimiento direccional del precio es importante. Este indicador le permite usar esta relación de manera más efectiva en el comercio de Forex y Futuros.
Descripción de la funcionalidad:
Marco de tiempo 1 Período: definición del primer intervalo de tiempo Time Frame 1 Color - especificando el color para
FREE

El indicador representa dos medias móviles sencillas según los precios High y Low. La línea MA_High se representa cuando la media móvil está dirigida hacia abajo. Puede ser usada para establecer una orden stop para una posición de venta. La línea MA_Low se representa cuando la media móvil está dirigida hacia arriba. Puede ser usada para establecer una orden stop para una posición de compra. El indicador se usa en el experto TrailingStop . Parámetros Period - periodo de cálculo de la media móvil
FREE

Chart Time: - El Indicador Hora del Gráfico es muy simple y fácil, pero puede ser muy importante controlar el tiempo antes de abrir cualquier operación manual. Este indicador muestra el tiempo en el gráfico entre 3 opciones diferentes. Parámetros de entrada : - Mostrar Tiempo : Seleccione todas las opciones de tiempo que desee ver. Hora local (Hora del equipo personal), Hora del servidor (Hora del intermediario) o Hora GMT. Recomendaciones: - Use solo un Indicador de tiempo de gráfico p
FREE

El indicador High Trend Lite monitoriza 5 símbolos en hasta 3 marcos temporales simultáneamente y calcula la fuerza de sus señales. El indicador le notifica cuando una señal es la misma en diferentes marcos temporales. El indicador puede hacer esto desde un solo gráfico. Por lo tanto, High Trend Lite es un indicador multidivisa y multitiempo. Con High Trend Pro , disponible en este enlace , dispondrá de un número ilimitado de símbolos, 4 marcos temporales, un gráfico a color del indicador MACD p
FREE

Este indicador es la versión traducida del indicador PMAX de Kıvanç ÖZBİLGİÇ, desarrollado en el Matriks Data Terminal, al lenguaje MQL4. Es un indicador de seguimiento de tendencia y bastante exitoso. Su uso será gratuito e ilimitado de por vida. Puede hacer clic en mi perfil para acceder a la versión MQL5 de este indicador. También puede obtener sus solicitudes de programación para los lenguajes MQL4 y MQL5 hechas en İpek Bilgisayar con un servicio facturado. Puede ponerse en contacto con İpek
FREE

Este es un indicador de árbol de regresión para MT4/MT5.
Este indicador clasifica los nodos en el periodo de tiempo para que la desviación sea menor,
y muestra la línea de regresión y el canal para cada nodo.
¡Es gratis!
Adjunto CartDemo.ex4 y CartDemo.ex5 es una versión Demo y tiene las siguientes limitaciones:
No puede usar el método HighSpeed (el método por defecto es RandomForest)
El número máximo de barras es 260 (incremento desde 200)
No tiene fecha de expiración y puede ser iniciado muc
FREE

La relación riesgo-recompensa se utiliza para evaluar el beneficio potencial (recompensa) frente a la pérdida potencial (riesgo) de una operación. Los operadores de bolsa y los inversores utilizan la relación R/R para fijar el precio al que saldrán de la operación, independientemente de si genera beneficios o pérdidas. Generalmente se utiliza una orden de stop-loss para salir de la posición en caso de que ésta comience a moverse en dirección contraria a la prevista por el operador.
La relación
FREE
El indicador muestra los niveles Alto y Bajo de las velas para los plazos seleccionados en la configuración. Se recomienda utilizarlo en plazos más pequeños para determinar los niveles de plazos más altos.
Parámetros TYPE_LINE - tipo de línea (corta basada en el tiempo de la barra, o larga para todo el gráfico) ============= TF 1 ============= bloque de líneas para el primer timeframe TF_1 - timeframe del primer bloque de líneas Bars_1_from=1 - Barra del inicio de la línea del Timeframe corresp
FREE

El indicador se basa en una única Media Móvil de un periodo definido por el usuario. Analizando el movimiento del precio relativo a esta MA, y también siguiendo todas las actualizaciones de los máximos y mínimos del precio durante el mismo periodo que el periodo de la MA, el indicador dibuja su propia imagen de la tendencia, evitando las líneas de MA que siempre se rompen. Por lo tanto, si la tendencia va hacia arriba, la línea también apuntará hacia arriba y no cambiará su dirección incluso en
FREE

Hemos dejado de crear pequeñas herramientas para MT4. Nos centramos en MT5. Sólo herramientas muy útiles tal vez vamos a desarrollar para MT5. New Candle Alert es un simple indicador que te notifica cuando se forma una nueva vela.
Usted puede modificar el mensaje de notificación que aparecerá para usted. El sonido de alarma es predeterminado por el programa meta trader.
Versión MT5: https: //www.mql5.com/pt/market/product/37986
Espero que lo disfrutes. Cualquier duda o sugerencia por favor n
FREE
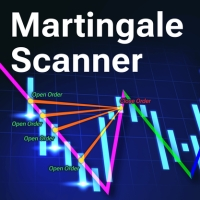
Escáner de Martingala: Análisis inteligente de operaciones para estrategias Martingale La estrategia Martingala es un enfoque de alto riesgo y alta recompensa que requiere una ejecución precisa y una gestión cuidadosa del riesgo. Sin las herramientas adecuadas, los operadores pueden tener dificultades para analizar las condiciones del mercado y ajustar el tamaño de las operaciones con eficacia. Martingale Scanner está diseñado para simplificar y optimizar este proceso, proporcionando a los opera
FREE

DATOS DEL INDICADOR ANTERIOR MA CROSSOVER https://www.mql5.com/en/users/earobotkk/seller#products P/S: Si te gusta este indicador, por favor califícalo con 5 estrellas en la sección de comentarios, esto aumentará su popularidad para que otros usuarios se beneficien de su uso.
Este indicador notifica y dibuja una flecha en el gráfico cada vez que la línea MA ha cruzado sobre los datos de su indicador anterior MA filtrados por MA Trend . También muestra el total de pips ganados de todas las config
FREE

MIRA LA SIGUIENTE ESTRATEGIA CON ESTE INDICADOR. Triple RSI es una herramienta que utiliza el clásico RSI, pero en varios períodos de tiempo para encontrar reversiones del mercado. 1. ️ Idea detrás del indicador y su estrategia: En el trading, ya sea Forex o cualquier otro activo, lo ideal es mantenerlo simple, cuanto más simple, mejor . La estrategia triple RSI es una de las estrategias simples que buscan retornos de mercado. En nuestra experiencia, donde siempre hay más dinero p
FREE

Sweep Trend El indicador marca en el gráfico, en forma de rectángulo, partes volátiles del movimiento del precio de acuerdo con la configuración especificada.
Descripción de la configuración TrendPips - valor de filtro en puntos TrendBars - valor de filtro en número de barras signal_shift: cambio relativo a la barra actual en un número específico de períodos hacia atrás, para señales CountBars: el número de barras para mostrar el indicador Color_1: uno de los colores de los rectángulos altern
FREE

Este indicador es la versión Demo de FiboRec y sólo funciona en EURUSD Este indicador depende de las líneas de Fibonacci, pero hay líneas secretas que he utilizado. Mediante el uso de FiboRec indicador usted será capaz de saber un montón de información importante en el mercado, tales como:
Características Usted puede evitar la entrada durante la turbulencia del mercado. Puede entrar ordenes solo en tendencia general. Sabrá si la tendencia es fuerte o débil.
Tipos de señales y marcos utilizados
FREE

Intraday Pulse - Indicador de precio medio intradía Intraday Pulse es un indicador diseñado para determinar el precio medio intradía al cierre diario del gráfico. Gracias a su avanzado algoritmo, sigue automáticamente el nivel de referencia, proporcionando un apoyo esencial para estrategias de negociación eficaces. Nota: el gráfico diario es ideal para utilizar el indicador (D1). Actualiza el marco temporal al final de la sesión diaria.
El indicador es versátil y puede utilizarse en cualquier a
FREE

El indicador Magic LWMA es de gran ayuda para determinar la dirección de la tendencia. Puede ser un excelente complemento para su estrategia actual o la base de una nueva. Los seres humanos podemos tomar mejores decisiones cuando vemos mejor visualmente. Por eso lo hemos diseñado para que muestre un color diferente para las tendencias alcistas y bajistas. Cada uno puede personalizarlo de la forma que más le convenga. Ajustando el Periodo de Tendencia, podemos optimizarlo para tendencias más lar
FREE
Forex y Oro OBI es un indicador innovador basado en el estudio de la dinámica de los precios y del mercado, utilizando el indicador RSI. Este indicador le ayuda a encontrar el mejor momento para entrar en el mercado de divisas señalando cuando el mercado está en condiciones de sobrecompra o sobreventa. Además, el indicador calcula dos posibles objetivos y el stop loss para cada operación, lo que le permite optimizar su relación riesgo/recompensa. Precio Este indicador es fácil de usar y configur
FREE

ADR 20 muestra el rango medio de pips de un par Forex, medido sobre un número de 20 días . Los operadores pueden utilizarlo para visualizar la posible acción del precio fuera del movimiento medio diario.
Cuando el ADR está por encima de la media, significa que la volatilidad diaria es más alta de lo normal, lo que implica que el par de divisas podría extenderse más allá de su norma.
El ADR también es útil para negociar retrocesos intradía. Por ejemplo, si un par de divisas alcanza el máximo de
FREE
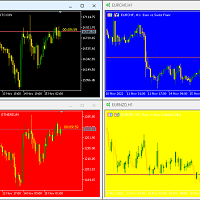
Hola de nuevo Este es un indicador gratuito que le proporciona un panel en la esquina de su gráfico para cambiar su fondo. Si desea ocultarlo, debe hacer clic en el botón de minimizar encima de los botones. ¡Hazme saber qué otros indicadores gratuitos necesitas! Si son fáciles los haré para ti ;) Muchas otras herramientas están en la fila. ¡Así que espera y mira! Espero que lo disfruten Sepehr (Faran)
FREE
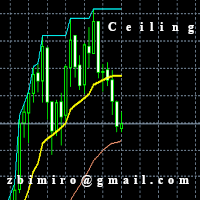
El indicador "Techo MT4" ha sido diseñado para determinar el punto de salida del mercado y se basa en una media móvil parametrizada y muestra 3 líneas. 1. Líneas de techo, que es el valor más alto / más bajo alcanzado actualmente en el gráfico en el horizonte establecido en el parámetro "Plafon Horyzon". 2. 2. La línea "Señal" que muestra la línea desplazada a la parte especificada en el parámetro "Parte_señal" se establece por defecto en 2, lo que significa que se encuentra a medio camino entre
FREE

Presentamos Round Range 5, un indicador versátil y dinámico diseñado para optimizar sus estrategias de trading en MT4. Exploremos cómo este indicador puede revolucionar su experiencia de trading adaptando los niveles de números redondos a las características únicas de cada instrumento.
En el vertiginoso mundo de los mercados financieros, los números redondos desempeñan un papel crucial. Estos niveles de precios, que terminan con varios ceros u otros dígitos significativos, suelen actuar como b
FREE
Este indicador para MT4 traza automáticamente puntos pivote diarios en el gráfico, proporcionando niveles clave de soporte y resistencia basados en los precios de apertura, cierre, máximo y mínimo del día anterior. Los puntos pivote ayudan a los operadores a identificar posibles áreas de reversión y zonas críticas de precios, mejorando la precisión en las decisiones operativas diarias."
FREE

Las líneas del eje X prevalecen en forma de cuadrícula, regidas por el Average True Range. Hay un cambio inevitable en períodos específicos de tiempo de este asunto! El indicador Average True Range (ATR) no se basa directamente en el volumen, sino que mide la volatilidad en los movimientos de los precios. Este indicador original en su personalización revelador, se extiende, ampliar, reducir, y evolucionar con 4 opciones oportunas de los estados de la cuadrícula! MATR significa "multiplicar el ve
FREE
El propósito de esta nueva versión del indicador estándar de MT4 proporcionado en su plataforma es mostrar en una sub-ventana múltiples marcos temporales del mismo indicador. Vea el ejemplo que se muestra en la imagen de abajo. Pero la visualización no es como un simple indicador MTF. Esta es la visualización real del indicador en su marco de tiempo. Aquí están las opciones disponibles en el indicador FFx: Seleccione los marcos de tiempo a mostrar (M1 a Mensual) Definir el ancho (número de barra
FREE
El propósito de esta nueva versión del indicador estándar de MT4 proporcionado en su plataforma es mostrar en una sub-ventana múltiples marcos temporales del mismo indicador. Vea el ejemplo que se muestra en la imagen de abajo. Pero la visualización no es como un simple indicador MTF. Esta es la visualización real del indicador en su marco de tiempo. Aquí están las opciones disponibles en el indicador FFx: Seleccione los marcos de tiempo a mostrar (M1 a Mensual) Definir el ancho (número de barra
FREE
Esta herramienta le ayuda a encontrar, revisar y documentar sus operaciones pasadas marcando las entradas y salidas mediante etiquetas de precio. Este indicador está diseñado para ayudarle a analizar sus operaciones para, por ejemplo, encontrar los puntos fuertes y débiles de su Asesor Experto/estrategia o incluso ayudarle a escribir su diario de operaciones mostrando claramente sus operaciones pasadas que desea volver a visitar. Para seleccionar sólo aquellas operaciones que fueron, por ejemplo
FREE

Indicador dinámico de volatilidad de precios (DPVI)
El Indicador Dinámico de Volatilidad de Precios (DPVI) está diseñado para proporcionar a los operadores información valiosa sobre la volatilidad del mercado y los posibles movimientos de los precios. Combina elementos de análisis de volatilidad e identificación de tendencias para ayudar a los operadores a tomar decisiones informadas.
Características: Bandas dinámicas de volatilidad: utiliza un algoritmo propio para calcular bandas dinámicas d
FREE

ContiStat restricted - Versión DEMO gratuita del indicador ContiStat
La versión gratuita del indicador es una DEMO de la versión completa de pago. La funcionalidad completa está disponible, sin embargo, el indicador sólo funciona en el período del gráfico M30 . Encuentre el indicador ContiStat para la funcionalidad completa
Descripción breve El indicador ContiStat calcula la frecuencia estadística del movimiento verde (arriba) y rojo (abajo) en el gráfico y determina la dinámica del movimiento
FREE

Este indicador utiliza la Media Móvil para detectar la tendencia de los mercados. Es una herramienta muy útil para el trading manual. Si la línea es azul noche, el indicador detecta una tendencia alcista. Si la línea es violeta oscuro, el indicador detecta una tendencia bajista. Las lecturas son muy fáciles de usar y entender. El indicador funciona mejor en el marco de tiempo H1. Puede utilizar este indicador con FollowLine para tener señales más precisas.
Puede obtener el código fuente desde a
FREE

La media móvil exponencial triple ( TEMA ) es una media móvil (MA) que da la mayor importancia a los datos de precios recientes. TEMA es más reactiva a todas las fluctuaciones de precios que una media móvil simple (SMA) o una media móvil exponencial (EMA) o incluso una media móvil doble (DEMA) y sin duda puede ayudar a los operadores a detectar antes los retrocesos porque responde muy rápido a cualquier cambio en la actividad del mercado. TEMA fue desarrollado por Patrick Mulloy en un intento de
FREE

El indicador muestra dos líneas de Media Móvil en el gráfico con los parámetros especificados en los ajustes. Emite una señal en forma de flechas y un sonido en la intersección de estas medias móviles. En la configuración del indicador, puede establecer el período de la media móvil rápida ( Fast MA Period ) y la media móvil lenta ( Slow MA Period ) . Y también Shift, Applied Price, Method y Timeframe para dos Medias Móviles por separado . Importante:
¡¡¡La principal diferencia con otros indicado
FREE
El uso de múltiples marcos temporales para el análisis con Multi Timeframe Average Directional Index puede proporcionar varios beneficios significativos para los operadores: Visión completa del mercado: Al aplicar Mtf ADX Standard a través de diferentes marcos temporales, los operadores obtienen una perspectiva más amplia de la dinámica del mercado. Esto les permite identificar tendencias, patrones y posibles puntos de reversión que podrían ser más evidentes o consistentes en varias escalas. May
FREE

Este indicador te ayudará a determinar la evolución del precio dependiendo de cómo estos objetos voladores se muestran en el gráfico. Cuando los planeadores abren sus alas considerablemente nos avisan de un posible cambio en la tendencia. Por el contrario, cuando parecen conseguir velocidad (mostrándose delgados pues las líneas de las alas se agrupan), demuestran seguridad y continuidad en la tendencia. Cada ala del planeador es una directriz entre el precio de cierre y los precios high/low de l
FREE

Este indicador traza una media móvil en 2 colores: Verde si la pendiente es alcista Rojo si la pendiente es bajista Nota: si el último valor de la media móvil es igual al anterior, el color será rojo. Obviamente puede editar el Periodo de la media móvil, la anchura, el modo de la MA (Simple, Exponencial, Suavizada y Lineal Ponderada) y el precio de la MA (Cierre, Apertura, Máximo, Mínimo, Precio Medio, Precio Típico, Cierre Ponderado).
FREE

Este indicador resuelve un defecto no reconocido del oscilador del índice del canal de materias primas (CCI). El CCI se basa en un filtro de paso alto que se calcula restando la media móvil simple de p periodos de una señal de precio (normalmente el valor típico) de la propia señal de precio. A continuación, el resultado se divide por la desviación media absoluta del mismo periodo. La respuesta en frecuencia de una señal menos su media móvil simple se muestra en la primera captura de pantalla (e
FREE
BestTF indicador le ayudará a elegir rápidamente el mejor marco de tiempo para el comercio de un par de divisas o cryptocurrency. El indicador BestTF calculará y mostrará en la tabla la inclinación del gráfico (volatilidad) para todos los marcos temporales existentes del instrumento de negociación actual. Por qué es importante elegir el marco temporal adecuado
La elección del marco temporal es un aspecto clave a la hora de operar en el mercado de divisas por varias razones:
Estrategias de nego
FREE
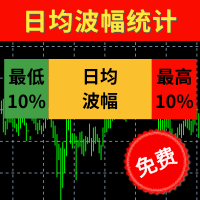
[ 10% más bajo] La volatilidad de los últimos 100 días de los gráficos de velas se cuenta y clasifica, y el 10% más bajo se muestra en pips. Volatilidad media diaria] Las estadísticas de la volatilidad media de los últimos 100 días de los gráficos de velas se muestran en pips. Highest 10%] La volatilidad de los últimos 100 días de gráficos de velas se cuenta y ordena, y el 10% más alto se muestra en pips. Hoy] La volatilidad de hoy se cuenta en pips, la posición de la flecha es la posición de l
FREE

Este indicador identifica los máximos y mínimos del mercado a corto, medio y largo plazo según el método descrito por Larry Williams en el libro "Long-term secrets to short-term trading".
Breve descripción del principio de identificación de los máximos y mínimos del mercado Un máximo a corto plazo es un máximo de una barra con máximos más bajos a ambos lados y, a la inversa, un mínimo a corto plazo de una barra es un mínimo con mínimos más altos a ambos lados. Los máximos y mínimos a medio pla
FREE

Indicador MACD suavizado (xMACD)
Parámetros de entrada : Fast EMA Period - periodo de la EMA rápida Período de la EMA lenta - período de la E MA lenta Señal SMA Período - período de la señal SMA Precio aplicado - tipo de precio (0 - CLOSE | 1 - OPEN | 2 - HIGH | 3 - LOW | 4 - MEDIAN | 5 - TYPICAL | 6 - WEIGHTED). Principio de funcionamiento El indicador recalcula el indicador técnico estándar MACD (promedia dos veces los valores obtenidos). El buffer del indicador no se redibuja.
FREE
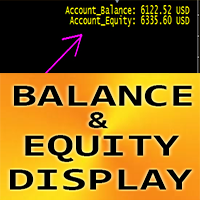
Este es un producto gratuito que puedes usar según tus necesidades.
¡Agradezco mucho tus comentarios positivos! ¡Muchas gracias!
// Excelentes robots e indicadores de trading disponibles aquí: https://www.mql5.com/en/users/def1380/seller
Indicador Crypto_Forex "Visualización de Saldo y Capital" para MT4: una excelente herramienta de trading.
- Este indicador muestra el saldo y el capital actuales de la cuenta. - Se pueden mostrar los valores en cualquier esquina del gráfico: 0 - esquina s
FREE
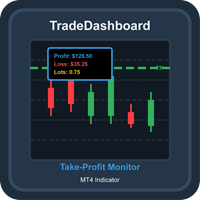
TradeDashboard Indicador MT4 Completo para Visualización y Análisis de Operaciones Descripción General TradeDashboard es un potente indicador para MetaTrader 4 diseñado para mejorar tu experiencia de trading mediante la visualización en tiempo real de los niveles de take-profit para todas las posiciones abiertas. Esta herramienta avanzada va más allá de los indicadores básicos de TP al mostrar métricas completas que incluyen ganancias potenciales, pérdidas y tamaños totales de lotes, todo direct
FREE

Puesto detallado explicado:
h ttps://www.mql5 .com/en/blogs/post/759269
Este es un indicador de pendiente para el indicador de Bandas de Bollinger. Proporciona pendientes para BB banda superior, banda central (principal) y la banda inferior. También puede establecer un valor umbral para la línea central para controlar las líneas del histograma de pendiente rojo/verde. Ajustes:
Puede elegir para qué línea necesita las Alertas de pendiente y Umbral en Desplegable.
Umbrales de pendiente: para las
FREE
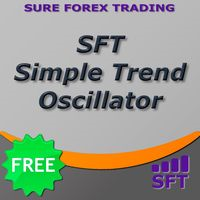
Oscilador direccional de tendencia con filtrado plano adicional Ayuda a navegar rápidamente cuando cambia la dirección del movimiento del precio y está pintado en el color apropiado Puede realizar operaciones de tendencia y contra tendencia Funciona en todos los marcos de tiempo, en cualquier par de divisas, metales y criptodivisas Se puede utilizar cuando se trabaja con opciones binarias Características distintivas No se redibuja Filtrado plano - cuando el histograma está en la zona amarilla; A
FREE
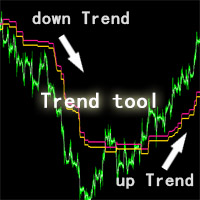
Esta herramienta ZhiBiQuShi es adecuada para todas las variedades y es adecuada para más de 5 minutos. ¡Es una buena herramienta para juzgar tendencias!
El precio es una tendencia a la baja por debajo de las dos líneas, y el precio es una tendencia al alza por encima de las dos líneas.
DESCRIPCION DE LOS AJUSTES
till_breakeven_rate: determina qué tan cerca seguirá el canal el precio hasta que se rompa el comercio. RECOMIENDA 1 espacio1: determina el ancho del canal desde el inicio de una
FREE

El indicador funciona como una extensión que cambia el color de las velas y del fondo del terminal con sólo pulsar un botón (Tema nocturno / Tema diurno). El usuario también puede configurar la visualización de la marca de agua del símbolo y especificar su tamaño. El menú interactivo permite alternar la visualización del valor Ask. Y cambiar la escala del gráfico de adaptativa a fija con un solo clic.
Puede añadir su color favorito a la configuración para cambiar.
FREE

Si usted está aburrido en el cambio repetido de símbolo de comercio en todos los gráficos cuando se utilizan varios gráficos para analizar los precios o el comercio. Este indicador puede ayudarle. Cambiará el símbolo de cualquier otro gráfico en el terminal para que sea el mismo que el del gráfico al que se ha conectado este indicador cada vez que añada un nuevo símbolo al gráfico o haga clic en el botón. Una vez finalizado el trabajo, el indicador dormirá tranquilamente a la espera de una nueva
FREE

Un indicador sencillo pero útil para controlar la volatilidad en las operaciones intradía.
El indicador traza los niveles de volatilidad media (ATR) para el número especificado de días en el gráfico actual.
En el día de negociación actual, los niveles son dinámicos y se mueven en función de los precios mínimo y máximo del día actual en modo "tiempo real".
En los parámetros de entrada especificamos
- el número de días para calcular y dibujar los niveles ATR
- el color de las líneas de nivel
FREE
Altopium Trend es un indicador que identifica tendencias a corto plazo. Las señales que genera pueden utilizarse para abrir posiciones largas o cortas o pueden integrarse con otros indicadores/estrategias. Se trata de un indicador de tendencia, tenga cuidado durante las fases laterales estrechas. Recomiendo utilizarlo como indicador de tendencia a corto plazo, complementado con otros indicadores que muestren los mejores momentos para entrar en el mercado.
Espere al cierre de la barra para conf
FREE
Muestra el spread actual en la ventana principal del gráfico. Configuración del indicador: BigDisplay =true o false para activar y desactivar.
DisplaySize = 20 es por defecto
DisplayColor = Azul
Display_y = 550 posición: posición Y del panel de fondo
Display_x = 1200 posición: posición X del panel de fondo
Autor: Happy Forex (Asesor Experto - su beneficio basado en algoritmos, sin estrés ni trabajo)
FREE
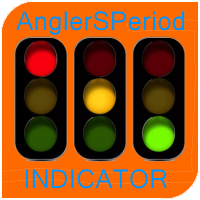
El indicador oscilador "AnglerSPeriod " forma parte de una serie de tres calculadores de la desviación angular del gráfico de precios de un instrumento de negociación.
PARÁMETRO DE ENTRADA: DRAWs=128 - Número de barras para mostrar el indicador en el historial del gráfico; PeriodIND=14 - período de cálculo del indicador en el número de barras.
Los valores de los indicadores son grados . La presencia de un Fuerte Movimiento del precio comienza con un valor de +-45 grados, y no puede superar lo
FREE

Asesor Experto "Sniper FX": Precisión Milimétrica para Tus Operaciones El asesor experto "Sniper FX" redefine la precisión en el trading automatizado al ofrecer un enfoque estratégico centrado en pocas, pero extraordinariamente precisas, entradas en el mercado. Inspirado por la agudeza de un francotirador, este asesor experto utiliza algoritmos avanzados para identificar oportunidades óptimas de compra y venta, maximizando el potencial de beneficios mientras minimiza la exposición al mercado.
FREE

TPP : Patrón del punto de inflexión El indicador muestra el mercado Turning Point Pattern como flechas. Las señales de inversión se basan en la observación de la acción del precio y el comportamiento del mercado. Se basa en los principios de búsqueda de extremos, volatilidad y patrones de velas. El indicador proporciona señales sobre los siguientes principios: Búsqueda del final de la tendencia ascendente/descendente Búsqueda del patrón de inversión basado en el patrón de velas Confirmación de l
FREE

Oscilador de histograma cruzado MA (MT4) El Oscilador MA Cross Histogram es un indicador personalizado diseñado para visualizar la relación entre dos medias móviles en forma de histograma codificado por colores. En lugar de dibujar líneas MA estándar en el gráfico, destaca la fuerza y la dirección de la tendencia comparando la diferencia entre una media móvil rápida y una lenta. Barras verdes : impulso alcista (la MA rápida está por encima de la MA lenta y sube). Barras rojas: impulso bajista (l
FREE

Proporcionamos indicadores adaptados para satisfacer mejor sus necesidades de trading >> MT Sideway Filter <<
MT Focus Sesión : Centrado en el seguimiento de los tiempos de sesión, el indicador MT Focus Session enfatiza la actividad del mercado desde la apertura hasta el cierre, con preferencia por los periodos de alto volumen entre la apertura de Londres y el cierre de Estados Unidos.
operativa: forex
MARCO TEMPORAL: M5 M15 M30 H1
PAR DE SÍMBOLOS: Todos los símbolos
AJUSTES:
SESI
FREE

El indicador " Ticks Overcome Signal ", como se indica en su código proporcionado, es una herramienta personalizada diseñada para su uso con MetaTrader 4 (MT4), una plataforma popular para el comercio de divisas. Este indicador parece centrarse en el seguimiento del impulso y la dirección de los movimientos de los precios contando los ticks consecutivos al alza y a la baja. He aquí una visión general de los aspectos psicológicos, los beneficios lógicos, y las instrucciones de uso de este indicad
FREE

El indicador MAS puede utilizarse en todos los pares de divisas y en cualquier marco temporal, por lo que es adecuado para cualquier velocidad de negociación. Además, es relativamente fácil operar con el indicador MAS. Este indicador produce dos señales: Señal de COMPRA: flecha azul cielo Señal de VENTA: flecha roja
Parámetros del indicador MA Method - tipo de media móvil MA Shift - desplazamiento de la media móvil Fast - media móvil de período rápido Slow - media móvil de periodo lento RSI - v
FREE

Precision Entry Master: Su clave para operar con confianza ¿Cansado de dudar de sus operaciones? El indicador Precision Entry Master está diseñado para ayudarle a encontrar puntos de entrada de alta calidad con confianza. Combina dos potentes análisis de mercado para ofrecerle una señal clara, filtrando el ruido y las señales falsas para que pueda centrarse en las mejores oportunidades. Nuestro sistema único funciona encontrando el momento perfecto cuando el impulso del mercado está cambiando y
FREE

GM Reverse Indicator trabaja en Fibonacci junto con algunos otros ajustes
-> Está programado para automatizarse al 100% cuando el mercado fluctúa Este indicador lo uso para encontrar puntos de soporte. Realmente funciona y quiero compartirlo con ustedes.
-> Simplemente adjunte el indicador GM Reversal a cualquier gráfico que desee. Cuanto mayor sea el marco de tiempo, mejor será la calidad de la señal (se debe utilizar con el marco de tiempo de H4) -> Esta es mi señal : https://www.mql5.com/e
FREE

SmartChanelFree es un indicador universal para todo tipo de mercados. Este indicador debe tener en su arsenal cada comerciante, ya que representa un enfoque clásico para analizar el precio de un instrumento de comercio y es una estrategia de negociación listo. El indicador forma el límite superior y medio del movimiento del precio. ¡¡¡Atención !!! Esta versión del indicador es de prueba y funciona sólo en el gráfico con el período M1. La versión completa del indicador se puede encontrar en: htt
FREE
Pequeña decoración para MT4.
Inscripción en el fondo.
Muestra el par de divisas y el intervalo de tiempo.
Puede una serie de ajustes por cambio de color, Tamaño, ubicación, indicación de intervalo de tiempo.
Configuración De Promark: TURN_OFF-encender / apagar la decoración;
Show Period-activar / desactivar el intervalo de tiempo;
Mychartx-ubicación en el eje X;
Mycharty-ubicación en el eje Y;
My Corner - ubicación en las esquinas del gráfico;
My font Size-Tamaño de la decorac
FREE

Título del producto Smart Momentum (MT4) – parte de la serie SmartView Indicators Descripción breve Indicador Momentum con una experiencia de usuario única en la plataforma MetaTrader. Ofrece capacidades avanzadas no disponibles anteriormente, como abrir configuraciones con doble clic, ocultar y mostrar indicadores sin eliminarlos, y mostrar la ventana del indicador a tamaño completo del gráfico. Diseñado para funcionar perfectamente con el resto de la serie SmartView Indicators. Visión general
FREE
Los canales de Fibo con los suportes y resistencias en D1 - just for free!
¡Conviértase en un comerciante de divisas de 5 estrellas constantemente rentable! ¡Ofrecemos algunos indicadores para ayudarlo a comprender y analizar el mercado! Con nuestras estrategias mejorarás tu sistema de trading y te convertirás en un experto... ¡Tenemos indicadores para la dirección de la tendencia, la dirección del mercado y otros... para marcos de tiempo múltiples y que cubren todas las principales o sus símb
FREE

AHORA PUEDE DESCARGAR VERSIONES GRATUITAS DE NUESTROS INDICADORES DE PAGO . ES NUESTRA FORMA DE RETRIBUIR A LA COMUNIDAD. >>> IR AQUÍ PARA DESCARGAR
Momentum channel es un sistema simple basado en el impulso, pero con un gran grado de precisión en la detección de puntos de inflexión. El momentum del mercado está definido por canales de Average True Range. Cuando el precio rompe estos canales la mayoría de las veces, es una indicación de un cambio en el impulso del mercado y por lo tanto una po
FREE
El indicador ChartOverlay tiene dos funciones principales 1. reflejar - es decir, por ejemplo, hará USDEUR de EURUSD 2. mostrar el gráfico de precios del instrumento financiero seleccionado (con el período seleccionado) en la subventana del gráfico principal. Esta herramienta permite a los operadores analizar fácilmente la relación entre diferentes pares de divisas y activos, ofreciendo características únicas de personalización y visualización.
Características principales: Visualización del grá
FREE

InpRSIshort=13 ; // RSI corto InpRSIPeriod=34 ; // RSI largo PeriodRs=0 ; //Precio 0C 4HL/2 5HLC/3 mafast=13 ;//mafast maslow=65 ;//MAslow
Doble línea RSI sub gráfico index. The parámetros son ajustables. Las líneas RSI con dos ciclos diferentes se pueden utilizar para observar la fuerza de la tendencia effectively. Meanwhile, un período corto cruzar período largo columna de color image.When se muestra a continuación el ciclo (Jin Cha) está en el ciclo corto, el color del mapa de la columna ca
FREE

Volatilidad bajo control. El indicador muestra la profundidad óptima para fijar objetivos en el día y en la tendencia media. También construye zonas pivote para la profundidad de corrección estimada. Como acompañamiento, se muestran los niveles clave de la estructura para varios marcos temporales. Para el cálculo se utilizan los indicadores clásicos de volatilidad ATR y ADX en plazos fijos. El cálculo tiene en cuenta el spread, y si el mercado es ligeramente volátil, verá una advertencia sobre e
FREE
MetaTrader Market - robots comerciales e indicadores técnicos para los trádres, disponibles directamente en el terminal.
El sistema de pago MQL5.community ha sido desarrollado para los Servicios de la plataforma MetaTrader y está disponible automáticamente para todos los usuarios registrados en el sitio web MQL5.com. Puede depositar y retirar el dinero a través de WebMoney, PayPal y tarjetas bancarias.
Está perdiendo oportunidades comerciales:
- Aplicaciones de trading gratuitas
- 8 000+ señales para copiar
- Noticias económicas para analizar los mercados financieros
Registro
Entrada
Si no tiene cuenta de usuario, regístrese
Para iniciar sesión y usar el sitio web MQL5.com es necesario permitir el uso de Сookies.
Por favor, active este ajuste en su navegador, de lo contrario, no podrá iniciar sesión.