Indicadores técnicos para MetaTrader 4 - 37
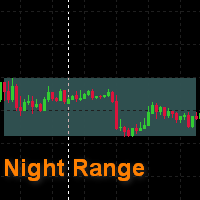
Este es un simple indicador que dibuja un rango nocturno. El comienzo y el final de un día laborable se especifican en horas, los rectángulos de color también se ajustan . Ayuda a ver el historial en busca de regularidades , excluyendo las horas nocturnas impredecibles . Se puede utilizar para buscar una ruptura de la franja nocturna. Se dibuja como fondo y no cubre el gráfico ni otros indicadores .
FREE

Líneas verticales de tiempo. Un indicador sencillo que dibuja en el gráfico líneas verticales de tiempo. 1,3,5,10,12,15,20,30,60 minutes. Puede cambiar el color de la línea, el estilo de la línea, seleccionar un período de tiempo de 1 a 60 minutos. Se aplica a cualquier gráfico, timeframe. Parámetros de entrada: Minute_Num = 20; // paso 3,5,12,10,20,15,30,60 minutos color Line_Color = clrYellow; // color de la línea Line_Dash = 2; //0,1,2,3,4... solid, dash, dot, dash dot,dash dot dot
FREE

Horario de la sesión de la Bolsa de Londres
Este indicador facilita la observación de las cotizaciones del par de divisas durante las siguientes partes de la sesión bursátil en directo. Antes de que comience la sesión, se dibuja un rectángulo en el gráfico, pero no se rellena de color. Significa la extensión de la duración de la sesión. Antes de que la primera barra entre en el rectángulo de la sesión, una señal sonora o una ventana emergente nos avisará de que la sesión acaba de comenzar. Cua
FREE
El propósito de esta nueva versión del indicador estándar de MT4 proporcionado en su plataforma es mostrar en una sub-ventana múltiples marcos temporales del mismo indicador. Vea el ejemplo que se muestra en la imagen de abajo. Pero la visualización no es como un simple indicador MTF. Esta es la visualización real del indicador en su marco de tiempo. Aquí están las opciones disponibles en el indicador FFx: Seleccione los marcos de tiempo a mostrar (M1 a Mensual) Definir el ancho (número de barra
FREE

El indicador le permite operar con opciones binarias. El marco de tiempo recomendado es М1 y el tiempo de caducidad es de 1 minuto. El indicador adecuado para el comercio automático y manual. Una posible señal se especifica como una flecha por encima / debajo de una vela. ¡Usted debe esperar hasta que la vela se cierra! Las flechas no se repintan Sesiones de negociación: Sección de Londres y Nueva York Pares de divisas: EUR/GRB Marco temporal de trabajo: M1 Tiempo de expiración: 1 minuto El ind
FREE

ESTE INDICADOR GRATUITO LE PERMITE ESTABLECER EL MARCO TEMPORAL DE LA MA QUE DESEE EN SU GRÁFICO. Por ejemplo, es muy útil si quieres operar la H4 200 SMA usando un gráfico de marco de tiempo inferior, para identificar reacciones del precio como reversiones, esquemas de Wyckoff, etc. ***Por favor, comenta, valora y compártelo con tus amigos si te gusta*** ------------------------------------------------------------------------- Las medias móviles son indicadores técnicos populares utilizados par
FREE
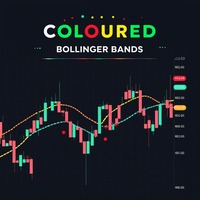
Bandas de Bollinger coloreadas El indicador Bandas de Bollinger coloreadas es una versión mejorada de las Bandas de Bollinger estándar, que ofrece características personalizables para adaptarse a sus necesidades de negociación. Utiliza la clásica Media Móvil Simple (SMA ) como banda intermedia, y le permite cambiar fácilmente la apariencia de las bandas, incluyendo la opción de seleccionar colores y tipos de línea, asegurando una mejor claridad visual y adaptabilidad en sus gráficos.
FREE
DMI Show High Low: Visualiza los Niveles Clave del Mercado en Tiempo Real ¡100 % gratis, funcional y sin limitaciones! El DMI Show High Low es una herramienta esencial para los traders, diseñada para mostrar los niveles High, Low y Close de un marco de tiempo seleccionado directamente en tu gráfico. Ideal para identificar zonas clave del mercado, este indicador ayuda a mejorar tu toma de decisiones y la precisión en tu trading. Parámetros : Marco de Tiempo : Selecciona el marco de tiempo para mo
FREE

Estudio no propietario de Joe Dinapoli utilizado para el análisis de tendencias. El indicador emite señales de tendencia cuando la línea rápida penetra en la línea lenta. Estas señales permanecen intactas hasta que se produce otra penetración. La señal se confirma al cierre del periodo. Es aplicable a todos los marcos temporales. Parámetros EMA rápida: periodo de la media móvil rápida. EMA lenta: periodo de la media móvil lenta. Signal EMA: periodo de la línea de señal. *************************
FREE

¡Mejora tu trading y añade más emoción con la nueva versión del Escáner RSI! Agrupación Automática de Instrumentos : El escáner recopila automáticamente todos los instrumentos de tu Lista de Observación y los organiza en cuatro categorías: Mayores, Menores, Exóticos y Otros. Selección Personalizada de Señales : En la página de configuración, puedes elegir qué instrumentos deseas escanear en busca de señales. Selección de Marco Temporal Flexible : También puedes especificar los marcos temporales
FREE
El producto ayuda a encontrar el pico más alto y el mínimo más bajo. Ayuda a los inversores a optimizar los beneficios. Con una tasa de ganancias de hasta el 80%. No es necesario ajustar ningún parámetro. Hemos optimizado el mejor producto. Su trabajo sólo tiene que ver y el comercio. Productos con avances tecnológicos. Contacte con otros productos: https://www.mql5.com/en/users/hncnguyen/news.
FREE

Este indicador está diseñado para encontrar la diferencia entre el precio MOMENTUM y el indicador. Este indicador muestra la diferencia entre el precio y el indicador en la pantalla. El usuario es alertado con la función de envío de alertas. Nuestros Productos Populares Super Oscilador Señal Cruzada HC Super Tendencia Cruzada Tendencia Fuerte Super Señal Parámetros divergenceDepth - Profundidad de búsqueda del 2º punto de ref. Momentum_Period - Segundo periodo de cálculo indAppliedPrice - Precio
FREE
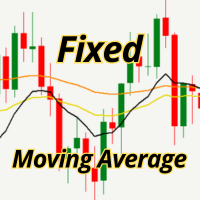
Visualiza cualquier media móvil en su temporalidad original, sin importar el timeframe del gráfico.
¿Qué hace?
Este indicador te permite ver una media móvil de cualquier temporalidad (M5, H1, H4, D1, etc.) directamente en tu gráfico actual, manteniendo sus valores originales de la temporalidad que elegiste.
Ejemplo práctico:
Estás operando en M5
Activas la MA de H1 con este indicador
Ves exactamente la misma línea que verías si cambiaras a H1
Sin cambiar de timeframe
Características
Cua
FREE

Forex trend omega es un indicador de seguimiento de tendencia que filtra el ruido del mercado para hacer entradas perfectas para seguir la tendencia o detectar cambios de tendencia. Las posibilidades son infinitas para el uso de este indicador, se puede utilizar en cualquier marco de tiempo para encontrar tendencias que coincidan con su estrategia de negociación. Lo MEJOR de este indicador es que NO REPITE . Esto hace que sea un indicador muy singular y es un MUST HAVE en su cartera de indicador
FREE

Echa un vistazo a otros grandes productos de https://www.mql5.com/en/users/augustinekamatu/seller
Este indicador es el mejor hasta ahora para determinar la fuerza de la divisa de cada par. Proporciona valores estables y se adapta muy bien a los cambios del mercado. Es una gran herramienta para añadir a su arsenal para asegurarse de que está en el lado derecho de la tendencia en todo momento. No se requieren entradas, es simple plug and play. Una estrategia ganadora En este artículo se describen
FREE

Este indicador mostrará las sesiones de negociación activas e inactivas, así como también establecerá variables globales como si la sesión de negociación está activa (1) o inactiva (0). Usando la función de biblioteca iCustom, puede invocar este indicador desde un Asesor Experto o Script, de la siguiente manera, // Invocar indicador personalizado iCustom ( Symbol (), PERIOD_D1 , "Market/RedeeCash_TimeZone" , 0 , 0 ,Blue,Red); // obtener los valores de las variables globales double NewYorkSession
FREE

El indicador Super Channels es un indicador de canal creado mediante el cálculo de los niveles de soporte y resistencia. Lo calcula tomando la media de los niveles de soporte y resistencia. Después de determinar el número de velas, toma los niveles del número de velas y crea un canal autónomo de acuerdo con estos niveles. Si desea calcular cuántas velas, debe introducir el número en la sección de parámetros. Además, hay dos tipos de modos en el indicador. El primero es calcular en base a los niv
FREE

El Indicador Calculador Visual de Resultados es una potente herramienta diseñada para mejorar su experiencia de negociación en la plataforma MetaTrader. Este indicador intuitivo y fácil de usar le permite visualizar las ganancias o pérdidas potenciales en un gráfico de operaciones, ayudándole a tomar decisiones mejor informadas y a gestionar sus operaciones con precisión. El indicador muestra una línea dinámica en el gráfico de operaciones, que representa las ganancias o pérdidas potenciales de
FREE

Este indicador se basa en el Canal . Parámetros de entrada channel_One- mostrar la línea de tendencia Uno encendido o apagado. timeFrame_One - marco de tiempo del canal Uno . ColorChannel_One - color de la linea de tendencia Uno. channel_Two- muestra la línea de tendencia Dos activada o desactivada. timeFrame_Two - marco de tiempo del canal Dos. ColorChannel_Two - color de la línea de tendencia Dos. channel_Three- activa o desactiva la línea de tendencia Tres. timeFrame_Three - marco de tiempo d
FREE

Este indicador muestra los valores SWAP actuales (tanto para posiciones de compra como de venta) de los distintos instrumentos de negociación directamente en el gráfico.
Permite a los operadores identificar rápidamente qué símbolos tienen swaps positivos o negativos, ayudándoles a tomar mejores decisiones a la hora de elegir posiciones que puedan ser más ventajosas para mantener a largo plazo. ️ Configuración del indicador Selección de los símbolos mostrados El usuario puede elegir qué instrume
FREE

El indicador Flag Streamer Pattern es un indicador diseñado para encontrar patrones de banderas y gallardetes. Cuando la leyenda encuentra patrones, dibuja líneas en la pantalla del gráfico. Las líneas de color magenta representan el patrón de banderines. Los patrones de color aguamarina representan el patrón de banderines. Puede cambiar los colores de los patrones de acuerdo a su solicitud. Nuestros productos más populares Super Oscilador Señal cruzada HC Super Tendencia Cruzada Tendencia fuert
FREE

Sombra de Sesión (MT4) - Sombra de Fondo en Horas No Comerciales Visión general Session Shade es un indicador ligero para MT4 que resalta visualmente las horas no comerciales sombreando el fondo del gráfico.
Está diseñado para ayudarle a confirmar su ventana de filtro de tiempo diario de un vistazo. Esta es sólo una herramienta de visualización. No genera señales de trading ni coloca, modifica o cierra órdenes. Características principales Sombrea las horas no comerciales (NG) en el fondo del gr
FREE

Recordatorio MA Resumen MA Reminder es un indicador versátil de medias móviles que proporciona señales visuales y colores de fondo para ayudar a los operadores a identificar la dirección de la tendencia y las posibles oportunidades de negociación basadas en cruces de medias móviles. Características principales Múltiples medias móviles : Muestra hasta 4 medias móviles configurables en el gráfico. Coloración del fondo : Resalta el fondo del gráfico en función de los cruces de MA1 y MA2 Flexibilida
FREE

Marginhedged Indicador de información. Lote: establezca el lote requerido para los cálculos, establezca utilizando el campo de entrada MARGININIT: requisitos de margen inicial para el lote especificado MARGINHEDGED - Margen cobrado por pedidos superpuestos por lote establecido PERCENT - Margen cobrado en pedidos superpuestos expresado como porcentaje Descripción de la configuración del indicador: _color - establecer color Un ejemplo de uso del indicador:
Una posición de compra con el lote 1
FREE

¡Domine el mercado con Reversal Dominator! ¿Cansado de perseguir tendencias sólo para quedar atrapado en una reversión repentina? Reversal Dominator es su arma definitiva para detectar los giros del mercado de alta probabilidad antes de que sean obvios. Este poderoso indicador aprovecha un sofisticado cálculo de Fuerza Absoluta, junto con un filtro inteligente de media móvil, para darle la ventaja precisa necesaria para entrar o salir de las operaciones con confianza. ¿Por qué elegir Reversal D
FREE

Este indicador está basado en los osciladores "Bulls" y "Bears", ambos presentados en el libro "Come into my trading room" del Doctor Alexander Ray. "Elder Ray" o "Los Rayos de Elder" fueron hechos con el objetivo de indentificar la presión compradora y vendedora en los mercados. El indicador presentado es básicamente la unión de los osciladores previamente mencionados pero de una forma eficiente para facilitar la identificación de los patrones de los precios, divergencias, etc. El parámetro b
FREE

Después de 7 años he decidido publicar algunos de mis indicadores y EA de forma gratuita.
Si los encuentras útiles, por favor ¡Muestra tu apoyo con una valoración de 5 estrellas! ¡Tu feedback mantiene las herramientas gratuitas llegando! Ve también mis otras herramientas gratuitas aquí
_________________________________ Indicador de Promedio Móvil de Volumen (Volume MA) para Análisis Avanzado del Mercado Forex Presentamos el Indicador de Promedio Móvil de Volumen (Volume MA), desa
FREE

UniversalFiboChannel es un indicador universal, que construye un canal de negociación de acuerdo con los niveles de Fibonacci. Este indicador es una estrategia comercial de canal completa. El indicador se instala de la forma habitual y funciona con cualquier herramienta de trading. Opciones HelpBasisTF = "M: 43200; W: 10080; D1: 1440; H4: 240; H1: 60" es una sugerencia para el parámetro BasisTF .
BasisTF = 1440 - período base para calcular los niveles de Fibonacci DisplayDecimals = 5 - el núme
FREE

TripleSync Pro FX es un avanzado indicador multidimensional de sincronización de tendencias diseñado específicamente para los operadores de Forex, que combina las tres dimensiones fundamentales del impulso de los precios, el análisis de la volatilidad y el sentimiento del mercado, y utiliza algoritmos inteligentes para identificar con precisión los puntos de inflexión en la tendencia del mercado, ayudando a los operadores a tomar decisiones más inteligentes en un entorno de mercado complejo y vo
FREE

El bloque de barras se recoge en condiciones de convergencia . Si no se cumplen las condiciones de convergencia, se elimina el bloque. Más concretamente, la condición es la transición del bloque de barras del estado de convergencia al estado de divergencia . Los bloques se forman selectivamente con huecos. Los huecos se caracterizan por el estado de divergencia de las barras. Antes de eliminar el bloque, encontramos las barras extremas dentro del bloque ( mín, máx). La línea une las barras extr
FREE

Visualización de la línea de tendencia hipotética
Distancia de la línea de tendencia
Se puede utilizar en todos los símbolos
Se puede utilizar en todos los marcos temporales
Un indicador interesante para predecir ondas pequeñas
Cuanto mayor sea la distancia de la línea de tendencia, más probable es que vuelva a la línea de tendencia
Ajustes:
Los tres primeros(osic 1,2,3):
son los mismos que los ajustes del indicador zigzag
Cuanto más grandes sean estos números, más grandes serán las líneas de
FREE

Indicador para la 4ª estrategia del EA Pipsurfer. Este indicador permitirá al usuario ver visualmente los puntos de entrada para la estrategia 4 de Pipsurfer. En la configuración que usted será capaz de ajustar los parámetros para mezclar y combinar a su estilo de negociación y encontrar la configuración que desea, ya sea para el comercio de forma manual o sintonizar la EA hacer. La estrategia 4 utiliza un enfoque de continuación de tendencia de estructura de mercado para operar y busca máximos
FREE
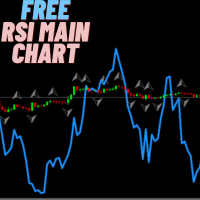
Este indicador funciona de forma similar al Índice de Fuerza Relativa (RSI) tradicional, pero está integrado directamente en el gráfico de precios principal. Esta configuración permite a los operadores identificar más fácilmente las fluctuaciones de los precios y reconocer las condiciones de sobrecompra o sobreventa de los mercados. Al observar el indicador junto con los movimientos de los precios, puede obtener información valiosa sobre posibles cambios de tendencia o el impulso continuado. Est
FREE

Resumen Este indicador se basa en los indicadores RSI y Momentum. También considera las medias móviles de estos dos indicadores. Los tres indicadores tienen configuraciones ajustables. Las flechas no se repintan ya que el indicador sólo utiliza valores confirmados y espera a que la vela se cierre antes de pintar una flecha. El indicador también es capaz de alertar cuando aparecen las flechas. Hay 3 tipos de alertas - Popup, Email y Notificaciones Móviles Push. Las flechas se pueden utilizar en e
FREE

Similar a la lógica utilizada en: Golden MA MTF TT Resumen
Indicador "Golden MA" para niveles OB/OS. Se basa en los máximos/mínimos de la barra anterior del marco de tiempo superior (HTF). Sólo útil en swing trading o scalping. Mejor para al menos M15+. Para marcos de tiempo más bajos necesitará cambiar StartPips a un valor más bajo para obtener líneas consistentes. Porque los marcos de tiempo más bajos tendrán distancias de pip más pequeñas. Características - Defina plazos superiores para el pl
FREE
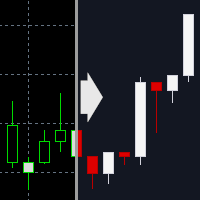
Este indicador aplica un tema oscuro a los gráficos de MetaTrader 4. Diseñado para facilitar la lectura, utiliza un esquema de color tranquilo para ayudar a reducir la fatiga visual durante largas sesiones de gráficos. Opcionalmente, puede aplicar el tema a todos los gráficos abiertos a la vez. Después de la aplicación, el indicador también se puede eliminar automáticamente, por lo que nada innecesario permanece en su gráfico.
A quién va dirigido este indicador Traders que quieren ordenar rápid
FREE

Un indicador clásico con funciones avanzadas para una visualización más precisa de la situación del mercado. Están disponibles todos los ajustes de las medias móviles, como el tipo de media móvil y el precio utilizado en su cálculo. También es posible cambiar la apariencia del indicador - línea o histograma. Parámetros adicionales proporcionan la capacidad de ajuste fino.
Características distintivas No se redibuja. Parámetros adicionales para el ajuste fino. Se muestra como una línea o como un
FREE

MQLTA Support Resistance Lines es un indicador que calcula los niveles históricos de Soporte y Resistencia y los muestra como Líneas en el gráfico. También le avisará si el precio está en una zona segura o peligrosa para operar y le mostrará la distancia hasta el siguiente nivel. El indicador es ideal para ser utilizado en otros Expert Advisor a través de la función iCustom. Esta DEMO sólo funciona con AUDNZD, el producto completo se puede encontrar en https://www.mql5.com/en/market/product/2632
FREE

¡3 estrategias con RSI! ¡Alertas! ¡Comprobación de la frescura de la señal! El indicador se basa en el clásico RSI. I recommend watching my advisor - Night Zen EA Incluye 3 estrategias: Entrada del indicador RSI en la zona de sobrecompra (para operaciones de compra) / sobreventa (para operaciones de venta) Salida del indicador RSI de la zona de sobrecompra (para operaciones de venta) / sobreventa (para operaciones de compra) Tocar el límite de sobrecompra (para operaciones de venta) / sobreven
FREE

El indicador muestra señales en el gráfico del indicador RVI clásico con una alerta.
El indicador emite señales tras la confirmación de la estrategia en la apertura de una nueva barra. I recommend watching my advisor - Night Zen EA En los ajustes, puede seleccionar las siguientes estrategias : La línea principal cruza la línea de señal La línea principal cruza el nivel cero En la configuración, puede cambiar el período del indicador RVI clásico.
También recomiendo mirar mis otros desarrollo
FREE

Analice la volatilidad haciendo clic en una vela específica, lo que desencadena la visualización de líneas de cuadrícula horizontales centradas alrededor del precio de cierre de la vela, espaciadas por múltiplos del ATR calculado. Una línea vertical resalta la vela seleccionada, y una etiqueta de texto opcional puede mostrar el valor del ATR en puntos por encima de la vela. El indicador es ligero, no utiliza búferes y se basa en objetos gráficos para su visualización. Incluye gestión de errores
FREE
Indicador "Time to Bar End" (TimeToBarEnd)
Este indicador técnico está diseñado para realizar un seguimiento preciso del tiempo restante hasta el cierre de la vela actual en el gráfico. Muestra una cuenta atrás en formato minutos:segundos, lo que resulta especialmente útil para operadores intradía y scalpers que necesitan conocer la hora exacta de cierre de la vela actual. El indicador se actualiza en tiempo real y ofrece una personalización flexible de su apariencia. Los ajustes incluyen: elec
FREE

La Transformada de Fisher es un indicador técnico creado por John F. Ehlers que convierte los precios en una distribución normal gaussiana. El indicador destaca cuándo los precios se han movido a un extremo, basándose en precios recientes. Esto puede ayudar a detectar puntos de inflexión en el precio de un activo. También ayuda a mostrar la tendencia y a aislar las ondas de precios dentro de una tendencia. La Transformada de Fisher es un indicador técnico que normaliza los precios de los activo
FREE

Información diaria semanal
muestra la apertura diaria y semanal y la tendencia de apertura diaria (es decir, apertura diaria > apertura del día anterior) y la tendencia de apertura semanal (es decir , apertura semanal > apertura de la semana anterior ) Máximos y mínimos del día y máximos y mínimos semanales y máximos y mínimos de la semana anterior esto le ayudara a decidir su operativa, no necesita comprobar un marco temporal superior cuando opere intradía,
no opere en contra de la tendencia
FREE

Harami es un patrón de dos velas con la vela reciente formada dentro del máximo y mínimo de la vela anterior. Representa la indecisión en el mercado y se utiliza para la estrategia de negociación de la acción del precio de ruptura. Este indi dispara todas las señales a un tablero en el gráfico incluyendo alerta pop_up, push a la notificación del teléfono y correo electrónico. Harami tiene dos tipos, alcista y bajista. Entre largo para Harami alcista y entre corto para Harami bajista. Entradas :
FREE
El indicador de swaps permite supervisar los tipos de swap de los instrumentos deseados en un solo lugar. Hay varias formas de elegir la lista de instrumentos para el indicador: Seleccionar instrumentos de Market Watch Seleccionar todos los instrumentos Seleccionar instrumentos de la lista ajustada manualmente Todos los ajustes de color son ajustables en el indicador: se puede ajustar el color para los encabezados, para los nombres de los símbolos, para los swaps positivos y negativos. También s
FREE
Este indicador permite ocultar la media móvil (en todos los timeframes de MT4) de una fecha definida por el usuario con una línea vertical (Alone) o un panel (con "Hidden Candles"). Entradas del Indicador: Periodo MA Desplazamiento MA Método MA MA Aplicar a La información sobre el indicador "Media Móvil" está disponible aquí: https: //www.metatrader4.com/en/trading-platform/help/analytics/tech_indicators/moving_average ************************************************************* Hola traders!!
FREE

NostradamusMT4 es un potente indicador del kit del trader profesional. El indicador se basa en el método de cálculo de precios del autor Andrey Spiridonov (PRECIO ESTIMADO) para el precio actual de la vela. Este indicador es un sistema de comercio independiente. El indicador es adecuado para trabajar en los mercados de opciones clásicas y binarias.
Ventajas
El indicador no se redibuja; Funciona en cualquier intervalo de tiempo; Funciona con cualquier instrumento de comercio; Ideal para scalping
FREE

El indicador de partición de sesiones traza separadores de sesión claros y precisos para las sesiones de negociación de Sidney, Tokio, Londres y Nueva York .
Se adapta automáticamente a la hora del servidor de su broker y permite una personalización GMT completa. Diseñado especialmente para Mercados IC (Invierno - GMT+2) , este indicador ofrece a los operadores una estructura visual limpia de las fases intradía del mercado - haciendo que las estrategias basadas en sesiones sean MUCHO más fáciles
FREE

El uso de múltiples marcos temporales para el análisis con las Bandas de Bollinger Multi Timeframe puede proporcionar varios beneficios significativos para los operadores: Visión completa del mercado: Al aplicar Mtf Bands Standard a través de diferentes marcos temporales, los operadores obtienen una perspectiva más amplia de la dinámica del mercado. Esto les permite identificar tendencias, patrones y potenciales puntos de reversión que podrían ser más evidentes o consistentes a través de varias
FREE

El indicador GRATUITO Icarus Reversals(TM) es una potente herramienta para identificar puntos de inversión de alta probabilidad, en todos los instrumentos. El Indicador Reversals proporciona a los operadores e inversores una visión sencilla y muy dinámica de los puntos en los que es probable que se produzcan retrocesos en el precio. Generado por un código único, el Indicador de Reversiones (versión GRATUITA) genera señales de operaciones largas y cortas, que pueden ser personalizadas para entrad
FREE

Velas Tamaño ( Puntos ) Por favor, deje un comentario sobre este producto para ayudar a otros usuarios a beneficiarse de él. Esta sencilla herramienta proporciona información crucial sobre las condiciones actuales e históricas del mercado, ayudando a los operadores a tomar decisiones informadas. Identifica la vela más larga en un periodo histórico personalizable. Esta información le ayuda a detectar movimientos significativos de los precios. Vea en YOUTUBE las características principales Este i
FREE
Daily Volatility Tracker es un indicador práctico y ligero diseñado para ayudar a los operadores a controlar y analizar la volatilidad del mercado basándose en los movimientos históricos diarios de los precios. Si usted es un comerciante del día, comerciante del oscilación, o scalper, entendiendo cuánto un mercado mueve por día es crítico para: Elegir los pares adecuados para operar Establecer niveles precisos de stop-loss y take-profit Adaptarse a las condiciones cambiantes del mercado Versión
FREE

El indicador Magic EMA es de gran ayuda para determinar la dirección de la tendencia. Puede ser un excelente complemento para su estrategia actual o la base de una nueva. Los seres humanos podemos tomar mejores decisiones cuando vemos mejor visualmente. Por eso lo hemos diseñado para que muestre un color diferente para las tendencias alcistas y bajistas. Cada uno puede personalizarlo de la forma que más le convenga. Ajustando el Periodo de Tendencia, podemos optimizarlo para tendencias más larg
FREE
Una versión ampliada del indicador para visualizar los rangos temporales de las principales sesiones bursátiles: Asiática, Europea y Americana. La principal ventaja de este indicador es la construcción automática de un perfil de precios para una sesión de negociación. El indicador tiene la funcionalidad de establecer la hora de inicio y fin de cada sesión de negociación, así como determinar automáticamente la zona horaria del servidor de negociación. Los indicadores incluyen la capacidad de trab
FREE

La VMA es una media móvil exponencial que ajusta su constante de suavizado en función de la volatilidad del mercado. Su sensibilidad crece a medida que aumenta la volatilidad de los datos. Basada en el Oscilador de Momento de Chande, la VMA puede ajustar automáticamente su periodo de suavización a medida que cambian las condiciones del mercado, lo que le ayuda a detectar las inversiones de tendencia y los retrocesos de forma mucho más rápida y fiable en comparación con las medias móviles tradici
FREE

un novedoso indicador del fabricante de terciopelo. Este indicador analiza las diferencias entre medias móviles con periodos de promediación que aumentan exponencialmente para detectar la dirección de una tendencia y la volatilidad dentro de esa tendencia. El histograma muestra la desviación típica y la posición de la línea frente al tiempo indica el valor medio de las diferencias entre cada periodo de promediación posterior.Así pues, la línea indica el grado de expectativa de que se produzca un
FREE

El indicador calcula automáticamente el valor de precio equilibrado. Muestra en qué dirección y por cuánto se desplaza actualmente el valor de precio equilibrado. Funciona en todos los marcos de tiempo, en cualquier par de divisas, metales y criptomonedas. Se puede utilizar cuando se trabaja con opciones binarias. Características distintivas No se redibuja; Configuración simple y rápida; Interpretación clara de las lecturas; Funciona en todos los plazos y en todos los símbolos; Adecuado para ope
FREE

El indicador define las flechas de compra y venta con un alto rendimiento y resultados consistentes. El indicador Trend Reverting PRO es adecuado para el comercio de tendencia o para seguir la tendencia - ¡Pruébelo gratis!.. Sistema de trading profesional y preciso ;
Muestra la situación actual del mercado; Análisis automático de las oportunidades de mercado ; Ayuda a los operadores a ganar más con sus inversiones;
Nunca repinta, recalcula o retropinta las señales; ¡Pruebe cómo funciona descar
FREE

¡Hola!
Soy Tatsuron, un inversor minorista japonés. Gestionamos más de mil millones de yenes en Forex.
Entonces, permítanme presentarles un indicador muy útil que utilizo.
El indicador que es la base del precio de mercado.
ThreeLine ha mejorado la media móvil (SMA) para responder a la configuración numérica de SMA a largo plazo.
Cuanto más repita las operaciones y verificaciones diarias, más creíble será la línea Tres.
Si el ángulo de ThreeLine es hacia arriba, será blanco. Si mira haci
FREE

El indicador marca los puntos del gráfico en los que el indicador ZigZag estándar ha trazado su parte superior o inferior. Con este indicador, puede comprender fácilmente dónde se formó el máximo o el mínimo y dónde se volvió a trazar. El indicador emite una alerta cuando aparece un nuevo punto. Advertencia Parámetro Precio Aplicado - amplía las posibilidades de construcción del indicador. Es posible construir a precios de APERTURA, CIERRE y ALTO/MÍNIMO estándar. Parámetros de entrada ----------
FREE

iRSI en iMA es un indicador que cambia de color en iMA si iRSI cruza el nivel hacia arriba (tendencia alcista) o cruza el nivel hacia abajo (tendencia bajista). Es una herramienta útil para rastrear cuando el iRSI alcista y bajista en iMA.
Puede obtener el código fuente desde aquí.
Parámetros MA_Periods - Periodo para iMA. MA_Method - Método para iMA. RSI_Periods - Periodo para iRSI. RSI_ApliedPrice - Precio utilizado para el iRSI. RSI_LevelsUp - Nivel iRSI para tendencia alcista. RSI_LevelsDN
FREE
Multi-Timeframe EMA Momentum Filter - Versión 1.0 Este indicador está diseñado para ayudar a los operadores a evaluar los cruces de EMA a corto plazo en el contexto de un impulso de mayor marco temporal. Su propósito es reducir el ruido y resaltar las configuraciones que se alinean con la tendencia más amplia del mercado. Cómo funciona: En el gráfico principal, aparecen flechas cuando una EMA rápida cruza una EMA lenta en el marco temporal actual, siempre que el impulso del marco temporal super
FREE
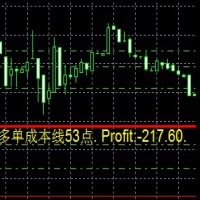
Este es un indicador
Se trata de un indicador que siempre refleja los costes de transacción y la rentabilidad a corto plazo.
Especialmente cuando se basa en la estrategia de Martin, es más preciso. Se trata de un indicador
Es un indicador en tiempo real de los costes de los pedidos y de la rentabilidad en tiempo real.
Se trata de un indicador especialmente útil cuando se trata de la Martin-Strategy. Esto es un indicador
Es un indicador que refleja siempre el coste de la orden y la rentabili
FREE

El indicador Hurricane Cave muestra diferentes áreas de negociación basadas en la acción del precio. Busca en el pasado y elabora patrones que pueden reforzar el soporte y la resistencia como objetivos. Cuando el precio rompe una zona comercial, puede apuntar justo dentro de la siguiente zona comercial. Si usted no puede ver el objetivo sólo tiene que ir a un marco de tiempo más lento, significa que el precio no ha estado allí por mucho tiempo. El Hurricane Cave Indicator está diseñado para ser
FREE

Indicador para sincronizar y posicionar gráficos en uno o varios terminales simultáneamente. Realiza una serie de funciones a menudo necesarias en el análisis de gráficos: 1. Sincronización de gráficos localmente - dentro de un terminal al desplazarse, hacer zoom, cambiar periodos de los gráficos, todos los gráficos lo hacen simultáneamente. 2. Sincronización de gráficos globalmente - lo mismo, pero en dos o más terminales, tanto MT4 como MT5. 3. Posicionamiento del gráfico en un lugar determina
FREE
El indicador Trender detecta un cambio de tendencia. Para no perdérselo, configúrelo para que envíe notificaciones a su terminal móvil (Push), o en forma de Alerta, o por Email. El indicador también proporciona posibles puntos de entrada y calcula y muestra los niveles de stop loss y take profit.
Ventajas: - No se redibuja - Puede ayudar a filtrar señales en su estrategia - Funciona en todos los pares y plazos - Fácil de configurar - Proporciona señales listas para abrir posiciones.
ATENCIÓN E
FREE

El indicador "Comfort Zone Signal " identifica una zona diaria que, cuando se rompe, tiene una alta probabilidad de que el mercado continúe la tendencia establecida.
Tras la señal, el indicador calcula el stop loss y el take profit, que usted puede fijar.
También puede establecer la tendencia. Si el precio está por encima de la MA, sólo busca posiciones largas, si está por debajo, sólo busca posiciones cortas.
Puede elegir ignorar la media móvil y mostrar todas las señales.
Además, se muestra
FREE
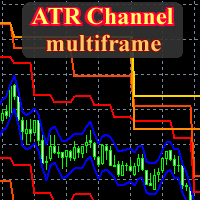
Se trata de una versión totalmente multiplataforma del indicador estándar ATR Channel , que funciona para cualquier combinación de marcos temporales. El indicador permite ver los canales de precios de diferentes marcos temporales en una ventana, y siempre se mostrarán en una escala de tiempo correcta. Puede crear un conjunto de intervalos y cambiar libremente a uno superior o inferior. Tenga en cuenta: en el modo de visualización "Desde el precio medio ", es fácil identificar los puntos de rever

Stat Monitor es un buen indicador de información.
Ventajas del indicador: El indicador proporciona información útil: el spread actual, el coste de un lote del símbolo, el apalancamiento comercial y el tamaño de lote recomendado para operar. Puede utilizar el indicador en la plataforma MetaTrader 4 de cualquier broker. El indicador proporciona información útil.
Versión del indicador Stat Monitor para MetaTrader 5 ¡Les deseo a todos buena suerte en el comercio y ganancias estables!
FREE
MetaTrader Market ofrece a todos los desarrollador de programas de trading una sencilla y cómoda plataforma para ponerlos a la venta.
Le ayudaremos con la presentación y explicaremos cómo preparar la descripción de su producto para el Market. Todos los programas que se venden a través del Market están protegidos por una codificación adicional y pueden ser iniciados sólo en el ordenador del comprador. La copia ilegal es imposible.
Está perdiendo oportunidades comerciales:
- Aplicaciones de trading gratuitas
- 8 000+ señales para copiar
- Noticias económicas para analizar los mercados financieros
Registro
Entrada
Si no tiene cuenta de usuario, regístrese
Para iniciar sesión y usar el sitio web MQL5.com es necesario permitir el uso de Сookies.
Por favor, active este ajuste en su navegador, de lo contrario, no podrá iniciar sesión.