Indicadores técnicos para MetaTrader 4 - 28

Indicador de Flecha (Alertas de Compra/Venta) - ¡Una herramienta simple pero poderosa! Product Version: 1.01 Indicator Type: Trend Reversal Signals Timeframes Supported: All (Recommended: H1, H4, D1) Características principales: Buy Signal: Green upward arrow () appears below the candle Señal de Venta : Flecha roja descendente () aparece por encima de la vela. D etección precisa de reversión de tendencia : basada en la estrategia probada de
FREE

DTFX Algo Zones son retrocesos de Fibonacci autogenerados basados en los cambios de la estructura del mercado.
Estos niveles de retroceso están destinados a ser utilizados como niveles de soporte y resistencia para buscar el rebote del precio para confirmar la dirección.
USO Figura 1 Debido a que los niveles de retroceso sólo se generan a partir de cambios identificados en la estructura del mercado, los retrocesos se limitan a partir de las zonas consideradas más importantes debido a la r

Porque el estilo importa
Sé lo molesto que es hacer clic en las propiedades cada vez para cambiar el color de la vela, el fondo a claro u oscuro, y poner o quitar la rejilla. Aquí está la solución con un solo clic: Tres botones personalizables para elegir el estilo de vela que quieran los comerciantes. Un botón para cambiar entre el modo Día y Noche. Un botón para mostrar u ocultar la rejilla en los gráficos. *****En la configuración, puede elegir dónde se mostrarán los botones en la pantalla
FREE

Características: Encuentra estos patrones engulfing: Engulf simple Golpe de sándwich Golpe de tres líneas Rising Three Estrella de la mañana Doji El escáner es útil para mejorar tu estrategia. No te guíes siempre por el porcentaje de Ganancias/Pérdidas. Porque esta herramienta no se basa en resultados pasados. Configuración Básica: Para todos los patrones se puede establecer: Relación Primera:Última Vela Esto asegurará que la vela opuesta anterior tenga al menos este ratio de altura en comparaci
FREE
FlatBreakoutPro Detector de zonas planas y rupturas multisímbolo para MT4 FlatBreakoutPro es una herramienta profesional para traders modernos, diseñada para detectar y monitorizar automáticamente zonas planas (laterales) y alertarle instantáneamente de rupturas a través de múltiples símbolos y marcos temporales. El indicador emplea una lógica fractal transparente, emite señales precisas sin repintar y garantiza un control visual total de la situación del mercado. ¿Para quién es? Operadores acti

EL INDICADOR CON DOBLE MEDIA MÓVIL (MA).
Recomendaciones : El indicador funciona mejor si dos líneas son del mismo color al mismo tiempo. (si una es verde y la otra roja, el precio está en la zona plana (es mejor no hacer nada)).
Parámetros de entrada :
1. El periodo del primer y segundo MATCH. 2. El grosor de la línea del primer y segundo MATCH. 3. 3. El color de la línea del primer y segundo MATCH.
¿Busca un buen corredor? ¡Entonces tengo una buena oferta para usted! - 4 tipos de cuenta
FREE
Vertical Lines for Hour - Indicador de Trading Basado en el Tiempo El indicador Vertical Lines for Hour te permite insertar hasta 4 líneas verticales repetidamente en momentos específicos. Simplemente ingresa la hora sin considerar los minutos, y también puedes seleccionar el color de forma independiente para cada línea. Este indicador es perfecto para definir rangos de sesiones o implementar estrategias personalizadas rentables. Ofrece una solución simple y directa para tus necesidades de tradi
FREE
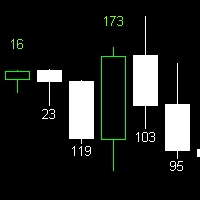
Indicador de Tamaño de Vela Descubre el tamaño de la vela con este indicador fácil de usar. Funciona en todos los marcos de tiempo, proporcionando información valiosa para tu análisis técnico. Características: Muestra el tamaño de la vela después de configurar el indicador. Compatible con todos los marcos de tiempo. El tamaño de la vela es una métrica importante en el análisis técnico, ya que puede indicar la fuerza y volatilidad del mercado. Con este indicador, puedes visualizar de manera clara
FREE

Este indicador está diseñado para scalping en el mercado Forex y el comercio de opciones binarias. Una señal aparece en la apertura de una nueva vela. Recomendaciones de uso: Para Opciones Binarias: Se recomienda abrir operaciones cuando aparece una señal en la primera vela. Una señal de compra aparece cuando la X azul sustituye a la roja, mientras que una señal de venta se produce cuando la X roja sustituye a la azul, como se muestra en las capturas de pantalla. Para el mercado Forex: Realice
FREE

Una estrategia de puntos pivote de Forex podría ser el mejor amigo de un operador en lo que respecta a la identificación de niveles para desarrollar un sesgo, colocar stops e identificar posibles objetivos de beneficios para una operación. Los puntos pivote han sido un recurso para los operadores durante décadas. La base de los puntos pivote es que el precio a menudo se moverá en relación con un límite anterior, y a menos que una fuerza externa haga que el precio lo haga, el precio debe deteners
FREE

AD Trend line traza líneas de tendencia basándose en el indicador A/D (Acumulación/Distribución). Cuando el indicador A/D rompe una línea de tendencia, la probabilidad del cambio de tendencia es muy alta. Se trata de un indicador multitiempo que puede mostrar valores de plazos superiores. Parámetros Time-frame - Seleccione un timeframe; cero es el timeframe actual del gráfico; Línea de tendencia - Muestra líneas en el gráfico; Aplicar a - Aplicar líneas para cerrar el valor más alto/más bajo de
FREE

El indicador de Oferta y Demanda no se repite ya que cuenta el número de pruebas/repeticiones ocurridas en el pasado x número de veces. Como trader usted necesita un camino para poder colocar sus operaciones de compra y venta tales como: Oferta y demanda, Canales descendentes y ascendentes . Los operadores experimentados dibujarán los niveles clave y los canales alrededor de los marcos temporales. Pero, no podrán dibujarlos en los marcos de tiempo pequeños ya que el precio cambia con demasiada
FREE
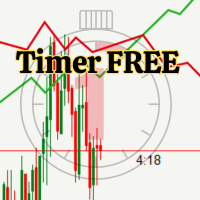
Temporizador de cuenta regresiva para cierre de vela, Tiempo de cuenta regresiva FUNCIONES: - Cuenta regresiva exacta para cierre de vela - Funciona en todos los timeframes (M1 a MN) - 2 formatos de visualización - Color y tamaño de fuente personalizables - Posición ajustable en el gráfico - Actualización en tiempo real cada segundo
Reloj de cuenta regresiva para cierre de vela
IDEAL PARA: - Scalping y day trading - Trading con timing preciso - Practicar gestión de tiempo en operaciones - Todo
FREE

Si te gusta este proyecto, deja una revisión de 5 estrellas. A medida que las instituciones comercializan grandes volúmenes, no es raro que
traten de intentar
defender su posición en niveles porcentuales específicos. Estos niveles servirán como soporte natural y resistencia que usted puede
utilizar
para entrar en un comercio o estar consciente de posibles peligros contra su
posición. Este oscilador le mostrará la variación porcentual para: Día. Semana. Mes. Cuarto. Año. En una subventana dond
FREE

Concepto
El Mercado ordena en el Tiempo las Fases venideras en función de los Resultados actuales de su Interés. Las Modulaciones Directivas son una Interacción de Períodos inmanentes, que se muestran en Referencia a la Actividad cíclica en el Tiempo y a la Actividad de Nivelación de Precios. PuntoCero es una Máscara de Precio proyectiva de este Concepto de Tiempo y Precio y categorizar los Movimientos de Precios desarrollados en relación a su propio Rango: ¿cuánto se han movido? indicando su E
FREE

El indicador Magic SMMA es de gran ayuda para determinar la dirección de la tendencia. Puede ser un excelente complemento para su estrategia actual o la base de una nueva. Los seres humanos podemos tomar mejores decisiones cuando vemos mejor visualmente. Por eso lo hemos diseñado para que muestre un color diferente para las tendencias alcistas y bajistas. Cada uno puede personalizarlo de la forma que más le convenga. Ajustando el Periodo de Tendencia, podemos optimizarlo para tendencias más lar
FREE

Aquí hay varios indicadores que funcionan juntos. Básicamente funciona con medias móviles y varios niveles de ATR creando un canal dinámico a través del cual se drena el precio. Como siempre recomiendo, deberías probarlo antes de usarlo en vivo para que entiendas cómo funciona. La señal de entrada en el mercado es similar a otros indicadores MA, pero con éste también tienes un análisis gráfico del momento en que se encuentra la tendencia y niveles dinámicos para ajustar tu stop loss y take profi
FREE
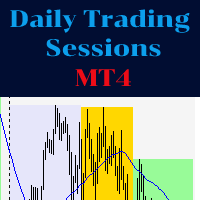
El indicador representa las casillas de las sesiones asiática, europea y americana. Es posible cambiar la hora de cada sesión, como el color. También es posible desactivar la visualización de cada sesión. Encontrará en los parámetros de entrada variables para modificar la hora de las sesiones en formato hh:mm y el color de las casillas de cada sesión. Si necesita alguna implementación por favor póngase en contacto conmigo.
FREE
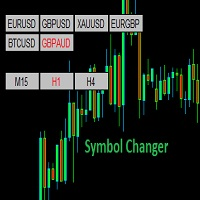
Indicador de cambio de símbolos (personalizado)
Este es un indicador simple pero intuitivo. Y es gratis.
El indicador proporciona una fácil navegación a través de varios símbolos y a través de diferentes marcos de tiempo todo en un gráfico.
Los botones se muestran en el gráfico principal.
Es flexible y fácil de usar con una rápida velocidad de respuesta.
CARACTERÍSTICAS
UniqueID : Identifica los pares de cada gráfico .
Usar pares personalizados : Si está en true, carga todos los símbol
FREE
BreakEven PRO line– Encuentra tu punto de equilibrio visualmente en cada operación ¿Te has preguntado cuál es el precio exacto donde tus operaciones abiertas se equilibran y no hay ganancia ni pérdida?
BreakEven PRO line es un indicador visual diseñado para traders que gestionan múltiples posiciones. Muestra automáticamente una línea horizontal en el gráfico con el precio promedio de breakeven (punto de equilibrio) para tus órdenes BUY y SELL , y lo etiqueta con el valor exacto en tiempo real. I
FREE

El indicador muestra los niveles de la proporción áurea de Fibonaccia y la línea de equilibrio del precio Tiene tres opciones de sensibilidad diferentes Le permite navegar visualmente en qué estado se encuentra el mercado y dónde son posibles los cambios de tendencia Funciona en todos los marcos temporales, en cualquier par de divisas, metales y criptodivisas Puede utilizarse cuando se trabaja con opciones binarias Características distintivas Basado en el valor dorado de Fibonacci; Determina la
FREE

iCC en iMA es un indicador que cambia de color en iMA si iCCI cruza el nivel al alza (tendencia alcista) o cruza el nivel a la baja (tendencia bajista). Es una herramienta útil para rastrear cuando el iCCI alcista y el iCCI bajista en iMA.
Puede obtener el código fuente desde aquí .
Parámetros MA_Periods-Periodo para iMA. MA_Method - Método para iMA. CCI_Periods-Periodo para iCCI. CCI_ApliedPrice - Precio usado para iCCI. CCI_LevelsUp - Nivel iCCI para tendencia alcista. CCI_LevelsDN - Nivel i
FREE

La ventaja del scalper inteligente: la señal de triple filtro ¿Cansado de perseguir señales falsas? El "Smart Scalper's Edge" es su ventaja injusta en el mercado, diseñado para operadores que exigen precisión y confirmación. Este indicador no se basa en un simple cruce, sino que utiliza un potente sistema de triple confirmación para filtrar el ruido y señalar las oportunidades de inversión de alta probabilidad. Obtenga la claridad que necesita para entrar en el mercado con confianza. Ventajas c
FREE
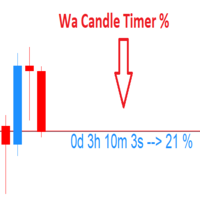
Wa Candle Timer Percentage MT4 es un indicador que muestra al usuario cuánto tiempo queda hasta que se forme la siguiente vela. También se muestra el porcentaje de la evolución de la vela actual. El usuario puede establecer el porcentaje que el temporizador de velas cambiará de color. Estos son los ajustes: 1- El porcentaje en que el temporizador de velas cambiará de color. 2- Color de la vela cuando está POR DEBAJO del porcentaje establecido por el usuario. 3- Color de la vela cuando está POR
FREE

Nermal Round Levels es un indicador de numeros redondos en forma de grilla dibujando lineas horizontales. Puedes usarlo de muchas formas... como lo podria ser de activador para que un asesor experto ingrese al mercado, confirmacion de entrada para tu estrategia, zona de entrada, marcar zonas de niveles importantes, posibles rebotes y otras. Colocalo en tu chart y verifica como el precio respeta esos niveles redondos.
Inputs GridSpace linecolor lineStyle
FREE

Un patrón pin bar consiste en una barra de precios, normalmente una barra de precios en forma de vela, que representa una fuerte inversión y rechazo del precio. La inversión de la pin bar, como se denomina a veces, se define por una larga cola, la cola también se conoce como "sombra" o "mecha". El área entre la apertura y el cierre de la pin bar se denomina "cuerpo real", y las pin bars suelen tener cuerpos reales pequeños en comparación con sus largas colas.
La cola de la pin bar muestra el á
FREE

¿Alguna vez ha querido detectar una tendencia justo cuando empieza? Este indicador trata de encontrar los máximos y mínimos de una tendencia. Utiliza indicadores incorporados y estudia sus patrones de inversión. No se puede utilizar por sí solo, requiere estocástico (14) para confirmar la señal. Rojo para vender, Azul para comprar. No hay parámetros necesarios sólo tiene que adjuntar a un gráfico y está listo para ir. Echa un vistazo a otros grandes productos de https://www.mql5.com/en/users/aug
FREE

Indicador AdvaneZigZag
¿Está cansado de las limitaciones del indicador ZigZag tradicional? Conozca AdvaneZigZag, la herramienta definitiva para simplificar su análisis de la estructura del mercado y mejorar sus estrategias de negociación. Diseñado pensando en la flexibilidad y la precisión, AdvaneZigZag le ofrece funciones avanzadas para navegar por el mercado con confianza.
Características principales:
1. Flexibilidad mejorada:
- Al tiempo que mantiene la simplicidad familiar del indicador
FREE
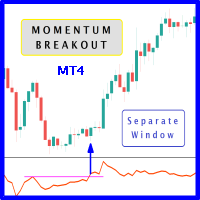
Cuando los niveles de resistencia de ruptura de precios se combinan con el oscilador de impulso que rompe sus niveles de resistencia históricos, entonces surge la probabilidad de registrar precios más lejanos. Se recomienda encarecidamente confirmar la ruptura del precio con la ruptura del oscilador, ya que tienen efectos comparables a la ruptura del precio de los niveles de soporte y resistencia; sin duda, las operaciones cortas tendrán la misma percepción. El concepto se basa en encontrar los
FREE

El indicador BinaryFortune ha sido desarrollado y adaptado específicamente para operar con opciones binarias a corto plazo. El algoritmo del indicador analiza numerosos factores antes de generar una señal. El indicador se instala de la forma convencional. El indicador consta de una ventana de información, que muestra el nombre del instrumento de negociación, los niveles de soporte y resistencia, y la propia señal (COMPRA , VENTA o ESPERA ). La señal va acompañada de un sonido y una alerta emerge
FREE

Compruebe mis herramientas de pago funcionan muy bien y comparto Ea basado en ellos de forma gratuita por favor valore
El indicador Dual Timeframe RSI (Relative Strength Index) es una novedosa herramienta de trading que permite a los traders monitorizar las lecturas del RSI desde dos marcos temporales diferentes en un único gráfico. Esta doble perspectiva permite a los operadores identificar posibles confirmaciones de tendencia y divergencias con mayor eficacia. Por ejemplo, un operador puede u
FREE
Flechas de Entrada de Precisión: ¡No vuelva a perderse una operación de alta probabilidad! Deje de adivinar y empiece a operar con confianza. El indicador Precision Entry Arro ws es una sofisticada herramienta todo en uno diseñada para ofrecer señales de compra y venta de alta calidad y sin repintado directamente en su gráfico. Combina de forma experta el poder del MACD , el Estocástico y una Cruz EMA 5 única para señalar los momentos exactos de entrada , y luego filtra todo a través de una EMA
FREE
INDICADOR DE AGOTAMIENTO DE TENDENCIA %R - GUÍA DEL USUARIO El indicador muestra tres líneas Williams %R (Rápida, Lenta, Media) en el rango de 0 a -100 y genera señales visuales cuando cuando se alcanzan las zonas extremas.
ZONAS DEL INDICADOR Zona de sobrecompra: por encima de -20 Zona media: de -20 a -80 Zona de sobreventa: por debajo de -80 SEÑALES DE NEGOCIACIÓN FLECHA ARRIBA (azul) - SEÑAL PRINCIPAL DE COMPRA Aparece cuando ambas líneas (Rápida y Lenta) salen simultáneamente de la zona de

Indicador CCI altamente configurable. Características: Funciones de alerta altamente personalizables (en niveles, cruces, cambios de dirección vía email, push, sonido, popup) Capacidad multi timeframe Personalización del color (en niveles, cruces, cambios de dirección) Opciones de interpolación lineal y modo de histograma Funciona en el probador de estrategias en modo multi timeframe (también en fin de semana sin ticks) Niveles ajustables Parámetros:
CCI Timeframe: Puede establecer el marco tem
FREE

Este indicador muestra el volumen de cada barra en puntos en forma de histograma. La segunda versión del indicador. Ahora se representa como un oscilador. Es más informativo y funcional. No carga el gráfico principal. GitHub Muestra: volumen de la barra en puntos como un histograma (buffer 0) valor medio del volumen para todo el periodo (buffer 1) barras superiores al valor medio del cliente con otro color (buffer 2) valor medio de la cantidad de barras establecidas por un usuario (buffer 3) Ade
FREE

Después de 7 años, he decidido liberar algunos de mis indicadores y Asesores Expertos (EA) de forma gratuita.
Si los encuentras útiles, por favor ¡Muestra tu apoyo con una valoración de 5 estrellas! Tu feedback me motiva a seguir proporcionando herramientas gratuitas. Explora mis otras herramientas gratuitas aquí .
_________________________________ Indicador "RSI con Bandas" – Mejores Decisiones de Trading El Indicador "RSI con Bandas" combina el RSI clásico con bandas simples par
FREE

Porque el estilo importa
Sé lo molesto que es hacer clic en las propiedades cada vez para cambiar el color de la vela, el fondo a claro u oscuro, y poner o quitar la rejilla. Aquí está la solución con un solo clic:
Tres botones personalizables para elegir el estilo de vela que quieran los comerciantes. Un botón para cambiar entre el modo Día y Noche. Un botón para mostrar u ocultar la rejilla en los gráficos. *****En la configuración, puede elegir dónde se mostrarán los botones en la pantall
FREE

¿Cuántas veces ha necesitado trazar los niveles clave de una vela cerrada del marco temporal anterior? Con PastProjection puede tener trazados los niveles de Apertura, Cierre, Máximo y Mínimo de la vela cerrada en el marco temporal superior elegido. Los niveles son a menudo importantes y se convierten en soporte o resistencia, o ambos. La primera vez que se alcanzan a menudo hacen que la cotización reaccione. Los patrones en estos niveles suelen ser más eficaces. Estos niveles son importantes co
FREE

Este indicador es una herramienta útil para visualizar los componentes cíclicos del precio. Calcula la transformada discreta de Fourier (DFT) de un segmento de datos del gráfico de precios seleccionado por el usuario y muestra los ciclos, el espectro y la señal sintetizada en una ventana independiente. Muestra los ciclos, el espectro y la señal sintetizada en una ventana independiente. El indicador se ha concebido únicamente como una herramienta de aprendizaje, ya que no es adecuado para propor
FREE

Este sencillo indicador creativo proporcionará un marco preciso para el sentimiento del mercado dentro del análisis técnico de diferentes marcos temporales. Por ejemplo, para los traders como yo que utilizamos la estrategia "Mark Fisher" regularmente, este es un indicador perfecto para tener una visión de los mercados desde el punto de vista de corto plazo a largo plazo, utilizando los puntos de ruptura de los mínimos y máximos de las velas y perfecto para combinar con "Price Action" . Para más
FREE

Indicador de línea de apertura de 4H - Descripción general de la configuración Este indicador personalizado se utiliza para dibujar y visualizar el precio de apertura , la línea media y los rangos alto/bajo de las velas de 4 horas en marcos temporales más pequeños. Es particularmente útil para los operadores intradía que quieren ver los niveles de marcos de tiempo más altos. Entradas y descripciones del indicador Parámetro Valor Descripción OpenLineColor Blanco Color de la línea que indica
FREE

¡Desbloquee un trading más inteligente con Triple Candle Trend! Deje de perseguir señales y empiece a operar con confianza y confluencia . El indicador Triple Candle Trend es su sistema todo-en-uno diseñado para cortar el ruido del mercado y ofrecer puntos de entrada de alta probabilidad. No nos basamos en un único factor; ¡combinamos el poder de tres herramientas de confirmación en una señal clara! Por qué necesita este indicador: Filtre el ruido, encuentre la tendencia: Este sistema utiliza l
FREE
IntradaySignals Intraday Signals es un sistema de trading semiautomático, visual y efectivo, que: genera posibles puntos de entrada para abrir operaciones de COMPRA y VENTA; muestra los Take Profit y Stop Loss recomendados; muestra el beneficio actual de la operación abierta; muestra el spread actual. La rentabilidad del indicador se muestra en la captura de pantalla en el ejemplo del par GBPUSD No redibuja y funciona en la barra de apertura. Marcos de tiempo - M1-H1. TimeFrame recomendado-M5-M1
FREE

El comportamiento de los diferentes pares de divisas está interconectado. El indicador Visual Correlation le permite mostrar diferentes instrumentos en 1 gráfico mientras mantiene la escala. Puede definir correlación positiva, negativa o sin correlación.
Algunos instrumentos comienzan a moverse antes que otros. Dichos momentos se pueden determinar superponiendo gráficos.
Para mostrar un instrumento en un gráfico, ingrese su nombre en el campo Symbol . Version for MT5 https://www.mql5.com/es/
FREE
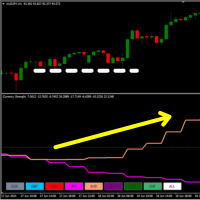
28 mercados en un solo indicador Tiene 8 Líneas y cada una representa una divisa { EUR - USD - GBP - JPY - AUD - NZD - CAD - CHF } .
¿Qué hace? Calcula un oscilador personalizado en los 28 Pares de Divisas y le muestra la Fuerza de cada divisa. De esta manera puedes analizar la Tendencia y la Volatilidad en un Par Multidivisa. También haciendo clic en dos monedas diferentes cambia instantáneamente el mercado.
¿Cómo usarlo? Puede utilizar este indicador para encontrar verdaderas contracciones
FREE

El indicador Magic SMA es de gran ayuda para determinar la dirección de la tendencia. Puede ser un excelente complemento para su estrategia actual o la base de una nueva. Los seres humanos podemos tomar mejores decisiones cuando vemos mejor visualmente. Por eso lo hemos diseñado para que muestre un color diferente para las tendencias alcistas y bajistas. Cada uno puede personalizarlo de la forma que más le convenga. Ajustando el Periodo de Tendencia, podemos optimizarlo para tendencias más larg
FREE

Este es un indicador de medias móviles múltiples muy simple.
Puede mostrar 12 medias móviles. El eje temporal de las medias móviles se puede cambiar en el campo de entrada del indicador. El proceso es más rápido que las 12 medias móviles incluidas con MT4.
También tenemos un búfer configurado para que pueda acceder a él desde un Asesor Experto. *Para usuarios avanzados.
Si tiene alguna pregunta o solicitud, por favor envíeme un mensaje.
Gracias. MT5 Versión: https: //www.mql5.com/en/market/
FREE

El indicador Point-Percent Price Channel (PPPC o PP Price Channel) está diseñado para mostrar en el gráfico un canal cuya anchura se especifica tanto en porcentaje del precio actual como en puntos. Su aspecto se presenta en la diapositiva 1. Cuando el mercado se mueve al alza, el límite superior del canal se construye en el precio de las velas altas. En este caso, el límite inferior sigue al superior a una distancia estrictamente especificada. Cuando el precio toca el borde inferior del canal, e
FREE

Esta poderosa herramienta le ayuda a acceder fácilmente a las herramientas de Fibonacci en diferentes momentos y en diferentes mercados. Esta herramienta tiene la capacidad de enviar señales basadas en Fibonacci, así como establecer alarmas para estar al tanto de los niveles de Fibonacci rotos. Entre las capacidades de esta herramienta se encuentran las siguientes:
Identifica las tendencias del mercado Diseño automático de Fibonacci Si se rompen los niveles de Fibonacci, envía un mensaje Envía
FREE
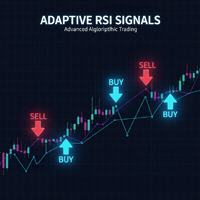
Desarrollado por el Equipo Quant de SVX Strategies Esta es la implementación completa de la estrategia de "Reglas de Negociación Autoadaptativas". Combina la estructura del mercado con la inteligencia del RSI Adaptativo para generar señales de alta probabilidad. ¿Quiere esta estrategia totalmente automatizada?
La ejecución manual requiere tiempo frente a la pantalla. Si prefiere que nuestro equipo gestione la operativa por usted, copie nuestros algoritmos oficiales: Copiar "Friday Pulse" (Conse
FREE

Introducción al indicador GARCH GARCH es la abreviatura de Generalized Autoregressive Conditional Heteroskedasticity (heteroscedasticidad condicional autorregresiva generalizada) y es el modelo de predicción de la volatilidad más utilizado en el sector financiero. El modelo GARCH apareció por primera vez en la obra del economista danés Tim Peter Bollerslev en 1986. El ganador del Premio Nobel 2003, Robert F. Engle, también contribuyó en gran medida al perfeccionamiento del modelo GARCH con el tr
FREE
El propósito de esta nueva versión del indicador estándar de MT4 proporcionado en su plataforma es mostrar en una sub-ventana múltiples marcos temporales del mismo indicador. Vea el ejemplo que se muestra en la imagen de abajo. Pero la visualización no es como un simple indicador MTF. Esta es la visualización real del indicador en su marco de tiempo. Aquí están las opciones disponibles en el indicador FFx: Seleccione los marcos de tiempo a mostrar (M1 a Mensual) Definir el ancho (número de barra
FREE

Acerca del multímetro Waddah (gratuito):
Este producto se basa en el indicador WAExplosion. Ayuda a identificar tendencias explosivas del mercado y oportunidades potenciales de trading. Echa un vistazo al post detallado del producto aquí para el escáner y el multímetro ambos: https://www.mql5.com/en/blogs/post/758020
Tenga en cuenta que el escáner es de pago y el multímetro es gratuito.
Características: Waddah Dirección de la Tendencia Fuerza de la tendencia (por encima/por debajo de la línea
FREE

Introducción y Descripción
El indicador muestra una flecha cada vez que se detecta una " envolvente bajista ". Este último suele indicar el inicio de una tendencia bajista. Un patrón envolvente bajista es un patrón gráfico técnico que indica que se avecinan precios más bajos. El patrón consiste en una vela alcista seguida de una gran vela bajista que eclipsa o "engulle" a la vela alcista más pequeña. El patrón puede ser importante porque muestra que los vendedores han superado a los compradores
FREE
El indicador Candle GAP es una herramienta esencial para los comerciantes que utilizan estrategias de negociación de brechas , ya que identifica automáticamente las brechas de velas para cada día de la semana. Una brecha se refiere a una diferencia de nivel de precios entre el cierre y la apertura de dos días consecutivos. Este indicador reconoce cuatro tipos de patrones de brecha: común, ruptura, continuación y agotamiento. Al incorporar este indicador en cualquier gráfico, los operador
FREE

Indicador de patrón de triángulo simétrico - Dominar el reconocimiento de tendencias en MetaTrader Libere el poder del reconocimiento de tendencias con el indicador "Symmetrical Triangle Pattern" para MetaTrader. Esta innovadora herramienta simplifica la identificación de patrones de triángulos simétricos, proporcionando a los operadores señales claras de una posible continuación o inversión de la tendencia. Eleve sus estrategias de trading con esta oferta de MQL. Características principales : R
FREE

Formas Gráficas - utilizando la historia, proyecta cuatro tipos de formas gráficas en el momento, permitiéndole determinar los principales rangos de movimiento de precios en el futuro, así como le da una comprensión de los principales retrocesos del mercado, mientras que da puntos de entrada por prioridad¡ El panel contiene tres tipos de tamaños de figuras expresadas por marcos de tiempo. Le permiten realizar un análisis completo del mercado sin necesidad de utilizar herramientas adicionales. El
FREE

RSI Color y Notificación Ajustes Usos :: 1. Establecer valor de Sobreventa y Sobrecompra 2. Establecer periodo RSI 3. Establecer Color 4. Notificar a la alerta, correo electrónico y móvil.
Para Trading :: Forex y Opciones Binarias 1. Cuando se produce la alarma de color en el área OVB, haga la preparación. Para introducir una orden de Venta 2. Cuando la alarma de color se produce en el área OVS, hacer la preparación. Para introducir una orden de Compra 3. Cuando el RSI está entre OVB y OVS, con
FREE

La versión gratuita del indicador Hi Low Last Day MT4 . El indicador Hi Low Levels Last Day MT4 muestra los máximos y mínimos del último día de negociación . Se puede cambiar el color de las líneas . Pruebe la versión completa del indicador Hi Low Last Day MT4 , en que características adicionales indicador están disponibles : Visualización del mínimo y máximo del segundo último día Visualización del mínimo y del máximo de la semana anterior Alerta sonora al cruzar los niveles máx . y mín . Selec
FREE

Índice del Canal de Materias Primas y Media Móvil [CCI MA] Una combinación de CCI y MA para crear una configuración de negociación cruzada Parámetros de entrada: signal mode: ajústelo a true si desea conectarlo a STAT (Signal Tester and Trader) desplazamiento de la flecha: distancia entre la línea rápida de la EMA y la flecha del gráfico filtro de línea de precio Periodo CCI Método de precio CCI Periodo de media móvil Método de media móvil nivel superior Nivel inferior Usted puede encontrar la m
FREE

FusionAlert StochRSI Master es un indicador disponible para las plataformas MT4/MT5, es una combinación del indicador RSI & Estocástico que proporciona "alertas" cuando el mercado está dentro de las regiones de "sobrecompra y sobreventa" combinadas para ambos indicadores, resulta en señales más precisas y exactas para ser usadas como una herramienta maravillosa, en forma de señales de "compra o venta". Este indicador viene con muchas opciones de personalización mencionadas en la sección de parám
FREE
Este indicador crea un canal en relación con otro indicador gráfico: indicador + ATR e indicador - ATR . Útil para saber si el precio ha subido demasiado lejos de su línea de base. Los niveles de ATR se pueden ajustar con un multiplicador. Esta versión tiene más complejidad que su contraparte de MT5 para evitar algunas de las limitaciones de MT4: debe introducir el nombre de su línea de base, los parámetros (en una cadena separada por comas) y el búfer . Asegúrese de que su líne
FREE

El indicador Channel Builder (CB) o Ivanov Bands es una amplia generalización del indicador Bollinger Bands . En primer lugar, en CB, la línea media <X> se calcula utilizando varios algoritmos de promediación. En segundo lugar, las desviaciones medias calculadas mediante el promedio de Kolmogorov se trazan a ambos lados de la línea media <X>. La línea media <X>, además de los algoritmos de promediación estándar SMA, EMA, SMMA y LWMA, puede ser Mediana = (Max + Min) / 2 mediana deslizante (que e
FREE

El Sexteto es un indicador MT4 que muestra 6 niveles de Medias Móviles, donde el segundo es la media móvil del primero, el tercero del segundo, y así sucesivamente. Da una señal cuando todos los niveles de medias móviles se alinean en orden. Obtenga un Sexteto EA gratis, y lea las discusiones sobre el uso del Indicador Sexteto en Forex Factory:
El Sexteto EA @ Forex Factory Echa un vistazo a The Sextet Scalper Pro para una estrategia de scalping más elaborada también con EA gratuito . Caracterís
FREE

El indicador está especialmente diseñado para la utilidad de trading Trade Shell (incluido Trade Shell SMC ) para que funcione en el probador visual de estrategias.
Pruebe sus ideas de trading e indicadores. Ejecute Trade Shell en el probador visual y luego coloque este indicador en el gráfico. ¡Después de que usted será capaz de controlar todas las funciones de la Shell de Comercio, así como con el uso en vivo! ¡No funciona en vivo! Utilícelo sólo con el probador visual. No requiere ningún aju
FREE

The Red Dragons Support and Resistance Levels indicator automatically determines support and resistance levels using the proprietary algorithm based on historical and current data, so the levels are dynamic, which allows you to adjust trading targets based on the current price movement. For this reason, we use this indicator in our advisors, for example, Red Dragons, which you can purchase here:
https://www.mql5.com/en/market/product/128713?source=Site +Market+MT4+New+Rating006
The panel also
FREE
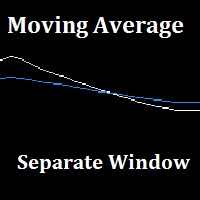
"Separate Moving Average" es un indicador personalizado hecho a partir de la combinación de 2 medias móviles en una ventana diferente (la ventana del indicador) con el objetivo de eliminar el desorden del gráfico de precios, el indicador también tiene flechas para mostrar el cruce de medias móviles ya sea largo o corto. Todos los parámetros de la media móvil son personalizables desde la ventana de entrada del indicador.
FREE
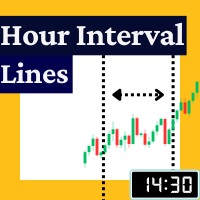
El indicador Rayol Code Hour Interval Lines fue diseñado para ayudar a su experiencia de trading. Dibuja el rango de horas elegido por el usuario directamente en el gráfico, de modo que permite a los traders visualizar los movimientos de precios durante sus horas de trading preferidas, proporcionando a los traders una visión más completa de los movimientos de precios y la dinámica del mercado. Este indicador permite al usuario elegir no sólo la hora del broker, sino también la hora local. De est
FREE

Este indicador integra la estrategia de la Banda de Bollinger en el cálculo con un cálculo de volumen-sobre-MA
para acotar aún más los niveles de "Áreas de Interés" para una potencial zona de re-test a la derecha del gráfico.
Añadimos un cálculo de Media Móvil para una nube multinivel y desglosamos aún más las condiciones para destacar tanto
cruce de flujo de volumen en la MA Alta y Alta Extrema y también picos de volumen alto y alto extremo en la media de período establecido
sin condiciones de
FREE

StarBody es un indicador de histograma que representa el tamaño de las velas en relación con su volumen y destaca las que son mayores que las anteriores. La fórmula para calcular la altura del histograma es tan sencilla como eficaz: Amplitud * Volumen El gráfico mostrará todas las velas que sean mayores que las anteriores en función de la configuración elegida.
El indicador puede ser útil, a veces indispensable, en estrategias que impliquen la explotación de la continuación de la tendencia. Hay
FREE
Compruebe lo fácil y sencillo que es comprar un robot en la MetaTrader AppStore, la tienda de aplicaciones para la plataforma MetaTrader.
El Sistema de pago MQL5.community permite efectuar pagos con ayuda de PayPal, tarjeta bancaria y los sistemas de pago más populares. Además, le recomendamos encarecidamente testar el robot comercial antes de la compra, para así hacerse una idea más completa sobre él.
Está perdiendo oportunidades comerciales:
- Aplicaciones de trading gratuitas
- 8 000+ señales para copiar
- Noticias económicas para analizar los mercados financieros
Registro
Entrada
Si no tiene cuenta de usuario, regístrese
Para iniciar sesión y usar el sitio web MQL5.com es necesario permitir el uso de Сookies.
Por favor, active este ajuste en su navegador, de lo contrario, no podrá iniciar sesión.