Indicadores técnicos para MetaTrader 4 - 119

Este indicador ayuda a identificar las sesiones del mercado, es Alto/Bajo, Rango Abierto (OR), rango de las sesiones en pips y porcentaje del día anterior (cambio%) bajo OHLC.
También es editable para cualquier tiempo de observación del mercado de corretaje. Para los traders que utilizan estrategias de trading de sesión como Mark B. Fisher ACD puede ser super efectivo, donde pueden editar OR desde los ajustes a línea o caja. Hemos tratado de hacer la configuración más fácil de editar, para el us
DESCRIPCIÓN:
Account Information Panel v1.1 es un indicador MT4 (MetaTrader 4), y es una excelente herramienta para rastrear y analizar sus inversiones mensualmente bajo la visión de un inversor para ayudar a los inversores/traders a entender su inversión/trading rápidamente sin pasar horas haciendo cálculos manuales. CARACTERÍSTICAS:
Mostrar información básica Saldo Patrimonio Margen Margen libre Nivel de margen Apalancamiento Swap (largo/corto) Velocidad DD actual (reducción) Posiciones activa
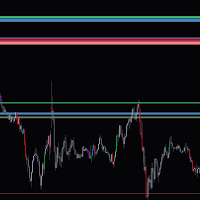
Este indicador muestra zonas basadas en velas diarias en el gráfico, Asegúrese de tener suficientes barras diarias en el gráfico antes de cargar el indicador en el gráfico, Estas zonas pueden actuar como zonas de oferta y demanda. Las zonas no están sujetas a repintado. Si tiene menos zonas o no tiene zonas para los premios actuales con las entradas predeterminadas, intente aumentar gradualmente la entrada de los días anteriores y los valores de los tamaños de las zonas. Si tiene más zonas de la
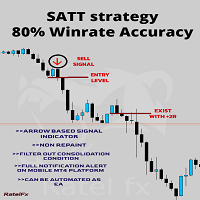
Estrategia SAT (Técnica de negociación de enfoque sistemático)
This is a revolutionary new way of trading the financial market.
Este es el mejor sistema de indicadores que proporciona las señales de trading más precisas tanto para entradas como para salidas.
El algoritmo de este indicador de sistema proporciona la señal más exacta y precisa sólo durante la fase altamente impulsiva del mercado.
Este indicador de sistema funciona bien durante un período de alto volumen, que es sólo las tres p

Gracias por interesarse en mi indicador. He desarrollado esta herramienta durante un par de años, haciendo números, estudiando y probando diferentes lógicas, finalmente lo tenía programado en 2020 y ahora Estoy orgulloso de lanzar el indicador "RastaWay" a un número limitado de traders serios (copias limitadas disponibles). El sistema emplea una lógica única para intentar decodificar la mecánica del mercado y traducirla a un lenguaje visual que cualquier trader pueda entender y utilizar. El bor
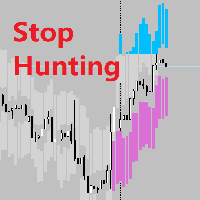
Detener la caza en tiempo real En segundo plano ¿Qué es el Stop Hunting? Me remito a la definición de Stop Hunting de Investopedia, Stop hunting es una estrategia que intenta forzar a algunos participantes del mercado a salir de sus posiciones llevando el precio de un activo a un nivel en el que muchos individuos han decidido establecer órdenes de stop-loss. La activación de muchos stop loss a la vez suele crear una gran volatilidad y puede presentar una oportunidad única para los inversores que

El Histograma Qv² - Indicador desarrollado para operadores con experiencia avanzada. Este indicador tiene dos propósitos 1-) Identificar patrones de normalidad de precios (color verde) 2-) Identificar patrones de precios anormales "outliers" (color rojo) = ======= ============================================================================================================================== Interpretación para operaciones en tendencia inicial: Histograma (color verde) cruzando la línea cero al alz
Moderno indicador de patrones PPR de la estrategia de trading RAIT. Funciona en tendencia y sin ella. Tiene ajustes de marco de tiempo para la visualización. Puede establecer el número de barras para mostrar el indicador en el gráfico. Se utilizan varios patrones PPR. El indicador se utiliza preferentemente en el marco de tiempo de una hora y por encima, pero funciona por debajo . Patrones: PPR, PinPPR, OutPPR. Se muestra con una sola flecha.

Un indicador de oferta y demanda diseñado con una estrategia de negociación minimalista basada en la naturaleza del mercado. La zona alcista es una zona de fuerte soporte, y la zona bajista es una zona de fuerte resistencia. Cuando una zona alcista se rompe, se convierte en la "base" de la zona bajista y viceversa. Cuando el precio se encuentra con estas zonas, hay una alta probabilidad de que el precio se dé la vuelta, por lo que las llamamos Obstáculos. Es un indicador adecuado para los opera

Indicador de objetivos de compra y venta Consta de tres líneas: el primer color verde identifica los objetivos de compra, el segundo color rojo identifica los objetivos de venta y el tercer color azul es el precio promedio. Hay dos formas de entrar: Método 1: punto de entrada cuando el precio promedio se rompe con una vela larga desde abajo y mantenerse por encima de la línea azul con una vela verde se considera compra Cuando el precio promedio atraviesa el techo con una

Los Conceptos del Contenido Central de ICT se convirtieron en el indicador más todas las herramientas anteriores conocidas del Indicador Inteligente de Posición. Esto lo convierte en la Versión Privada Completa del PSI (leer más ) restringida hasta ahora pero disponible sólo después de que el Contenido Principal de la Mentoría se hiciera público en YouTube . Usted encontrará muchas herramientas de estudio de la acción del precio como: Rango de Negociación del Banco Central - CBDR Rango Asiático

Las barras de precio medio (APB) son velas de tipo Heikin-Ashi modificadas. Heikin-Ashi es un término japonés traducido como "Barra Promedio"; por lo tanto, el nombre, Barras de Precio Promedio. Las Barras de Precio Promedio proporcionan una mejor representación del mercado actual mediante la eliminación o reducción de las fluctuaciones en la acción del precio nominal a menudo referido como "choppiness" de la acción del precio actual Alto, Bajo y Cierre.

Hola. Entre el rango de tiempo dado. Añade el beneficio y el lote. Se puede escribir en la carta en inglés y húngaro. El nombre del símbolo debe ser introducido exactamente. Bien utilizado para ello. :)
¡Szia! A meg adott idősáv között Összeadja a profitot és lot-ot. No se olvide de visitar nuestro sitio web en inglés y magiar. Pontosan kell beírni a szimbólum nevét. Jó használatott hozzá. :)
La mejor solución para cualquier novato o experto.
Forex Support Resistance es una herramienta de trading única, de alta calidad y asequible porque hemos incorporado una serie de características propias. Calcula el máximo más alto y el mínimo más bajo de las X barras anteriores con la posibilidad de seleccionar el marco de tiempo deseado. También muestra los valores del máximo más alto y el mínimo más bajo de la barra anterior como un comentario en el gráfico principal. Imagínese cómo mejorará

El indicador ZigZagSpeed mide el ritmo de formación de zig y zag en el tiempo calculado por el conocido indicador zig zag. El sistema de cálculo se calcula simplemente dividiendo la diferencia en pips por el número de barras transcurridas en el marco temporal seleccionado. Las medidas de velocidad que se produjeron en el período pasado también se mostrarán en el gráfico junto con la fecha en que se produjeron. Los números de velocidad están situados encima o debajo de cada formación de zigzag e
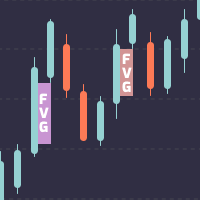
Indicador de brecha de valor razonable para MetaTrader 4.
Una brecha de valor razonable es un patrón de acción del precio de tres velas enseñado por el famoso comerciante de dinero inteligente, el comerciante del círculo interior, también conocido como ICT. Básicamente, es una brecha que queda abierta en el gráfico cuando el precio se mueve demasiado rápido. Es un área del cuerpo de la vela del medio que no recibe marcas superpuestas por la vela izquierda y la vela derecha al lado. Cuando el p
Indicador de scalping 2 en 1. Comprando este indicador, ¡te llevas de regalo un robot automático! Sistema automático de búsqueda de puntos de inversión de precios. El indicador con puntos en el gráfico de un par de divisas muestra los posibles puntos de reversión del movimiento de precios. Un punto rojo indica una inversión del movimiento hacia abajo y un punto azul indica una inversión en el movimiento del precio hacia arriba. El indicador es excelente para el comercio intradía utilizando una

Indicador fácil de usar que le ayudará a colocar sus órdenes pendientes y de mercado con gran precisión. El indicador traza los bloques de órdenes basándose en cómo reacciona el precio a la estructura actual del mercado. Estos niveles clave representan zonas de oferta y demanda, y el indicador Smart Blocks Trading System utiliza el precio para evaluar si un activo se está acumulando o distribuyendo. Puede utilizarse en cualquier instrumento financiero y en cualquier marco temporal.
BoS son las
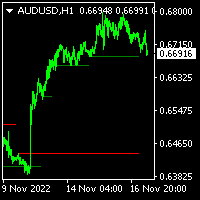
Este indicador pretende ayudar a los operadores a ver el rango diario de hoy comparado con el rango diario medio. Puede cambiar el número de días para el rango diario promedio, de lo contrario puede utilizar 20 como valor predeterminado. El % de alcance le dará información sobre el progreso del rango de hoy hacia el rango promedio diario. Los operadores de Breakout, o los operadores de pullback normalmente mirarán el área base, en la cual podrían querer saber el rango promedio diario como compar

Este indicador se ha desarrollado sobre la base de la negociación en varias sesiones para ayudar en el análisis a todos los operadores diarios. El indicador soporta todos los pares de divisas, así como otros instrumentos de negociación como índices, materias primas, metales, etc. La forma en que el indicador funciona es haciendo el análisis en su nombre. Durante la sesión asiática es cuando el indicador hace los cálculos y proporciona planes de negociación en forma de áreas en el gráfico para el

Este indicador calcula fácilmente la relación recompensa/riesgo e indica el nivel de stop out y el límite de take profit con recuadros gráficos. También muestra los pasos de recompensa con los niveles de fibonacci sin cambiar los niveles por defecto de fibonacci, esto es muy útil para las personas que utilizan el retroceso de fibonacci. Interfaz muy amigable y fácil de usar con botones gráficos.

** Todos los símbolos x Todos los marcos de tiempo escanear con sólo pulsar el botón del escáner ** *** Contacta conmigo para enviarte instrucciones y añadirte en "Order Block group" para compartir o ver experiencias con otros usuarios. Introducción: Los bancos centrales y las instituciones financieras impulsan principalmente el mercado, el bloqueo de órdenes se considera un comportamiento del mercado que indica acumulación de órdenes de bancos e instituciones, entonces el mercado tiende a hacer
Un indicador sencillo y preciso para identificar posibles zonas de oferta y demanda para inversiones de precios. Fue descrito por primera vez en el libro de Jason Pearl, "Demark Indicators", publicado en 2008. Se puede utilizar como soporte y resistencia, y se puede negociar como un Breakout o como un Fakeout, dependiendo de su estilo de negociación, y dependiendo de cómo se cerró la vela en las proximidades de TDST.

Un Gap ocurre cuando el precio se mueve con "fuerza" en una direccion dada (arriba o abajo). El Gap se forma cuando, cuando se ven tres candelas consecutivas, la cola de la primera y tercera candela no se interceptan. Cuando esto ocurre, el indicador crea un rectangulo donde el Gap se encuentra. Identifica una zona donde el precio tiene el potencial de regresar (mitigación). El Gap o rectantugo es mitigado cuando el precio vuelve y cubre completamente el rectangulo. Note que tambien el indicado
** Todos los Símbolos x Todos los Plazos escanean con sólo pulsar el botón del escáner ** *** Ponte en contacto conmigo para enviarte las instrucciones y añadirte al "grupo Channel Scanner" para compartir o ver experiencias con otros usuarios. Introducción: El patrón de Canal se describe como el área localizada entre dos líneas de tendencia. Esta zona se utiliza para medir un rango de negociación. En este caso, la línea de tendencia superior conecta los máximos del precio mientras que la línea d

Barra de señales Emini
Precio - Promoción: $100 - Precio Normal: $200
Símbolo Recomendado - Índice S&P 500 / US500
Marco temporal - 5 minutos Información del Buffer - Buffer de compra = 2 - Buffer de venta = 3 Características principales - Muestra la barra de señal de compra y la barra de señal de venta en el gráfico en vivo. - Obtener Alerta de la barra de señal. - La precisión de la Alerta es superior a la de los puntos. (La alerta está activa en ese momento) - Los puntos serán recalculado
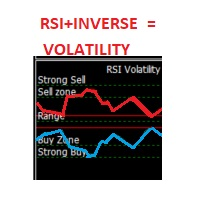
Este indicador es un oscilador que muestra el RSI (Relative Strength Index) en rojo y su gráfico inverso en verde claro. Juntos muestran la volatilidad del mercado (en su configuración por defecto). También puede cambiar para mostrar sólo el gráfico del RSI. También le ofrece la posibilidad de cambiar su periodo. de cambiar su Periodo. Las zonas de los osciladores (80,70,50,30,20) están marcadas por Venta Fuerte, Zona de Venta, Rango, Zona de Compra y Compra Fuerte respectivamente.
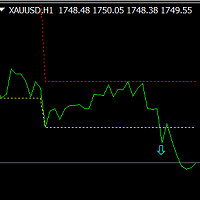
Este es un indicador MT4 basado en estadísticas de fluctuación, que incluye principalmente dos partes: una es mostrar el área de fluctuación, y la otra es mostrar la señal al mismo tiempo si hay una señal generada.
Su principio fundamental es realizar estadísticas de datos basadas en el radio de fluctuación del valor extremo especificado, y dibujar el área de fluctuación. Si se muestra el área de fluctuación, se mostrará la señal en la misma dirección. Ventaja :
Adecuado para todas las razas.

Gracias a este indicador, podrá analizar la operativa de todos sus asesores desde una sola cuenta. No tiene que tener un terminal separado para cada Asesor Experto para evaluar su trabajo específicamente.
El indicador es capaz de analizar el historial de la cuenta por números mágicos y usted podrá ver qué configuración con el número mágico asignado dio qué resultados. Por otra parte, usted será capaz de analizar las transacciones de compra y venta por separado, este es un momento subestimado p
KFX Dashboard monitorea la Acción del Precio usando la Dirección de la Vela + la Media Móvil en Múltiples pares de divisas (seleccionables por usted) y en Múltiples Marcos de Tiempo (seleccionables por usted). El panel también revela la fuerza de los pares de divisas en función de su selección de medias móviles.
CARACTERÍSTICAS
- Acción del Precio: Dirección de Velas + Medias Móviles (3x mostradas en el gráfico). - Múltiples símbolos y múltiples marcos temporales. - Análisis de fortaleza de d
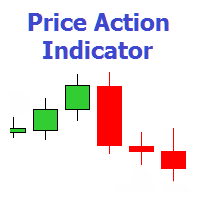
El indicador muestra 7 patrones del sistema de negociación Price Action, así como las líneas de precio máximo y mínimo del día. Plazos: H1, H4, D1. Barra Barra vertical exterior (OVB) Inversión de punto pivote (PPR) Reversión del precio de cierre (CPR) Dobles extremos (DMax/DMin ) Barra de rango amplio (WRB) Barra interior (IB) Ajustes PATRONES DE ACCIÓN DEL PRECIO Mostrar Pin Bar Color Pin Bar - color de la flecha del puntero. Mostrar Barra Vertical Exterior (OVB) Color Outside Vertical Bar -

Volume Champion es un indicador que analiza el volumen del mercado y muestra los datos en forma de histograma. No es necesario profundizar en la teoría del análisis de mercado. Simplemente puede seguir las lecturas del indicador. Las barras indicadoras muestran la dirección potencial del movimiento de precios según el análisis de la estructura del volumen del mercado. Este indicador está diseñado para usarse en marcos de tiempo más altos, como H4, D1, W1. ¡SEÑALES NO RENDER! Técnicamente, el ind

Trend TD es un indicador de tendencia. Gracias al algoritmo de este indicador, la señal nunca irá en contra de la tendencia. Gracias a las dos líneas que forman un canal estrecho, el algoritmo de análisis de los puntos de entrada, el algoritmo controla los momentos de inversión en el momento en que la línea superior del canal se ha invertido y es posible dibujar visualmente una línea que cruza la línea superior consigo misma en el pasado, mientras que cruza la línea inferior en un punto. Si se
Apollo Volume Profile es un indicador que determina la dirección del movimiento del mercado mediante el análisis de volumen. El indicador es muy fácil de usar. Este indicador muestra claramente la proporción de vendedores y compradores en el mercado, según el marco de tiempo utilizado. El indicador se puede utilizar como base para cualquier sistema comercial. El indicador no vuelve a dibujar sus señales. Este indicador se puede utilizar para operar con cualquier instrumento financiero, como divi

El indicador se basa en un Zig Zag no estándar, dibuja acumulaciones después de lo cual si el precio sale de esta zona y se produce una prueba de esta zona, entonces se da una señal de sonido y aparece una flecha - después de que la vela de prueba se cierra.el indicador no redibuja sus señales, es muy fácil de usar, sólo hay tres ajustes 1- este es el parámetro de zig zag 2- este es el precio mínimo de salida de la zona 3- este es el precio máximo de salida de la zona. Cuanto menor sea el paráme
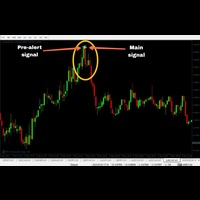
Zoro PRO' es un indicador MT4 basado en una estrategia de inversión con un sistema de pre-alerta avanzado. Es un indicador 100% no repintado con una precisión media de alrededor del 70-95% en cualquier tipo de mercado. (EXCEPTO MAL MERCADO Y TIEMPO DE NOTICIAS)
Versión MT5: https: //www.mql5.com/en/market/product/90934 (Versión MT5 no recomendada)
Broker recomendado: Alpari, Amarkets, tickmill. Pares recomendados para M1:
EURUSD
AUDJPY
GBPUSD
EURJPY
NZDJPY
CADJPY
EURGBP
USDCAD
GBPCHF
GBPC
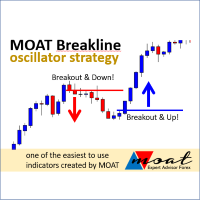
El indicador proporcionará una línea de ruptura o guía de parada de precios, recomendamos M5 o H1 marcos de tiempo. Señal de operación: Señal de compra: si el precio de cierre (según el marco temporal) rompe la línea azul y ya está por encima de ella o si el precio más bajo se detiene por encima de la línea roja. Señal de venta : si el precio de cierre (según el marco temporal) rompe la línea roja y ya está por debajo de ella o si el precio más alto se detiene por debajo de la línea azul. Func
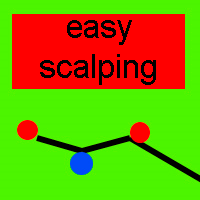
Nepsetms45 es un indicador de especulación de divisas que muestra al operador los puntos de reversión del precio y la dirección de la tendencia actual. La precisión de las señales indicadoras es en promedio del 87%. Esto sugiere que si el indicador dibuja una flecha en el gráfico, entonces, con una probabilidad del 87 %, el precio irá en la dirección de la flecha en al menos 20 puntos o más en el futuro cercano. El indicador también muestra la dirección de la tendencia y la fuerza del movimient

Este indicador contiene Niveles Pivote de: Tradicional Fibonacci Woodie Clásico Demark Camarilla Los periodos de cálculo se pueden establecer en automático / Diario / Semanal / Mensual / Anual. Número de niveles editable. Opciones para ocultar etiquetas de nivel y etiquetas de precio. Los Puntos Pivote son niveles de precios que los chartistas pueden utilizar para determinar los niveles de soporte y resistencia intradía. Los Puntos Pivote utilizan la Apertura, el Máximo y el Mínimo del día anter

¿Busca un indicador que identifique patrones de acción de precios de alta probabilidad? ¿Le gustan las operaciones contra tendencia? El indicador Kangaroo Tailz podría ser justo para usted. Este indicador está pensado para ser utilizado como detector de retrocesos. Yo personalmente prefiero entrar en una posición al principio de una tendencia en lugar de coger el último par de movimientos. Este indicador hace un buen trabajo de alertar cuando el precio puede revertir mediante la identificación d

Analizar múltiples marcos de tiempo de un par de divisas en una ventana puede confundirlo.
Para analizar múltiples marcos de tiempo, necesita indicadores confiables.
Uno de ellos está utilizando 9TF STOCH RSI.
He estado trabajando día y noche para crear un código que sea simple pero confiable y cubra los nueve marcos de tiempo en un solo indicador.
Veamos algunas de las ventajas de este indicador:
Histograma colorido. El color de la curva en cada período de tiempo es diferente entre sí. Fl

Indicador de Punto de Pivote (Poivt)
Fórmula de cálculo del indicador ClassicMode:
pp=(High+Low+Close)/3.0
s1=2*pp-Alto
s2=pp-(Alto-Bajo)
s3=Bajo-2*(Alto-pp)
r1=2*pp-Bajo
r2=pp+(Alto-Bajo)
r3=Alto+2*(pp-Bajo)
Fórmula de cálculo del indicador Woodie Mode (WoodieMode):
pp=(Alto+Bajo+2*Cierre)/4.0
s1=2*pp-Alto
s2=pp-(Alto-Bajo)
s3=Bajo-2*(Alto-pp)
r1=2*pp-Bajo
r2=pp+(Alto-Bajo)
r3=Alto+2*(pp-Bajo)
Fórmula de cálculo del indicador FibonacciMode( FibonacciMode ):
pp=(Alto+Bajo+Cierre)/3.0
s1=p
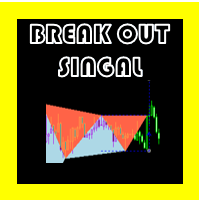
BREAK OUT SIGNAL OSW (METATRADER 4) Quieres trabajar rotura de altos y bajos? este es el indicador perfecto para tomar señales de este tipo de entradas. Tan pronto inicia le indicador no te mostrará ninguna señal, pero a medida que va avanzando el precio, ira leyendo el mercado hasta encontrar el patrón perfecto para tomar los Break Out. El indicador para leer los altos y bajos tiene una configuración especial para el Zig Zag, el cual permite tomar únicamente los mas adecuados. Como todo indicad
El indicador Three MA Buy and Sell Signals PRO para Metatrader 4 es el sistema comercial de 3 MA que ofrece señales de compra y venta cada vez que la tendencia gira en la dirección opuesta.
Este indicador del sistema consta de 3 medias móviles utilizando 3 períodos diferentes.
El indicador proporciona las señales comerciales reales de compra y venta en forma de flechas.
Después de descargar e instalar el indicador en la plataforma de negociación MT4, debería verse como la imagen que se muest

El indicador 3rd Candle Forex Scalper para MT4 es un verdadero indicador de scalping que funciona muy bien para cualquier marco de tiempo y par.
Puntos clave: Una flecha azul representa una oportunidad comercial de compra. Una flecha roja representa una oportunidad comercial de venta. El indicador es muy confiable, liviano y no ralentizará su plataforma de negociación.
¿Cómo comerciar con él? Abra una posición de compra cada vez que aparezca la flecha de escalador de color azul en el gráfico.

El indicador Obie Scalper para Metatrader 4 es un indicador de especulación de Forex fácil de usar que ofrece ganancias rápidas en los marcos de tiempo más bajos.
El indicador analiza el gráfico en busca de oportunidades de especulación rápida que pueden surgir durante las distintas sesiones de negociación.
Los mejores resultados se lograron durante las sesiones de negociación más volátiles (Londres y Estados Unidos).
Naturalmente, el indicador Obie Scalper funciona en cualquier marco de tie
DepthTrendView es un indicador que se utiliza para ver la dirección del mercado muy claramente en comparación con los indicadores que son comúnmente utilizados por muchas personas.
Lo interesante de este indicador es que se puede ver la dirección de la tendencia y también saber que el mercado está al final o que el mercado quiere empezar una nueva tendencia.
Como usarlo: 1- Para ver la dirección de COMPRA más temprana necesita ver la vela anterior por debajo de la Línea Aqua antes de que apar

MA Revolution es una versión mejorada de la Media Móvil estándar. Con la actualización actual, la línea de media móvil es más sensible a las diferentes condiciones del mercado. Se hace más flexible disminuyendo el periodo por defecto paso a paso mientras el mercado está agudo e incrementando el periodo de vuelta al periodo por defecto paso a paso mientras el mercado está normal de nuevo. La prueba de la idea muestra que esta versión mejorada da mucha más precisión para detectar la dirección del
Coloque el indicador en el gráfico, preferiblemente con un marco temporal de H1 o H4. Si opera en el rango diario o, por el contrario, en marcos temporales inferiores, deberá ajustar los niveles de RSI y ATR en consecuencia.
Las flechas azules del indicador serán una señal para abrir una posición larga, las flechas rojas serán una señal para abrir una posición corta:
1) Flecha azul para largos (crecimiento) y flecha roja para cortos (descenso).
2) Dos líneas horizontales para las posiciones
Este indicador es muy útil para aquellos que operan con técnicas de inversor. Por eso lo he llamado InvestorTool. ¿Por qué inversores? ¿No es una herramienta para el trading? Este indicador es básicamente para ayudar a los inversores a identificar qué pares están muy cerca de su All-Time-Low o All-Time-High. De este modo, el inversor detectará rápidamente qué instrumentos están "relativamente" a su bajo coste, e indicando el capital mínimo necesario.
Si el par está cerca de su mínimo históri

NOTA: EL PRECIO SUBIRÁ MUY PRONTO. ¡NO SE SALTE ESTA OFERTA! Estimados traders Me complace presentarles el indicador "Market Swing Scanner Board ". Este indicador fue creado principalmente para ser utilizado en combinación con el indicador Market Swing Index. El indicador "Market Swing Scanner Board " se utiliza para buscar oportunidades de negociación en el indicador Market Swing Index . Esta herramienta está diseñada para operadores serios que han decidido marcar la diferencia a través del tra
El indicador Market Structure MTF es un intento exitoso de formalizar la estructura del movimiento del precio de acuerdo con un algoritmo único. Establece inequívocamente cualquier movimiento de precios en los elementos constituyentes y le permite no perderse ningún punto de entrada o salida interesante. Una característica importante del indicador Market structure MTF es la visualización de la estructura del movimiento del precio a la vez en dos Marcos de tiempo: en el actual y en cualquier sup

Analizar varios marcos temporales de un par de divisas en una misma ventana puede confundirle. Para analizar múltiples marcos de tiempo, necesita indicadores fiables. One of them is using 9TF RSI MA . He estado trabajando día y noche para crear un código que es simple pero fiable y cubre los nueve marcos de tiempo en un solo indicador . Veamos algunas de las ventajas de este indicador: Histograma colorido. El color de la curva en cada marco temporal es diferente. Flechas que indican el cruce de

KT Trend Exhaustion es nuestra implementación personal del famoso Trend Exhaustion Index desarrollado por Clifford L. Creel, Ph.D., en 1991.
El cambio en la dirección de los precios suele ir acompañado de incertidumbre. TEI ayuda a abordar la incertidumbre mostrando una dirección nítida utilizando el índice de cambio de color suavizado.
Características
Fácil de usar e interpretar. Viene con un escáner multi-marco de tiempo que escanea las próximas señales a través de todos los marcos de tiemp
KT Know Sure thing es un oscilador de impulso basado en la tasa de cambio suavizada a lo largo de cuatro escalas temporales diferentes y fue desarrollado por Martin Pring. En 1992, Pring publicó la descripción inicial del indicador en el artículo "Summed Rate of Change (KST)" de la revista Stocks & Commodities. El KST crea un oscilador de impulso combinando las medidas de impulso de precios de cuatro ciclos de precios diferentes. Los operadores pueden utilizar el KST para buscar divergencias alc

KT Forex Line puede describirse como una versión mejorada del indicador de media móvil. El indicador está incrustado en el gráfico principal de operaciones y presenta una línea que cambia entre azul y blanco en función de la dirección predominante o el estado de ánimo del mercado.
Utilizar el indicador es sencillo. No necesita entender gráficos complejos ni líneas intrincadas. Reconozca el color de la línea del indicador y opere en consecuencia.
Características principales
El indicador tiene
El KT Market Speed es una herramienta de análisis técnico única y sencilla basada en un oscilador que ayuda a los operadores a visualizar la velocidad a la que cambia el precio de un instrumento en función de la longitud preestablecida. La representación de la Velocidad de Mercado ayuda a trazar correctamente el impulso del precio: ¿se mueve rápido, se ralentiza o está atrapado en un rango? Estas son las preguntas a las que responde el indicador, dando a los operadores más ancho de banda para e

KT Forex Super Scalper se ha creado para identificar las tendencias del mercado y trazar señales comerciales basadas en la dirección de la tendencia predeterminada. Funciona de manera muy similar a las medias móviles, pero reacciona rápidamente a los cambios en las acciones de los precios y puede dar señales de inmediato una vez que se confirma una tendencia válida. Esta característica de reacción rápida lo convierte en una herramienta valiosa para los especuladores. Sin embargo, cualquier pers

El patrón de doble fondo superior es sin duda uno de los patrones gráficos más populares del análisis técnico. Estos patrones se utilizan para capitalizar patrones recurrentes e identificar patrones de cambio de tendencia, creando así niveles de entrada y salida bien situados. El KT Double Top Bottom se basa en estos patrones y afina el proceso de desarrollo de señales comerciales para los operadores.
Características
Se basa en uno de los patrones de trading más fiables y aporta algo de ajuste

DÉJENOS UN COMENTARIO DE 5 ESTRELLAS Manual del usuario de LDS Scalper+ INDICADOR LDS CSDIF adicional + Vídeos de formación ACERCA DE LA ESTRATEGIA DEL INDICADOR LDS SCALPER Construido en más de 15 años de experiencia comercial . LDS Scalper es un indicador de comercio muy potente para la estrategia de scalping, devuelve muy alta tasa de precisión en forex, futuros, criptomonedas, acciones e índices. Este indicador muestra señales de flecha basadas en la información de la acción del precio con a
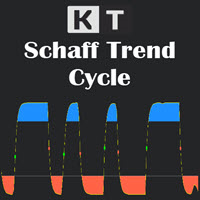
El Ciclo de Tendencia de Schaff (STC) es una herramienta de análisis técnico que ayuda a los operadores e inversores a trazar predicciones altamente probables sobre la dirección del precio de un instrumento. Debido a sus propiedades predictivas, es una buena herramienta para los operadores de divisas (forex) para trazar señales de compra y venta. El Schaff Trend Cycle fue desarrollado por el destacado operador y analista de divisas Doug Schaff en 1999. La idea que impulsa el STC es la narrativa
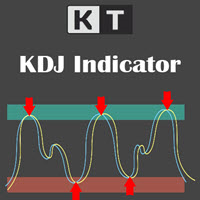
Las herramientas básicas de análisis técnico utilizan señales durante los cambios del mercado proporcionando información crítica que puede influir en las decisiones de inversión y negociación. Se han desarrollado varias herramientas de análisis técnico con este fin, y uno de los indicadores más populares que utilizan los operadores es el índice aleatorio KDJ. Conocido como Random Index, es principalmente un indicador de seguimiento de tendencias que ayuda a los operadores a identificar tendenci
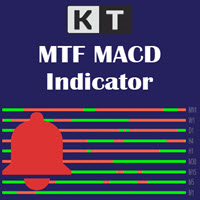
Como trader, supervisar varios marcos de tiempo simultáneamente te ayuda a comprender mejor la tendencia y a identificar cuándo hay concordancia o discrepancia entre los distintos marcos temporales. KT Multiple Time Frame (MTF) MACD muestra la dirección general de un instrumento en un solo gráfico al representar el MACD (convergencia/divergencia de medias móviles) de todos los marcos de tiempo. El indicador muestra una tabla simple con la tendencia del MACD para cada marco temporal. También pued

Todo sobre la estrategia Smart Money Concepts: Estrutura de mercado: interno o swing BOS, CHoCH; Orderblock; Liquidez igual; Gap de Valor Justo con la consiguiente invasión, Rango de precios equilibrado; Nivel con el mes anterior, semana, nivel del día o en el nivel del día (PMH, PWH, PDH, HOD); BuySell Stops Liquidez (BSL, SSL); Liquidez vacío Mechas largas; Prima y Descuento; Patrón de velas ... "Smart Money Concepts" ( SMC ) es un término bastante nuevo pero ampliamente utilizado entre los op
Mejore su precisión en el trading con el Ultimate Confluence Signal Indicator MT4, un potente conjunto de múltiples indicadores que sincroniza señales de más de una docena de herramientas técnicas probadas para configuraciones de alta probabilidad en forex, CFD, criptomonedas y commodities. Inspirado en los principios fundamentales del trading de confluencia —pioneros en los años 90 por expertos como Alexander Elder en su sistema "Triple Screen"— este indicador ha ganado popularidad rápidamente

¡¡ADVERTENCIA!! ¡ESTA ESPADA ESTÁ DEMASIADO AFILADA! SÓLO QUEDAN 10 COPIAS PARA EL PRÓXIMO PRECIO SERÁ DE 8.000 $ PARA EL PLAN ILIMITADO. Estimados comerciantes estoy muy contento una vez más de presentarles mi otra herramienta llamada "Forex Sword Indicator". En resumen, esta herramienta está destinada a darle una ventaja sobre el mercado que usted ha estado esperando durante tanto tiempo. Ahora, aquí está. Es una herramienta muy, muy simple, pero sin embargo, una espada peligrosa. Yo lo llamo
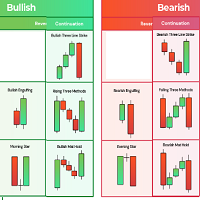
indicador simple basado en el reconocimiento de algunos patrones de velas flechas aparecen en las velas cuando la señal de oso / señal de toro basado en el reconocimiento de patrones de velas dos estrategias disponibles se puede activar / desactivar indicador puede trabajar en cualquier gráfico y marco de tiempo prefiero trabajar en marcos de tiempo altos, especialmente los gráficos diarios D1 flechas rojas aparecen por encima de la vela mostrando una señal bajista después de la vela completada
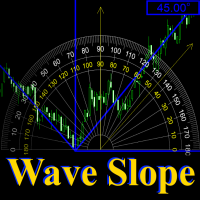
Pendiente de la onda - funciona sobre la base del indicador ZigZag y está diseñado para medir la pendiente de la onda actual, en grados.
Cuanto más agudo es el ángulo de inclinación, más fuerte es la tendencia. Y sobre esta base se puede construir un sistema de comercio.
En la configuración, puede conectar el indicador ZigZag, establecer el color y el ancho de la línea de pendiente.
Y también puede activar y desactivar la señal de sonido, que se activa en caso de un cambio en la pendiente de

¿Qué es la curva de Coppock? La curva de Coppock es un indicador del impulso de los precios a largo plazo que se utiliza principalmente para reconocer las principales caídas y subidas de un índice bursátil. Se calcula como una media móvil ponderada de 10 periodos de la suma de la tasa de variación de 14 periodos y la tasa de variación de 11 periodos del índice. También se conoce como "Guía de Coppock".
Ejemplo de utilización de la curva de Coppock Aplique la Curva de Coppock a un gráfico de pre

Hercules es un indicador de tendencia que es una herramienta muy poderosa para entrar en la posición en el momento adecuado. también indica las áreas rangebound muy fácilmente. Su representación visual es la misma que supertrend. Pero es más avanzado que supertendencia. Si se combina la señal de entrada de múltiples marcos de tiempo que daría 98% de precisión en la mayoría de los símbolos. Características adicionales Notificación Alertas Correo electrónico Flecha para señales de compra y venta B
MetaTrader Market - robots comerciales e indicadores técnicos para los trádres, disponibles directamente en el terminal.
El sistema de pago MQL5.community ha sido desarrollado para los Servicios de la plataforma MetaTrader y está disponible automáticamente para todos los usuarios registrados en el sitio web MQL5.com. Puede depositar y retirar el dinero a través de WebMoney, PayPal y tarjetas bancarias.
Está perdiendo oportunidades comerciales:
- Aplicaciones de trading gratuitas
- 8 000+ señales para copiar
- Noticias económicas para analizar los mercados financieros
Registro
Entrada
Si no tiene cuenta de usuario, regístrese
Para iniciar sesión y usar el sitio web MQL5.com es necesario permitir el uso de Сookies.
Por favor, active este ajuste en su navegador, de lo contrario, no podrá iniciar sesión.