Indicadores técnicos para MetaTrader 4 - 20

El indicador muestra los niveles de sobrecompra y sobreventa, calculándolos mediante la fórmula de la proporción áurea de Fibonacci.
Permite tanto seguir la tendencia como operar a contracorriente, teniendo en cuenta las rupturas y los rebotes desde estos niveles.
Opera en todos los marcos temporales, en varios pares de divisas, metales y criptomonedas.
Adecuado para el comercio de opciones binarias.
Características principales: Basado en la proporción áurea de Fibonacci Muestra los niveles
FREE

El indicador Chart High Low es un indicador para META TRADER 4, con la función de analizar y mostrar los niveles MÁXIMO semanal, MÍNIMO semanal, MÁXIMO mensual y MÍNIMO mensual.
Esto puede ayudar mucho al crear TrendLine o incluso trazar su línea FIBONNACI, ya que no es necesario acceder a sitios de Internet para analizar los niveles MÁXIMO/MÍNIMO.
Hay funciones de "marca" en el indicador, que pueden marcar áreas con un rectángulo, haciéndolas aún más visibles en el gráfico. Esto es opcional
FREE
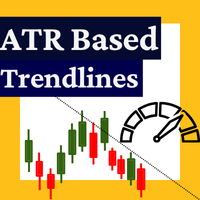
Este indicador es la versión convertida para MetaTrader 4 del indicador "ATR Based Trendlines - JD" de TradingView, creado por Duyck. El indicador funciona dibujando automática y continuamente líneas de tendencia que no se basan exclusivamente en el precio, sino también en la volatilidad percibida por el ATR. Por lo tanto, el ángulo de las líneas de tendencia está determinado por (un porcentaje de) el ATR. El ángulo de las líneas de tendencia sigue el cambio en el precio, dictado por el ATR en e
FREE

Detecte automáticamente bloques de órdenes alcistas o bajistas para optimizar la entrada de sus operaciones con nuestro potente indicador. Ideal para operadores que siguen a ICT (The Inner Circle Trader). Funciona con cualquier tipo de activo, incluyendo criptomonedas, acciones y divisas. Muestra bloques de órdenes en múltiples marcos temporales, desde M2 hasta W1. Le avisa cuando se detecta o migra un bloque de órdenes, o cuando se crea/migra un bloque de órdenes en un marco temporal superior.
Indicador de acumulación y distribución (AD) altamente configurable. Características: Funciones de alerta altamente personalizables (en niveles, cruces, cambios de dirección vía email, push, sonido, popup). Capacidad de múltiples marcos temporales Personalización del color (en niveles, cruces, cambios de dirección) Opciones de interpolación lineal y modo de histograma Funciona en el probador de estrategias en modo multi timeframe (también en fin de semana sin ticks) Niveles ajustables Parámetros
FREE
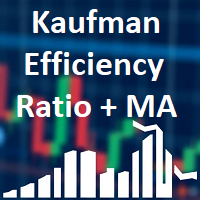
Muestra el valor del Ratio de Eficiencia de Kaufman y suavizado por MA. El cálculo se basa en el movimiento dividido por la volatilidad en un periodo especificado. Los niveles son ajustables así como la visualización. Parámetros: KERPeriod - periodo para el cálculo del ratio. EMAPeriod - período para el promedio móvil. Shift - desplazamiento del indicador. HigherLevel - valor bajo de la zona superior. LowerLevel - valor alto de la zona inferior. ShowHigherZone - permite dibujar la zona superior.
FREE

El indicador BinaryFortune ha sido desarrollado y adaptado específicamente para operar con opciones binarias a corto plazo. El algoritmo del indicador analiza numerosos factores antes de generar una señal. El indicador se instala de la forma convencional. El indicador consta de una ventana de información, que muestra el nombre del instrumento de negociación, los niveles de soporte y resistencia, y la propia señal (COMPRA , VENTA o ESPERA ). La señal va acompañada de un sonido y una alerta emerge
FREE

www tradepositive .lat
ALGO Smart Flow Structure Indicator El estándar institucional para la estructura de mercado. Diseñado para traders serios de SMC y Acción del Precio , este indicador elimina el ruido de los fractales convencionales. Olvídate de las señales repintadas y la ambigüedad; obtén una visión cristalina de la estructura real, validada por reglas algorítmicas estrictas. El Panel de Sesgo (Dashboard) Toma decisiones informadas monitoreando 3 variables críticas en 8 temporalid
FREE

ICT Bala de Plata
Si está buscando un indicador fiable para operar con el concepto ICT Silver Bullet, o conceptos ICT, Smart Money Concepts, o SMC, ¡este indicador responderá a su necesidad! Este indicador le ayudará a identificar lo siguiente FVG - brechas de valor razonable Estructura del mercado: BOS y CHOCH. Se basa en el ZIGZAG ya que es la forma más subjetiva de hacerlo. Ventanas ICT Silver Bullet y notificaciones relacionadas cuando se inicia y cuando aparece un FVG Swing High y low que

Una estrategia de puntos pivote de Forex podría ser el mejor amigo de un operador en lo que respecta a la identificación de niveles para desarrollar un sesgo, colocar stops e identificar posibles objetivos de beneficios para una operación. Los puntos pivote han sido un recurso para los operadores durante décadas. La base de los puntos pivote es que el precio a menudo se moverá en relación con un límite anterior, y a menos que una fuerza externa haga que el precio lo haga, el precio debe deteners
FREE
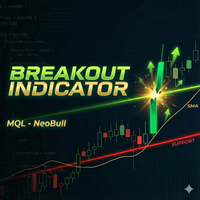
Indicador NeoBull Breakout - Trading Profesional de Rupturas Fácil El Indicador NeoBull Breakout es un potente indicador técnico para MetaTrader 4 , diseñado específicamente para traders de rupturas. Combina niveles probados de Máximo Más Alto/Mínimo Más Bajo con el filtro de tendencia SMA 200 para identificar configuraciones de ruptura de alta probabilidad. Funciones Principales: Línea de Máximo Más Alto Escalonado (20) - Muestra el máximo más alto de los últimos 20 períodos como una línea hor
FREE
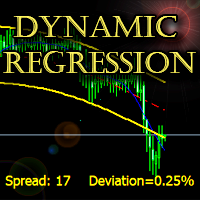
El indicador construye un canal de regresión dinámico de gran precisión sin desfase.
La desviación del canal se calcula mediante una fórmula exclusiva y se muestra en el gráfico.
Soporte: https: //www.mql5.com/en/channels/TrendHunter
Puede utilizarse en cualquier marco temporal y en cualquier instrumento. MT5-version: https://www.mql5.com/en/market/product/64257 Puede ser utilizado como un sistema de comercio ya hecho, así como una adición a la ya existente.
Ajustes: Periodo rápido - Perio
Dominio de las señales: su ventaja en el mercado ¿Cansado de indicadores retrasados y oportunidades perdidas? Conozca Signal Mastery (Sistema EMA20-MACD) -el potente indicador sin repintado diseñado para ofrecer señales de trading de alta probabilidad justo cuando las necesita. Esto no es sólo otra herramienta MACD o EMA. Es un sistema de calidad profesional que combina de forma inteligente la EMA 20 y la lógica del MACD Crossover para señalar los puntos óptimos de entrada y salida. Lo mejor de
FREE

Libere su potencial de negociación con la Cruz Fractal Dorada ¿Está cansado de cuestionar sus operaciones? ¿Desearía tener un sistema claro y fiable para guiar sus decisiones? Le presentamos la Cruz Fractal Dorada , un indicador potente y fácil de usar diseñado para ayudarle a detectar oportunidades de inversión de alta probabilidad. No se trata de otro indicador de medias, sino de una estrategia completa que combina la precisión de los patrones fractales con el poder dinámico de las medias móvi
FREE

El indicador "Ayer Máximo Mínimo" para la plataforma de negociación MetaTrader 4 (MT4) es una potente herramienta diseñada para ayudar a los operadores a identificar los niveles de precios clave del día de negociación anterior. Este indicador proporciona una representación visual de los precios máximos, los precios mínimos, las medias de precios máximos y mínimos y los niveles medios intermedios en el gráfico.
Utilizado principalmente por operadores institucionales y profesionales, este indica
FREE

El indicador busca zonas de compra y venta, donde se puede abrir una operación con un stop loss mínimo y una mejor Relación Riesgo-Rentabilidad. El indicador se basa en la búsqueda cualitativa del patrón Doble techo/Doble suelo. Esta versión sólo funciona con USDCAD. La versión completa del indicador se puede comprar aquí - https://www.mql5.com/en/market/product/29820
Principio de funcionamiento del indicador Busca tops/bajos locales que potencialmente pueden convertirse en una zona de Reversió
FREE

La Media Móvil de Hull (HMA), desarrollada por Alan Hull en 2005, es una de las medias más rápidas, con menor retardo y fácil de usar para identificar tendencias tanto a corto como a largo plazo. Este indicador se basa en la fórmula exacta de la media móvil de Hull con 3 fases de cálculo: Cálculo de la Media Móvil Ponderada (WMA_01) con periodo n/2 & (WMA_02) con periodo n Calcular RAW-HMA: RAW-HMA = 2 * WMA_01(n/2) - WMA_02(n)
Media móvil ponderada con periodo sqrt(n) de RAW HMA HMA = WMA (RAW
FREE

La cinta MA no es un indicador único, sino más bien una superposición de múltiples medias móviles (normalmente de cuatro a ocho o más) de diferentes longitudes trazadas en el mismo gráfico de precios. Aspecto visual: Las líneas resultantes crean un patrón fluido en forma de cinta en el gráfico de precios. Componentes: Los operadores pueden utilizar diferentes tipos de medias móviles, como las medias móviles simples (SMA) o las medias móviles exponenciales (EMA), y ajustar los periodos de tiem
FREE

Este indicador se basa en la experiencia práctica.
Introduce la fecha/hora de tu top/bottom.
Calcula el nivel más visitado desde el top/bottom hasta el momento actual.
Se actualiza automáticamente con cada nueva vela. Puede utilizar simultáneamente varios indicadores para diferentes tendencias y plazos.
La duración se traza siempre desde el inicio del periodo hasta el momento actual.
Útil herramienta PRO.
FREE

Filtro Range - BreakOut EA
¿Qué es el filtro Range? El Filtro de Rango es una herramienta innovadora diseñada para suavizar el ruido del mercado y resaltar los movimientos significativos de los precios. En lugar de centrarse en cada pequeña fluctuación, el Filtro de Rango elimina la actividad insignificante, permitiendo a los operadores ver las tendencias con mayor claridad. La idea procede del filtro de volatilidad del QQE, pero en lugar de aplicarlo al RSI, este enfoque se aplica directamente
FREE
Lista de características 1:
FVG->iFVG Bloque de órdenes Línea de transacciones altas (estrategia personal) Descuento Premium 50% y 61 Máximo mínimo del día anterior Máximo mínimo de la semana anterior Cuenta atrás de fin de vela Lista de funciones 2 : (Implementada en base a los comentarios de los grupos de la comunidad) identificación de tendencias Ocultar FVG, bloque de órdenes, línea de grandes transacciones por debajo del 50% de equilibrio. Ocultar todos/textos/características individuales F

EL ÚNICO INDICADOR DE FORTALEZA DE DIVISAS BASADO EN LA ACCIÓN DEL PRECIO. DISEÑADO PARA OPERADORES DE TENDENCIA, IMPULSO E INVERSIÓN
Este indicador lee la acción del precio para confirmar la tendencia y la fuerza . Indicador avanzado multidivisa y multihorario que le muestra, simplemente mirando un gráfico, cada par de divisas que está en tendencia y las divisas más fuertes y más débiles que impulsan esas tendencias.
Para más detalles sobre cómo utilizar este indicador, y también cómo obtener

TickFlow es una herramienta de análisis de datos de ticks y de resaltado visual de zonas significativas en el gráfico. La utilidad agrega los ticks actuales e históricos, muestra el balance de compra/venta y ayuda a identificar los niveles de soporte/resistencia y las zonas de cluster. Esta es la versión para MetaTrader 5. Cómo funciona (breve) TickFlow recoge datos de ticks y los agrega por pasos de precios y velas. Basándose en los datos recogidos, el indicador construye capas visuales: conta

Introducción a la media móvil fractal El indicador Media Móvil Fractal fue diseñado como parte de Fractal Pattern Scanner. Dentro de Fractal Pattern Scanner, el Indicador de Media Móvil Fractal fue implementado como múltiples objetos gráficos. Con más de miles de objetos gráficos, encontramos que no era la mejor y eficiente manera de operar el indicador. Era demasiado pesado computacionalmente para el indicador. Por lo tanto, decidimos implementar la versión del indicador de la Media Móvil Frac
FREE

¿Estás cansado de perder tiempo tratando de averiguar el valor total de tus líneas TP y SL en los gráficos de Metatrader? No busques más, porque tenemos la solución para ti. Te presentamos nuestro indicador gratuito de MT4 que te permite realizar un seguimiento fácil del total de SL y TP de tus posiciones en cualquier esquina de tu pantalla. Con parámetros X-Y personalizables y opciones de color, puedes personalizar tu pantalla para adaptarla a tu estilo de trading. Di adiós a la molestia y conf
FREE
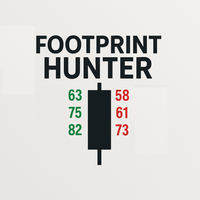
Footprint Hunter – Tu radar de esfuerzo vs. resultado en MT4 Tape Hunter es el indicador definitivo para traders que quieren ver el verdadero juego detrás de los precios en MetaTrader 4. Muestra clara e intuitivamente el volumen agresivo de compra y venta basado en el POC (Point of Control), dándote la capacidad de visualizar el esfuerzo del mercado y el resultado real en cada vela. ️ ¿Por qué es importante?
¡No todo el volumen mueve el precio! Footprint Hunter destaca si el esfuerzo (vo

[La desviación de cada indicador MT4] es una colección de 18 indicadores, y uno de ellos puede seleccionarse arbitrariamente para participar en el cálculo. Puede calcular la forma de desviación de cada indicador y puede provocar una alarma.
Descripción del ajuste de parámetros:
[indicadores] es elegir uno de los 18 indicadores para participar en el cálculo (este parámetro es muy importante) .
[período] es un ciclo común para cada indicador.
[Método] es el modo MA de algunos indicadores.
[A
FREE

está diseñado para mejorar la representación visual de los gráficos financieros en MetaTrader 4 mediante la alteración dinámica de los colores de varios elementos gráficos, incluyendo velas, barras, gráficos de líneas y barras de volumen. Su objetivo principal es mejorar la intuición del operador y el compromiso durante el análisis del mercado mediante la introducción de transiciones de color suaves y cíclicos que pueden poner de relieve los cambios de impulso, las tendencias o la volatilidad s
FREE

El precio promedio ponderado por volumen (VWAP) es un punto de referencia comercial utilizado por los operadores que proporciona el precio promedio al que se ha negociado un valor a lo largo del día, según el volumen y el precio. El VWAP se calcula sumando los dólares negociados para cada transacción (precio multiplicado por el número de acciones negociadas) y luego dividiendo por el total de acciones negociadas. Puedes ver más de mis publicaciones aquí: https://www.mql5.com/en/users/joaquinmet
FREE

Muchos operadores de Forex asumen que no hay volumen en el mercado de divisas. Y estarían en lo cierto. No existe una bolsa central, al menos de momento. E incluso si la hubiera, ¿de qué informaría? Sin embargo, lo que hay es actividad, y ésta se registra como volumen de ticks. Al fin y al cabo, el volumen no es más que la actividad, los compradores y vendedores del mercado. La plataforma MT4 proporciona datos de ticks que el indicador Quantum Tick Volumes muestra de una forma más elegante y úti

El indicador ATR Arrows MTF se basa en el Average True Range (ATR). Proporciona señales de entrada en forma de flechas. Todas las señales se generan en la barra actual. Las señales no se redibujan. Todas las señales en el modo MTF corresponden a las señales del período especificado en el MTF. Es muy fácil de usar tanto para operar basado en un indicador como para usarlo en sus sistemas de trading. El marco temporal del indicador se puede configurar independientemente de la ventana principal, por
Desbloquee Señales Imparables : Su ventaja en el trading ¡Deje de adivinar y empiece a operar con confianza! El indicador Señales Imparables (Sistema BB-AO-MACD) es su herramienta todo en uno para captar movimientos de alta probabilidad en el mercado. Hemos fusionado el poder de tres indicadores probados - Bandas de Bollinger (BB) , Oscilador Asombroso (AO) y MACD - en un sistema simple que le da señales confirmadas, sin repintar , directamente en su gráfico. Por qué necesita este indicador Est
FREE

4 líneas de tendencia vienen dadas por 2 marcos temporales, definidos por el indicador zigzag. Aprovecha el indicador Zig Zag para identificar máximos y mínimos significativos en dos plazos configurables (por defecto: M15 para corto plazo y H1 para medio plazo), trazando automáticamente líneas de tendencia ascendentes y descendentes para cada uno de ellos. Esto ayuda a visualizar las estructuras de tendencia, las inversiones y las alineaciones entre marcos temporales sin cambiar de gráfico, al t
FREE

Actualizaciones
9/12/2023 - Si buscas el Spock EA, ya no lo vendo. DM mí para obtener más información.
24/10/2023 - Echa un vistazo a mis otros productos. Empezando a lanzar algunos EAs e indicadores basados en esta gama .
Actualmente no hay versión MT5. Estoy usando MT4 mí mismo.
Así que dedicaré mi tiempo principalmente a desarrollar estadísticas más extensas para la versión Stats y tal vez incluso un EA. Pero podría desarrollar una versión MT5.
Todo depende de la demanda. Es decir, cuant
FREE
1. Propósito y datos del indicador Visión general El pronosticador de regresión lineal es un indicador analítico avanzado diseñado para realizar una evaluación exhaustiva de la tendencia y un pronóstico de precios a corto plazo utilizando el método estadístico de regresión lineal (LR) .
Está optimizado para el marco temporal semanal (W1) y combina tanto el análisis de tendencias a largo plazo como la dinámica de tendencias móviles a corto plazo para generar previsiones semanales fiables. El indi
FREE
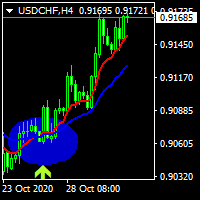
hola queridos hoy escribo un indicador de cruce de 2 medias móviles y mostrar una etiqueta para las señales de la misma . ....................... usted puede seleccionar el período de movimientos y el método de mover............... ......................y también el método de aplicar el precio y ver los movimientos y señales.................. ................también puede desactivar la visualización de los movimientos para ver sólo las etiquetas de señal.......................... ...............
FREE

El algoritmo se basa en la idea del indicador Currency Power Meter. Las diferencias de esta versión consisten en lo siguiente: el número de las divisas mostradas es ilimitado, el código es más compacto y más rápido, hay posibilidad de recibir los valores de la barra actual a través de los búferes del indicador. Qué es lo que muestra el indicador : la banda estrecha y el número superior en frente de la divisa muestra el índice de la fuerza relativa durante las últimas N horas (N se establece con
FREE

El indicador Multi Time Frame actúa como un escáner basado en el sistema de trading Ichimoku. El resultado se muestra en un tablero. Esto le ayuda a hacerse "de un vistazo" una imagen mental del Sistema sin tener que abrir el gráfico. Se pueden observar hasta 10 Divisas. Elementos Escaneados Y Leyenda "KUMO Futur" - Verde : El Kumo Futur es alcista. "KUMO Futur" - Rojo : El Kumo Futur es bajista. "PRICE Cross KJ" - Verde : El precio está por encima del Kijun Sen. "PRICE Cross KJ" - Rojo : El pre
FREE
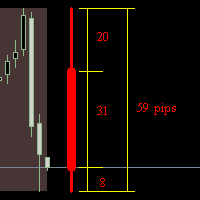
El indicador 'dibuja' una vela diaria, semanal o mensual en el gráfico actual. Muestra en puntos los tamaños de las sombras superior e inferior, el cuerpo y la vela completa. Funciona en tiempo real. Funciona en el probador de estrategias. Parámetros del indicador: How_much_to_show - cuántos bloques mostrar. Block_period - período de bloque (día / semana / mes) Shift - desplazamiento desde el borde del gráfico en barras. language - selección de idioma.
FREE
Indicador de Mapa de Calor para Análisis Avanzado de Volumen Este indicador ofrece una representación visual clara de la actividad de volumen en el mercado, facilitando la interpretación de patrones y variaciones relevantes. Características 1. Visualización en Mapa de Calor La intensidad del volumen se muestra mediante una escala de colores: • Azul: Actividad baja • Verde: Actividad moderada • Naranja: Actividad alta • Rojo: Volumen elevado 2. Interfaz Personalizable • Configuración de colores s

RQL Trend Board - Descripción RQL Trend Board es un simple pero poderoso tablero de tendencias multi-marco de tiempo.
Muestra la tendencia actual del mercado a través de varios marcos de tiempo al mismo tiempo, utilizando un método interno de clasificación de tendencias. Cada marco temporal se muestra como un cuadro de color: Verde - sesgo alcista → buscar configuraciones largas
Amarillo - oscilación / poco claro → no hay zona de comercio
Rojo - sesgo bajista → buscar configuraciones
FREE

El indicador Ska ZigZag Line determina las regiones de sobrecompra y sobreventa dentro de una tendencia. El indicador determina la región de sobrecompra por el máximo de la vela y la región de sobreventa por el mínimo de la vela en forma de línea. Para utilizar la estrategia completa recomiendo utilizar "Ska ZigZag Line" junto con "Ska ZigZag BuySell". NOTA: Este indicador es un indicador basado en líneas. COMO USARLO: Señal de venta: Realice una operación de venta cuando la flecha del indicador
FREE

"Capture the sleeping and waking alligator." Detect trend entrance/exit conditions - this indicator can also be tuned according to your trading style. You can adjust a confidence parameter to reduce false positives (but capture less of the trend). Se basa en una modificación del indicador Alligator de Bill Williams, uno de los primeros pioneros de la psicología de mercado. 2 estrategias principales: el enfoque "conservador " para realizar con mayor frecuencia operaciones rentables (con un benef
FREE

¡Libere su potencial de trading con Momentum Strength Signal! ¿Cansado de los indicadores rezagados y del confuso ruido del mercado? Momentum Strength Sign al es la herramienta de vanguardia creada para ofrecerle una ventaja decisiva centrándose en lo que realmente impulsa los precios: la pura fuerza del mercado . No se trata simplemente de otro indicador medio; es un sistema dinámico que identifica el momento exacto en que comienza una tendencia y confirma su validez, ayudándole a entrar y sal
FREE
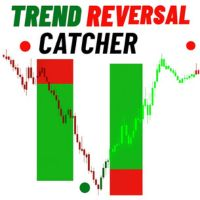
Trend Reversal Catcher with Alert MT5 Trend Reversal Catcher with Alert MT5 es un indicador de acción del precio que no repinta, no redibuja y no tiene retraso , diseñado para identificar puntos de giro precisos en el mercado. Combina la detección de pivotes, patrones de velas (pin bars y envolventes) y un filtro de volatilidad basado en ATR para ofrecer señales de reversión claras y confiables. MT5 https://www.mql5.com/en/market/product/150541?source=Site +Market+My+Products+Page
El

BuySell Volume es un indicador que aproxima los volúmenes de Compra y Venta basado en el movimiento del precio. Entrada Descripción: modelo_aplicado: Elige el modelo aplicado. En el modo de reversión baja, se considera que el precio recibe baja presión bajista durante la creación de la vela alcista (alta presión bajista en el modelo de reversión alta. En otras palabras, las velas Marubozu alcistas tienen volúmenes de compra realmente altos en el modelo de reversión baja que en el de reversión al
FREE

El indicador muestra la distribución de precios en un histograma horizontal. El histograma horizontal ayuda a encontrar los niveles clave del precio para que pueda tomar una buena decisión sobre el punto de toma de beneficios, stop loss... Con el histograma de precios puede mejorar su estrategia de negociación u obtener nuevas ideas.
Características destacadas Soporta múltiples marcos de tiempo : puede elegir trabajar con datos históricos en cualquier marco de tiempo que desee. No depende del m
FREE

FTU Corvus El indicador para la plataforma mt4 se puede utilizar únicamente para operar y se combina mejor con otros indicadores. Desarrollado con varios indicadores como macd, adx para dibujar una flecha para sugerir entrada o cambio de tendencia. Este indicador es similar a FTU Idioteque; consulte mis otros indicadores, como FTU Predictor Vea un breve vídeo de introducción en youtube: https://youtu.be/n_nBa1AFG0I Características: Vender y comprar flechas Alerta visual y sonora. Continuación d
FREE
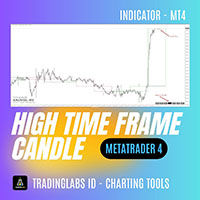
Temporizador HTF Candle Plus Actualice su experiencia de trading con HTF Candle Plus Timer, un indicador inteligente que muestra velas de mayor marco temporal directamente en su gráfico actual. Le permite mantenerse alineado con el panorama general del mercado mientras se centra en su marco de tiempo de negociación preferido. Características principales: Velas de mayor marco temporal
Trace velas personalizadas de mayor marco temporal (HTF) como H1, H4, D1, W1 o MN directamente en gráficos de men

¡Oferta por tiempo limitado! Para el lanzamiento de NextBot Scalper EA , el precio de este indicador bajará a GRATIS !
Presentamos una herramienta pragmática e innovadora para los operadores de MetaTrader 4 (MT4): el indicador Next channel de regresión lineal , mejorado con el coeficiente de determinación R 2. Este indicador sirve como herramienta fundamental para los operadores que buscan entender las tendencias del mercado a través de la lente del análisis estadístico, específicamente la reg
FREE

El indicador muestra dos líneas de Media Móvil en el gráfico con los parámetros especificados en los ajustes. Emite una señal en forma de flechas y un sonido en la intersección de estas medias móviles. En la configuración del indicador, puede establecer el período de la media móvil rápida ( Fast MA Period ) y la media móvil lenta ( Slow MA Period ) . Y también Shift, Applied Price, Method y Timeframe para dos Medias Móviles por separado . Importante:
¡¡¡La principal diferencia con otros indicado
FREE
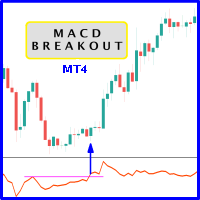
Surge la probabilidad de registrar precios más altos cuando MACD rompe el nivel de resistencia histórico del oscilador. Se recomienda encarecidamente confirmar la ruptura del precio con la ruptura del oscilador, ya que tienen efectos comparables a la ruptura de los niveles de soporte y resistencia del precio; seguramente, las operaciones cortas tendrán la misma percepción. Como ventaja, muchas veces la ruptura del oscilador precede a la ruptura del precio como una alerta temprana de un evento pr
FREE

H I G H - P R O B A B I L I D A D - B R E A K O U T T R E N D L I N D I C A T O R Este no es un indicador de línea de tendencia cualquiera. Tiene un algoritmo de alta probabilidad incorporado en el script para mostrar sólo las líneas de tendencia que pueden dar una muy alta probabilidad de ruptura del precio. El indicador no es un indicador independiente. El operador debe interpretarlo junto con su propia técnica de análisis para llegar a una estrategia de negociación más eficiente
FREE
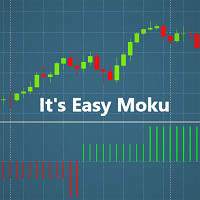
Presentación:
Bienvenidos queridos usuarios, Este indicador ha sido desarrollado con el fin de ayudar a los comerciantes que están luchando a diario para encontrar una estrategia . Siempre he sido acctracted por la estrategia de Ichimoku, sin embargo me tomó algún tiempo averiguar cómo funciona. ¡ Easy Moku hace Ichimoku simple!
Aspecto:
Easy Moku muestra 2 señales principales de ICHIMOKU: cruce kijun sen/tenken sen sen Span A Span B + Kijun sen/tenken sen ¡Deshágase de todas las Líneas Ichi
FREE

Si te gusta este proyecto, deja una revisión de 5 estrellas. A medida que las instituciones comercializan grandes volúmenes, no es raro que
traten de intentar
defender su posición en niveles porcentuales específicos. Estos niveles servirán como soporte natural y resistencia que usted puede
utilizar
para entrar en un comercio o estar consciente de posibles peligros contra su
posición. Un ejemplo de porcentajes usados comunes son 0.25% y 0.50% en EURUSD para el
semana, puedes ver este ejemplo e
FREE

ES GRATIS Recomiendo www.CoinexxBroker.com como un gran corredor y el que yo personalmente uso Asia sesión 1:00 a 9:00 (6pm est a 2 am est) Eur significa Londres Sesión 10:00 a 18:00 (3 am est a 11 am est) USA significa Sesión de Nueva York 15:00 a 23:00 (8 am est a 4 pm est) El indicador de sesión resalta el inicio de cada sesión de negociación. Puede mostrar todas las sesiones o editar la configuración para mostrar sólo las horas que desea resaltar (Asia) significa Sesión Asiática ,(Eur) signi
FREE

Descripción del indicador INDICADOR DE SEÑAL DE REY TITÁN DE ORO Señales de compra/venta de scalping de oro de alta precisión - Asistente de trading manual Visión general El Indicador Gold Titan King Signal es una herramienta manual asistente de trading diseñada para scalping de alta frecuencia en Oro (XAUUSD) y otros pares principales.
Genera señales claras de COMPRA/VENTA con niveles de entrada precisos, junto con niveles ajustables de Stop Loss y Take Profit mostrados directamente en

El principio de este indicador es muy simple: detectar el patrón de velas en el marco de tiempo M30, luego monitorear el punto de retorno del gráfico utilizando el pullback de High-Low de M5 Candlestick y finalmente predecir la señal de COMPRA y VENTA con flechas, alertas y notificaciones. Los parámetros son fijos y se calculan automáticamente en cada marco de tiempo. Ejemplo:
Si instala el indicador en XAUUSD, timeframe M5: el indicador detectará la reversión, pullback, acción del precio en e
FREE

Título del producto Smart Bollinger Bands (MT4) – parte de la serie SmartView Indicators Descripción breve Indicador Bollinger Bands con una experiencia de usuario única en la plataforma MetaTrader. Ofrece capacidades avanzadas no disponibles anteriormente, como abrir configuraciones con doble clic, ocultar y mostrar indicadores sin eliminarlos, y mostrar la ventana del indicador a tamaño completo del gráfico. Diseñado para funcionar perfectamente con el resto de la serie SmartView Indicators. V
FREE

Se trata de un indicador de señales de 15 minutos para todo tipo de operadores. Esto significa que puede obtener grandes beneficios operando con dos señales diferentes en un solo indicador.
NOTA: Ambos indicadores son canales para obtener el mismo resultado. FLECHA ROJA -- Señal de venta FLECHA AZUL -- Señal de compra
Compre ahora para formar parte de nuestra comunidad. Ofrecemos configuraciones de gráficos estándar para operadores principiantes e intermedios. ¡Opere con facilidad!
FREE

¿Alguna vez ha querido detectar una tendencia justo cuando empieza? Este indicador trata de encontrar los máximos y mínimos de una tendencia. Utiliza indicadores incorporados y estudia sus patrones de inversión. No se puede utilizar por sí solo, requiere estocástico (14) para confirmar la señal. Rojo para vender, Azul para comprar. No hay parámetros necesarios sólo tiene que adjuntar a un gráfico y está listo para ir. Echa un vistazo a otros grandes productos de https://www.mql5.com/en/users/aug
FREE

El indicador dibuja líneas de números redondos por distancia de pips. 1. Puede activar / desactivar el indicador para mostrar / ocultar las líneas. 2. Puede establecer la distancia de pips entre las líneas. 3. Puede editar el número de líneas. 4. Puede editar las propiedades de las líneas por entradas (estilo (DASH, DOT, SOLID, ...) , anchura (1 para DASH, DOT, 2 no es para DASH, DOT, sólo SOLID), color). Cuando se elimina el indicador del gráfico, se eliminan las líneas.
FREE

VR Ticks es un indicador especial para estrategias basadas en especulación. Gracias a este indicador, el operador puede ver el gráfico de ticks directamente en el gráfico principal del instrumento financiero. Un gráfico de ticks le permite ingresar una posición en el mercado o cerrar una posición en el mercado con la mayor precisión posible. VR Ticks traza los datos de las garrapatas en forma de líneas que cambian de color según la dirección; esto le permite comprender y evaluar visualmente la s
FREE
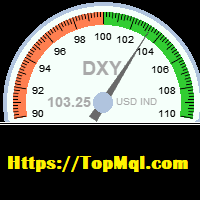
Este indicador se utiliza para calcular el índice del dólar de acuerdo con la fórmula de los pares de divisas (EURUSD, GBPUSD, USDJPY, USDSEK, USDCHF, USDCAD), incluso si el corredor no tiene el símbolo del dólar. este Indicador muestra el gráfico del índice del dólar en una ventana separada en la parte inferior del gráfico. También muestra gráficamente el índice del dólar actual. En este indicador, es posible establecer el valor mínimo y máximo del indicador, así como su escala de tamaño en el
FREE

Deja de adivinar, empieza a disparar: ¡Presentamos SR Sniper! ¿Cansado de puntos de entrada que parecen aleatorios? El indicador SR Sniper es su nueva herramienta esencial para encontrar operaciones de alta probabilidad con precisión quirúrgica. Está diseñado para atravesar el ruido del mercado, dándole claras señales de Compra y Venta justo en las zonas de precios más críticas. Este potente indicador combina el análisis dinámico del Índice del Canal de Materias Primas (CCI) con la detección au
FREE
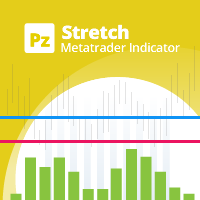
El Stretch es un patrón de precios de Toby Crabel que representa el movimiento/desviación media mínima del precio con respecto al precio de apertura durante un periodo de tiempo, y se utiliza para calcular dos niveles de ruptura para cada día de negociación. Se calcula tomando la SMA de 10 periodos de la diferencia absoluta entre el precio de apertura y el precio máximo o mínimo, la diferencia que sea menor. Este valor se utiliza para calcular los umbrales de ruptura para la sesión de negociació
FREE

Este indicador escanea para usted hasta 30 instrumentos de negociación y hasta 8 marcos temporales en busca de patrones de inversión de alta probabilidad: Dobles Tops/Bottoms con falsas rupturas . Por favor, lea también la entrada del blog "Operativa Profesional con Dobles Máximos/Bajos y Divergencias " que explica los conceptos detrás del indicador ULTIMO de Dobles Máximos/Bajos y cómo puede utilizar un enfoque profesional descendente. Esta versión GRATUITA del escáner escanea sólo EURUSD y GBP
FREE

Si te gusta este proyecto, deja una revisión de 5 estrellas. Trading grandes volúmenes requiere que veamos múltiples instrumentos/chartes a
encontrar nuevas oportunidades, este indicador le ayudará trazando
niveles por el múltiples de un número o su sufijo y actualizarlos
automáticamente
como el precio cambia, una tarea que de otro modo sería tedioso. Por ejemplo, en GBPUSD, usted podría tener 4 instancias del indicador en el
gráfico a trama: Cada intervalo de 0,01 con longitud de línea de 100
FREE

El indicador Matriz de correlaciones muestra la correlación real entre los instrumentos seleccionados. La configuración por defecto es de 28 pares de divisas, oro y plata, pero el indicador puede comparar cualquier otro símbolo.
Interpretación del indicador Correlación positiva (la correlación es superior al 80 %). Correlación negativa (la correlación es inferior al -80 %). Correlación débil o nula (correlación entre -80 % y 80 %).
Características principales El indicador muestra la correlació

El indicador muestra perfiles de mercado de cualquier duración en cualquier lugar del gráfico. Basta con crear un rectángulo en el gráfico y éste se rellenará automáticamente con el perfil. Cambie el tamaño del rectángulo o muévalo: el perfil seguirá automáticamente los cambios.
Funcionamiento
El indicador se controla directamente desde la ventana del gráfico mediante el panel de botones y campos para introducir parámetros. En la esquina inferior derecha de la ventana del gráfico hay un botón
MetaTrader Market - robots comerciales e indicadores técnicos para los trádres, disponibles directamente en el terminal.
El sistema de pago MQL5.community ha sido desarrollado para los Servicios de la plataforma MetaTrader y está disponible automáticamente para todos los usuarios registrados en el sitio web MQL5.com. Puede depositar y retirar el dinero a través de WebMoney, PayPal y tarjetas bancarias.
Está perdiendo oportunidades comerciales:
- Aplicaciones de trading gratuitas
- 8 000+ señales para copiar
- Noticias económicas para analizar los mercados financieros
Registro
Entrada
Si no tiene cuenta de usuario, regístrese
Para iniciar sesión y usar el sitio web MQL5.com es necesario permitir el uso de Сookies.
Por favor, active este ajuste en su navegador, de lo contrario, no podrá iniciar sesión.