Indicadores técnicos para MetaTrader 4 - 15
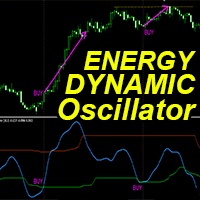
"Dynamic Energy Oscillator" es un indicador avanzado y personalizado de Crypto_Forex: ¡una herramienta de trading eficiente para MT4!
- Osciladores de nueva generación: vea las imágenes para saber cómo usarlo. - El Oscilador Dynamic Energy cuenta con zonas de sobreventa/sobrecompra adaptables. - Este es un indicador técnico de momentum muy útil en mercados de tendencia. - El Oscilador es una herramienta auxiliar para encontrar puntos de entrada exactos en zonas de sobreventa/sobrecompra. - Val
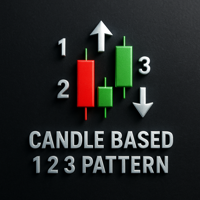
Patrón 1 2 3 Basado en Velas El Patrón 1 2 3 Basado en Velas es un indicador que identifica configuraciones de reversión de alta probabilidad utilizando la estructura clásica de precios 1-2-3, basada en velas y puntos de oscilación. Solo muestra señales después de una ruptura confirmada , lo que reduce el ruido y evita entradas prematuras. Características principales: Detección basada en velas de patrones 1-2-3 alcistas y bajistas confirmados Traza líneas de tendencia entre los puntos del patrón

Traza inmediatamente barras Renko en una ventana externa/indicadora . Una de las ventajas distintivas que ofrecen los gráficos Renko es el hecho de que no dependen del tiempo. Por lo tanto, los nuevos bloques Renko sólo se trazan cuando el precio sube o baja el número de puntos especificado.
Por ejemplo, un gráfico Renko de 10 pips (100 puntos) trazaría los bloques cuando el precio se mueva 10 pips al alza en una tendencia alcista o 10 pips a la baja en una tendencia bajista. Los gráficos Renko
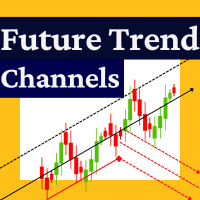
Future Trend Channel es un indicador dinámico y visualmente intuitivo diseñado para identificar la dirección de las tendencias y predecir posibles movimientos de precios. Originalmente desarrollado por ChartPrime para TradingView, esta herramienta ha sido adaptada para MetaTrader 4, ofreciendo a los traders una funcionalidad similar. Ya sea que seas un trader de swing, day trader o inversor a largo plazo, Future Trend Channel te ayuda a visualizar la fuerza de la tendencia, anticipar reversiones

Introducción Los patrones armónicos se utilizan para predecir posibles puntos de inflexión. Tradicionalmente, los patrones armónicos se identificaban manualmente conectando los puntos máximos y mínimos del gráfico. La detección manual de patrones armónicos es dolorosamente tediosa y no es adecuada para todo el mundo. A menudo se está expuesto a la identificación subjetiva de patrones con la detección manual de patrones. Para evitar estas limitaciones, Harmonic Pattern Plus ha sido diseñado para

CS ATR FIBO CANALES MULTI TIMEFRAME
Herramienta adicional para operar con el Indicador Cycle Sniper.
Francotirador de Ciclo : https://www.mql5.com/en/market/product/51950 El indicador dibuja canales basados en: - Precio del Cycle Sniper y Medias Móviles - Desviaciones ATR - Retrocesos y extensiones de Fibonacci
Características: - Multi TimeFrame - Opciones completas de alerta y notificación. - Ajustes sencillos - Encuentra el cambio de tendencia o reversiones extremas.
Entradas: - Modo Flech
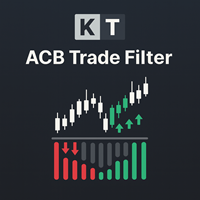
El indicador ACB Trade Filter ofrece una solución para filtrar las configuraciones de negociación de baja probabilidad en una estrategia de negociación. El indicador utiliza un sofisticado algoritmo de filtrado basado en el sentimiento y la tendencia del mercado.
Aplicaciones Funciona muy bien con nuestro indicador "ACB Breakout Arrows ". Filtre las señales de baja probabilidad de cualquier indicador. Evite el exceso de operaciones y minimice las pérdidas. Opere en la dirección del sentimiento
- Precio real es de 80$ - Descuento del 60% (Ahora es de 30$) - Está habilitado para 1 compra. ¡Póngase en contacto conmigo para la herramienta de bonificación extra, instrucción o cualquier pregunta! - No repintado, No lag - Yo sólo vendo mis productos en Elif Kaya Perfil, cualquier otro sitio web son robados versiones antiguas, Así que no hay nuevas actualizaciones o apoyo. - Actualización de por vida libre
Introducción Smart Money Concepts (SMC) estrategia se popularizó inicialmente el métod

Las Smart Fibo Zones son potentes retrocesos de Fibonacci autogenerados que están anclados a cambios clave en la estructura del mercado . Estas zonas sirven como niveles críticos de Oferta y Demanda , guiándole para identificar posibles reacciones de los precios y confirmar la dirección del mercado. Los cálculos de Fibonacci , ampliamente utilizados por los operadores profesionales, pueden ser complejos a la hora de identificar máximos y mínimos. Sin embargo, Smart Fibo Zones simplifica este pro
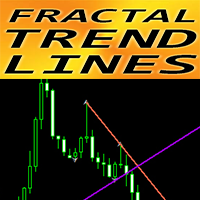
Indicador Crypto_Forex "Fractal Trend Lines" para MT4.
- Este indicador es excelente para los operadores que utilizan el análisis gráfico con rupturas. - "Fractal Trend Lines" muestra líneas gráficas de tendencia ascendente (color violeta) y tendencia descendente (color rojo). - Las líneas de tendencia ascendente y descendente se construyen sobre los 2 fractales correspondientes más cercanos. - El indicador tiene pocos parámetros responsables del color y el ancho de las líneas de tendencia. -
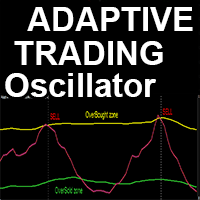
Indicador avanzado y personalizado para criptomonedas y Forex: "Oscilador de Trading Adaptativo" - ¡una herramienta auxiliar de trading eficiente para MT4!
- Este indicador es una nueva generación de osciladores. Consulte las imágenes para ver cómo usarlo. - El "Oscilador de Trading Adaptativo" cuenta con zonas de sobreventa/sobrecompra adaptativas y ajustables. - Este oscilador es una herramienta auxiliar para encontrar puntos de entrada y salida precisos en las zonas dinámicas de sobreventa/
40% de descuento. Precio original: $50
Moving Average Trend Scanner es un panel de control de triple cruce de medias móviles con múltiples símbolos y marcos temporales que ayuda a los operadores a supervisar e identificar posibles tendencias del mercado desde un solo gráfico. Este panel escanea 3 medias móviles en hasta 28 instrumentos configurables y 9 marcos temporales para la triple alineación de medias móviles y el cruce de medias móviles con una función de escaneo profundo para escanear t

Descripción del indicador CustomMultiBarFractal
Descripción El indicador CustomMultiBarFractal identifica y muestra patrones fractales en los gráficos de precios. Los fractales representan puntos de reversión de precios significativos que pueden servir como señales para estrategias de negociación.
Características principales - Detecta fractales basándose en un periodo de análisis definido por el usuario. - Muestra fractales superiores e inferiores con colores personalizables - Permite ajustar
FREE
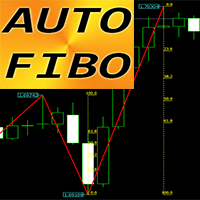
Indicador "Auto FIBO" de Crypto_Forex: ¡una excelente herramienta auxiliar para operar!
- El indicador calcula y coloca automáticamente en el gráfico los niveles de Fibonacci y las líneas de tendencia locales (color rojo). - Los niveles de Fibonacci indican las áreas clave donde el precio puede revertirse. - Los niveles más importantes son 23,6%, 38,2%, 50% y 61,8%. - Puede usarlo para scalping de reversión o para operar en cuadrículas de zona. - También existen muchas oportunidades para mejor

Indicador Fibomathe: Herramienta de soporte y resistencia para MT4 El indicador Fibomathe es una herramienta de análisis técnico diseñada para MetaTrader 4 (MT4) que ayuda a los operadores a identificar niveles de soporte y resistencia, zonas de toma de beneficios y áreas adicionales de proyección de precios. Es adecuado para los operadores que utilizan enfoques estructurados para analizar la acción del precio y gestionar las operaciones. Características principales Niveles de soporte y resisten
FREE
AP Día-Semana-Mes Máximo-Mínimo MT4
Superposición ligera que dibuja los máximos/mínimos del Día, Semana y Mes anteriores en cualquier gráfico. Ideal para planificar sesiones, confluencias y alertas cuando el precio vuelve a niveles de oscilación importantes.
Qué hace Traza 6 líneas: Máximo/Mínimo del día, Máximo/Mínimo de la semana, Máximo/Mínimo del mes (de las sesiones anteriores completadas).
Alerta cuando el precio alcanza una línea seleccionada (con una tolerancia fijada por el usuario)
FREE

El indicador de volatilidad SPV es uno de los filtros más eficaces. Filtro de volatilidad. Muestra tres opciones de volatilidad. Las denominadas límite, real, y la última más efectiva para el filtro es el filtro porcentual. El porcentaje de folatilidad muestra la relación entre la volatilidad límite y la volatilidad real. Y así, si operamos en el medio del canal, entonces es necesario establecer la condición de que el porcentaje sea inferior a un determinado valor del indicador. Si operamos en l
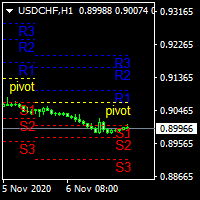
.................................si necesitas niveles de punto pivote............................... ............................este es un creador de niveles de puntos pivote diarios........................... ...es para pivotes diarios y muestra niveles en periodos H4 , H1 , M30 , M15 ,M 5... .................................también muestra los niveles de 3 últimos días.............................. ................puede utilizarlo con otros indicadores y ver los niveles importantes...........
FREE
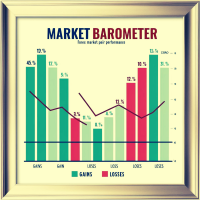
Market Barometer es un código de trucos para el comercio, actúa como un "barómetro" para el sentimiento del mercado a través de varios pares, mostrando sus cambios. Puede saber de inmediato con qué operar. Puede operar tendencias o retrocesos. Versión MT5: https: //www.mql5.com/en/market/product/127467 Market Barometer es una poderosa herramienta diseñada para rastrear y visualizar los cambios porcentuales a través de múltiples pares de divisas. Mediante el análisis de los cambios de precios de

Este indicador está diseñado para detectar patrones de inversión de alta probabilidad: Dobles Tops/Bottoms con rupturas falsas . Por favor, lea también la entrada del blog "Cómo obtener grandes ganancias de forma consistente " que explica los conceptos detrás del indicador ULTIMATE Double Top/Bottom y cómo se puede utilizar un enfoque top-down para obtener 15 - 20R operaciones ganadoras de forma regular . El video muestra el máximo rendimiento del indicador. Con rendimiento máximo, quiero decir
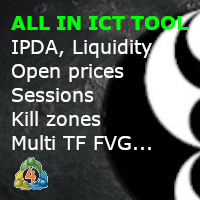
ICT Template Indicator visualiza y actualiza automáticamente todos los elementos importantes de ICT para Scalpers, Day y Swing traders. Le permite mantener su gráfico limpio y traer cualquier elemento con un solo clic a los botones laterales. Gracias a las notificaciones móviles sobre los niveles de liquidez externa, no perderá ninguna oportunidad y no tendrá que sentarse detrás de las pantallas todo el día. Cada elemento tiene colores totalmente personalizables, anchura, tipos de línea, plazo

Un trader profesional es un trader codicioso: compra en mínimos y vende en máximos con riesgos mínimos y altos retornos,,
Pips Slayer está desarrollado exactamente para tal enfoque de trading . Es un indicador universal para el seguimiento de reversiones y utiliza patrones de acción de precios, discrepancia de indicadores personalizados y una fórmula de múltiples capas para identificar estructuras de reversión. El indicador es muy fácil de usar; sólo muestra flechas donde se recomienda comprar
FREE

Cruce de Líneas de Tendencia Este indicador le alertará de cualquier cruce de una Línea de Tendencia. Puede dibujar hasta dos líneas de tendencia y formar un canal, un banderín, un triángulo o una tendencia simple y cuando el precio cruce cualquiera de las líneas de tendencia el indicador le proporcionará las alertas que usted defina más una flecha hacia arriba o hacia abajo cuando se produzca el cruce. Cómo hacerlo Dibuje la primera línea de tendencia y nómbrela tl1. Dibuje la segunda línea de
FREE

Oro TL MTF - se trata de un indicador técnico de valores. El algoritmo del indicador analiza el movimiento del precio del activo y refleja las líneas de tendencia a lo largo de los fractales de un marco temporal (TF) específico.
Ventajas del indicador: El indicador produce señales con alta precisión. La señal confirmada del indicador no desaparece y no se redibuja. Puede operar en la plataforma MetaTrader 4 de cualquier broker. Puede operar con cualquier activo (divisas, metales, criptodivisas,
FREE
El indicador encuentra un volumen bajo, alto y extremo basado en los coeficientes dados y los colorea en los colores especificados. Reemplaza la función estándar de dibujo de volúmenes en el terminal metatrader. Las velas también se pueden pintar en el color del volumen. En las velas con un volumen extremo, se determina el volumen horizontal máximo (cluster/POC). Dependiendo de su ubicación (empujar, neutral, detener), el clúster también tiene su propio color. Si el clúster está en la sombra y
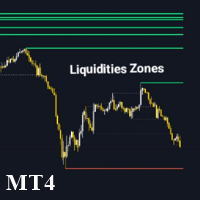
El Liquidity Zone Detector es un indicador técnico avanzado diseñado para identificar y destacar las zonas clave de liquidez en el mercado utilizando el indicador ZigZag. Esta herramienta localiza los niveles de precios donde es probable que exista una liquidez significativa trazando líneas de tendencia en los máximos y mínimos detectados por ZigZag. El Liquidity Zone Detector ayuda a los traders a identificar posibles áreas de reversión o continuación de tendencia basadas en la acumulación o li

Necessary for traders: tools and indicators Waves automatically calculate indicators, channel trend trading Perfect trend-wave automatic calculation channel calculation , MT4 Perfect trend-wave automatic calculation channel calculation , MT5 Local Trading copying Easy And Fast Copy , MT4 Easy And Fast Copy , MT5 Local Trading copying For DEMO Easy And Fast Copy , MT4 DEMO Easy And Fast Copy , MT5 DEMO "Cooperativa QQ: 556024" "Cooperación wechat: 556024" "Correo electrónico cooperativo: 55602
FREE
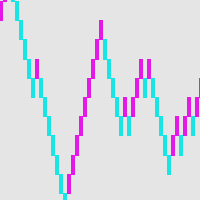
Diagrama de bloques: una forma alternativa de comercio Si es un comerciante que está confundido por las velas en innumerables gráficos, o no sabe cómo dibujar líneas o cómo dibujar líneas de soporte y resistencia, debería encontrar otro método de negociación que se adapte a sus necesidades en este momento. NS. Al igual que un conductor se detiene para una revisión completa después de encontrar problemas repetidamente, lo mismo ocurre con una transacción. El gráfico de ladrillos proporciona un mé
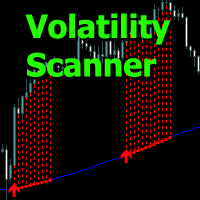
Volatility Scanner - este indicador analiza la condición del mercado y muestra las zonas de volatilidad creciente mediante líneas de histograma.
El indicador permite determinar los momentos para abrir y mantener posiciones, trabajar en la dirección de la tendencia o cuándo esperar a que pase el tiempo sin operar.
Los parámetros de entrada permiten configurar el indicador de forma independiente para el instrumento de trading o el marco temporal deseado.
Se puede usar en cualquier marco temporal,

Introducción Este indicador detecta patrones de dispersión de volumen para oportunidades de compra y venta. Los patrones incluyen patrones de demanda y oferta. Puede utilizar cada patrón para operar. Sin embargo, estos patrones se utilizan mejor para detectar la zona de demanda (=zona de acumulación) y la zona de oferta (=zona de distribución). La pauta de demanda indica, por lo general, una posible oportunidad de compra. El patrón de oferta indica, por lo general, una posible oportunidad de ven
FREE
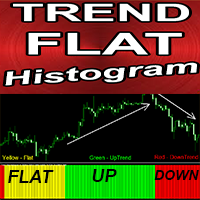
Indicador Crypto_Forex "Histograma de Tendencia Plana" para MT4, sin repintado.
- El indicador Histograma de Tendencia Plana es muy sensible y mucho más eficiente que cualquier media móvil estándar. - Está diseñado para mostrar las condiciones actuales del mercado: Plana, Tendencia alcista, Tendencia bajista. - El indicador tiene 3 colores: Amarillo para condiciones de mercado planas, Rojo para tendencia bajista y Verde para tendencia alcista (los colores se pueden cambiar en la configuración)
Descripción general BBWidth 3Lines es un indicador personalizado que muestra la diferencia entre la banda superior e inferior de las Bandas de Bollinger (es decir, +σ menos −σ) como una línea continua en una subventana. El valor se expresa en puntos, no en precios. A diferencia de las Bandas de Bollinger tradicionales, que se centran en la desviación del precio, este indicador se enfoca exclusivamente en la anchura de las bandas , lo que permite analizar la volatilidad del mercado de manera visu
FREE
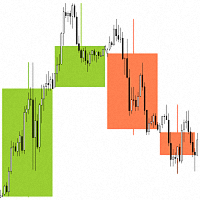
"Candlesticks MTF 4 " es un indicador de información que muestra "Velas japonesas" . El indicador analiza y determina las horas de apertura y cierre de las velas de marcos temporales superiores.
Se ha desarrollado un algoritmo para el indicador "Candlesticks MTF 4 " que corrige la discrepancia entre las horas de apertura y cierre de las velas de marcos temporales superiores. Por ejemplo, si la hora de apertura de una vela en un marco de tiempo semanal es el día 1 del mes, y en el marco de tiem
FREE
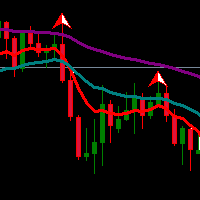
La media móvil exponencial (EMA) es un indicador que suelen utilizar los operadores. La combinación de dos o tres indicadores EMA a menudo se aplica para determinar la dirección de la tendencia. Múltiples EMA combinado con fractales o indicador oscilador para detectar sobrecompra / sobreventa y el punto de divergencia también es ideal para hacer en el sistema de comercio.
Si te gusta el indicador EMA y desea obtener un mejor indicador, muy recomendable el uso de EMA SuperTrend Estrategia Indica
FREE

Título del producto Smart Accelerator (MT4) – parte de la serie SmartView Indicators Descripción breve Indicador Accelerator con una experiencia de usuario única en la plataforma MetaTrader. Ofrece capacidades avanzadas no disponibles anteriormente, como abrir configuraciones con doble clic, ocultar y mostrar indicadores sin eliminarlos, y mostrar la ventana del indicador a tamaño completo del gráfico. Diseñado para funcionar perfectamente con el resto de la serie SmartView Indicators. Visión ge
FREE

Título del producto Smart Ichimoku (MT4) – parte de la serie SmartView Indicators Descripción breve Indicador Ichimoku con una experiencia de usuario única en la plataforma MetaTrader. Ofrece capacidades avanzadas no disponibles anteriormente, como abrir configuraciones con doble clic, ocultar y mostrar indicadores sin eliminarlos, y mostrar la ventana del indicador a tamaño completo del gráfico. Diseñado para funcionar perfectamente con el resto de la serie SmartView Indicators. Visión general
FREE
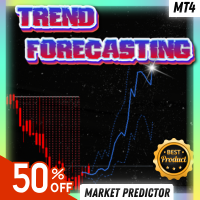
Summer Sale: 50% OFF!!! Promotion is valid until 08 August 2025! Este indicador es imparable cuando se combina con nuestro otro indicador llamado Katana. Después de la compra, envíenos un mensaje y usted podría conseguir Katana GRATIS como un bono. Después de la compra, envíenos un mensaje privado para sus instrucciones. El indicador de Predicción de Tendencia es una herramienta única y fácil que es capaz de hacer predicciones sobre el futuro movimiento del precio basado en las señales generad
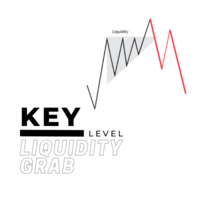
Para que se produzca un movimiento alcista, por ejemplo, debe haber mucho poder de compra, pero no se puede comprar si no hay venta en el otro lado, por lo que los grandes jugadores suelen tender a manipular el mercado con el fin de crear posiciones disponibles en el otro lado y poder abrir sus posiciones y una de las maneras es mediante la creación de una ruptura falsa / una toma de liquidez. Antes de que se formen la mayoría de los grandes movimientos de inversión y las tendencias, se habría p

Visión general
El indicador TTM Squeeze ayuda a identificar los periodos de baja volatilidad (squeeze) que a menudo preceden a las rupturas de precios. Utiliza las Bandas de Bollinger (BB) y los Canales de Keltner (KC) para determinar cuándo el mercado está "enrollándose" y listo para moverse. Guía de configuración Configuración de la volatilidad El indicador utiliza las Bandas de Bollinger para medir la volatilidad del mercado. Cuando las BBs están dentro de los Canales Keltner, se detecta un
FREE

Notificador de Volatilidad de Alta Precisión V1.10 Desarrollado por: Grazia-system-com Título: Deje de perseguir la volatilidad: Obtenga una notificación solo cuando comience la verdadera ruptura. La herramienta profesional con filtro de ruido que transforma tu MT4/MT5 en un sistema de monitorización inteligente y proactivo. Nunca más se pierda un movimiento a nivel institucional. Por qué este detector es diferente (Inteligencia de doble capa con filtro de ruido) La mayoría de las herramien
FREE

El indicador está diseñado para mostrar los siguientes niveles de precios en el gráfico: Máximo y mínimo del día anterior. Máximo y mínimo de la semana anterior. Máximo y mínimo del mes anterior. Cada uno de los tipos de niveles es personalizable. En la configuración del indicador, se establece el estilo de la línea, el color de la línea, activar o desactivar los niveles separados. La versión del mismo indicador exacto, pero sólo con alertas de sonido allí - Niveles de tiempo con alertas .
Conf
FREE

Scalping monstruo está diseñado para la plataforma Metatrader4. Cuando se coloca en un gráfico de divisas, el indicador analiza automáticamente el mercado utilizando un algoritmo de adaptación y muestra las señales al operador en forma de puntos rojos y azules. El indicador también muestra en la esquina superior derecha información sobre posibles ganancias / pérdidas.
Cómo comerciar usando Scalping monster: cuando el punto azul aparece en la tabla, abrimos una orden de compra. Cierre la ord

Estrategia Óptima
Sea su asistente de trading MT Merit Conteo de Velas :
Diseñado para la negociación de opciones binarias, el indicador cuenta el número de velas alcistas o bajistas, por lo que es adecuado tanto para estrategias de martingala como de negociación estándar.
Es ideal para operadores experimentados y aplicable a Forex, ya que ayuda a calibrar el volumen y a identificar tendencias o posibles retrocesos en el gráfico. Indicador para operadores que prefieren el trading manual.
OPER
FREE
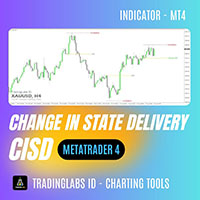
Indicador CISD (Cambio en la entrega estatal) TradingLabs ID - Herramienta del Concepto ICT El indicador CISD (Change In State Delivery) está diseñado en base al concepto ICT (Inner Circle Trader), donde las transiciones de precios de un estado de entrega a otro a menudo señalan oportunidades de trading de alta probabilidad. Esta herramienta detecta y marca automáticamente los niveles CISD en sus gráficos MT4, ayudando a los operadores a identificar posibles zonas de ruptura y retesteo con gran

Este es un indicador Fractals modificado. Funciona de forma similar al indicador original de Bill Williams, y se ha mejorado adicionalmente con la posibilidad de cambiar el radio del máximo, en contraste con el radio estándar de 2 barras. En pocas palabras, el indicador comprueba el tope y si es el mínimo/máximo en este radio, dicho tope se marca con una flecha. Ventajas Radio ajustable. Utilización para trazar niveles de soporte y resistencia. Uso para trazar canales de tendencia. Uso dentro de
FREE
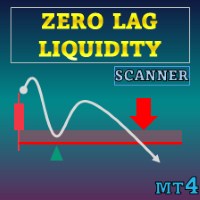
Oferta especial : ALL TOOLS , ¡solo $35 cada uno! Nuevas herramientas costarán $30 durante la primera semana o para las primeras 3 compras ! Canal de Trading Tools en MQL5 : Únete a mi canal de MQL5 para recibir mis últimas novedades Zero Lag Liquidity traza zonas de liquidez a partir de perfiles de mechas en marcos temporales inferiores y mechas de alto volumen. Para cada vela anómala, el indicador construye un histograma de volumen dentro de la mecha, encuentra un Punto de Contro

Traza automáticamente niveles Fibonacci, basado en los precios Máximo y Mínimo del marco de tiempo especificado Varias velas pueden unirse: por ejemplo, puede obtener un Fibonacci basado en los Máximos y Mínimos de 10 días Mi #1 Utilidad : 66+ funciones, incluido este indicador | Contácteme para cualquier pregunta | Versión MT5 Ayuda a ver niveles potenciales de reversión; Los patrones formados en los niveles Fibonacci tienden a ser más fuertes; Reduce significativamente el t
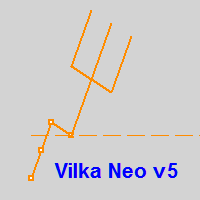
Neo Fork v5 se desarrolló para el sistema de trading "Oracle", pero poco a poco se fue complementando con, por ejemplo, ángulos de Gann y otras opciones.....
Usted puede crear objetos gráficos con color, estilo y grosor especificados, tales como: rectángulos con y sin relleno, segmentos de líneas de tendencia y una herramienta no estándar - "Neo Fork" en forma de tridente, así como existe la oportunidad de ajustar interactivamente la paleta de colores directamente desde el gráfico, ajustar la vi
FREE

El indicador define un corredor de negociación, un mercado plano y correcciones .
Permite comparar la importancia de diferentes zonas planas y de tendencia (por tiempo de existencia y por volatilidad). Esto permite evaluar de un vistazo el ciclo del mercado y su estado de ánimo.
Es decir, cuánto dura de media el flat, y cuánto dura la tendencia y qué tipo de volatilidad tienen en puntos.
Por regla general, cuanto más dure el flat, más probabilidades hay de que se acumule el potencial para u
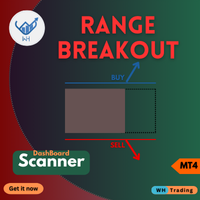
Descubra una nueva dimensión del trading con nuestro innovador indicador MQL4, Range BreakOut MT4
Esta poderosa herramienta está diseñada para identificar y capitalizar los movimientos de precios a medida que se salen de los rangos establecidos,
brindándole la precisión y confianza necesarias para prosperar en el dinámico mundo de los mercados financieros.
Versión MT5 : WH Range BreakOut MT5
Características:
Detección de rango preciso. Símbolos múltiples y marcos de tiempo múltiples (
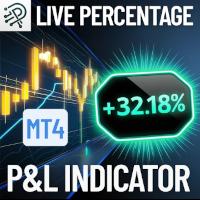
Controle rápidamente sus ganancias o pérdidas flotantes como porcentaje del saldo de su cuenta, en directo y siempre visible en su gráfico. Características principales: Cálculo en tiempo real: Calcula instantáneamente la ganancia o pérdida flotante combinada de todas las operaciones abiertas como porcentaje del saldo actual de su cuenta. Fácil visualización en el gráfico: El resultado se muestra convenientemente como una etiqueta en la esquina inferior derecha de su gráfico, sin distracciones,
FREE

El Indicador de Rango Asiático ICT es una potente herramienta diseñada para ayudar a los operadores a identificar las estructuras clave del mercado y las zonas de liquidez, basándose en la Estrategia de Trading de Rango Asiático ICT. Marca los niveles de precio máximo y mínimo de la sesión asiática (de 19:00 a medianoche, hora de Nueva York) y proporciona información crucial sobre los movimientos del mercado en las siguientes sesiones. Este indicador mejora la precisión de las operaciones al
Este es un indicador personalizado basado en el ángulo de la Media Móvil Exponencial (EMA), típicamente utilizado para medir el ángulo de tendencia de las líneas EMA. Aquí están los principales parámetros y funciones de este indicador: Parámetros principales: md1: Periodo rápido para EMA, valor por defecto es 12. md2: Periodo lento para EMA, valor por defecto es 26. md3: Periodo para la línea de señal MACD, valor por defecto es 9. Funciones: El indicador calcula el indicador MACD y categoriza lo
FREE

Gina Dual TPO - Breve indicador MQL4 TPO + Perfil de volumen superpuesto en el gráfico - rápido, escalable y fácil de usar para principiantes. Construido para traders que leen la estructura del mercado por POC y Área de Valor. En qué consiste Un indicador MQL4 que superpone perfiles de mercado duales - Tiempo al Precio (TPO) y Volumen al Precio (VPO) - directamente en su gráfico. Es rápido (dibujo basado en píxeles), escalable y fácil de usar para principiantes. A quién va dirigido Operadores i
FREE

Este indicador tiene el propósito de representar visualmente el canal Donchian en tu gráfico de trading. El canal Donchian es una herramienta técnica sencilla utilizada para representar el rango entre el punto más alto y el punto más bajo durante un período específico. Este indicador mejora el análisis visual de los movimientos de precios, ofreciendo perspicacia en puntos potenciales de ruptura y continuación de tendencias. El canal Donchian puede aplicarse tanto al marco de tiempo actual como a
FREE

El indicador muestra cualquier texto e imagen en el gráfico, y también puede mostrar información solicitada por macros. Hay tres bloques de texto y un bloque para imágenes. Se puede seleccionar la fuente, el tamaño, el color, la sangría y la posición. Si desea marcar sus capturas de pantalla o mostrar la información requerida en un gráfico, UPD1 Watermark será una herramienta muy útil.
Descripción de los ajustes.
Ajustes de texto (3 bloques). Text 1, 2, 3 – introducir texto y, o macro. Font N
FREE
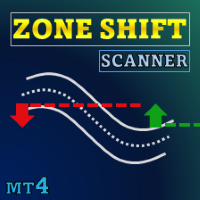
Oferta especial : ALL TOOLS , ¡solo $35 cada uno! Nuevas herramientas costarán $30 durante la primera semana o para las primeras 3 compras ! Canal de Trading Tools en MQL5 : únete a mi canal de MQL5 para recibir mis últimas novedades Zone Shift es una herramienta de identificación de tendencias que utiliza bandas basadas en EMA/HMA para detectar cambios de tendencia y mostrar niveles clave de reacción. Muestra la dirección de la tendencia mediante los colores de las velas y marca l
¡Deje de perder poderosas oportunidades de ruptura! El Advanced Breakout Scanner Dashboard es una herramienta de trading profesional que monitoriza hasta 28 pares de divisas en tiempo real, buscando simultáneamente diez estrategias únicas de ruptura de alta probabilidad. Conéctelo a un solo gráfico para obtener una visión completa de todo el mercado, identificando al instante las mejores configuraciones de negociación a medida que ocurren. No se trata sólo de un indicador de señales, sino de un

VWAP y Media Móvil Una combinación de supertendencia y media móvil para crear una configuración de operación convergente Parámetros de entrada: signal mode: ajústelo a true si desea conectarlo a STAT (Signal Tester y Trader) desplazamiento de la flecha: distancia entre la línea de la EMA rápida y la flecha del gráfico activar la señal de media móvil para la configuración convergente Periodo VWAP Periodo MA Método de promediación MA método de fijación de precios MA límite de nivel superior (VWAP
FREE

Recordatorio plano Vista general Flat Reminder es una potente herramienta de análisis técnico que identifica y resalta las zonas de consolidación de precios en su gráfico. Detecta cuándo la acción del precio se ralentiza y se mueve lateralmente, indicando posibles puntos de reversión, configuraciones de continuación o zonas de decisión clave en el mercado. Características principales Detección de consolidaciones : Identifica automáticamente las zonas de precios planos en las que disminuye el imp
FREE

Introducción La divergencia RSI es una técnica principal utilizada para determinar el cambio de tendencia cuando es el momento de vender o comprar porque los precios pueden bajar o subir en los gráficos. El indicador de Divergencia RSI puede ayudarle a localizar la parte superior e inferior del mercado. Este indicador encuentra la divergencia regular para el pullback del mercado y también encuentra la divergencia oculta del RSI para mostrar la continuación de la tendencia. Este indicador muestra
FREE

Este indicador es una herramienta sencilla para detectar una posible tendencia.
Cuando la cinta está por debajo de las barras de precios, se volverá de color verde y la tendencia se considera alcista. Cuando la cinta está por encima de las barras de precios, se volverá de color rojo y la tendencia se considera bajista. Se puede utilizar como señal de entrada Señal de salida o trailing stop, por lo que es muy versátil. El color por defecto es: Verde para tendencia alcista y Rojo para tendencia
FREE

Buscando puntos de entrada a lo largo de la tendencia local ¡sin repintar! Las flechas indican puntos de entrada. Basado en indicadores clásicos. El indicador es fácil de usar. Configuración Наименование Описание Factor de frecuencia Frecuencia de la señal. Cuanto menor, mayor frecuencia.
Esto afecta a la calidad.
Recomendaciones Recomendado para su uso en los principales pares de divisas. Timeframe de m5, m15, m30 Suscríbete a mi canal de telegram, donde discutimos el comercio intradía, ideas,
FREE

Este indicador utiliza las líneas de las Bandas de Bollinger para detectar la tendencia de los mercados. Es una herramienta muy útil para el trading manual. Además, es posible utilizar el indicador con ATR como filtro , así como la opción de que aparezca una alerta cuando se produzca un cambio de tendencia. Las lecturas son muy sencillas de usar y entender. El indicador funciona mejor en el marco de tiempo H1.
Puede obtener el código fuente desde aquí .
Parámetros BarsCount - Cuántas barras se
FREE
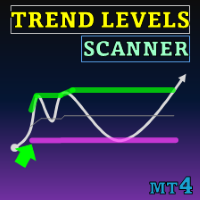
Special offer : ALL TOOLS , just $35 each! New tools will be $30 for the first week or the first 3 purchases ! Trading Tools Channel on MQL5 : Join my MQL5 channel to update the latest news from me El indicador Niveles de Tendencia (Trend Levels) está meticulosamente diseñado para identificar niveles de tendencia críticos — Alto, Medio y Bajo — durante los movimientos del mercado. Con cálculos en tiempo real basados en los valores más altos, más bajos y de nivel medio a lo largo de
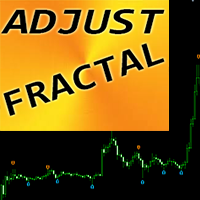
"Adjustable Fractals" es una versión avanzada del indicador fractal, ¡una herramienta de trading muy útil!
- Como sabemos, el indicador fractal estándar de mt4 no tiene ninguna configuración, lo que resulta muy incómodo para los traders. - Adjustable Fractals ha resuelto ese problema: tiene todas las configuraciones necesarias: - Período ajustable del indicador (valores recomendados: por encima de 7). - Distancia ajustable de los máximos y mínimos del precio. - Diseño ajustable de las flechas

[V 1.00] ¡Se ha lanzado MTF NRPA 5 Moving Average RTD!
Panel de control en tiempo real de flecha sin repintar.
Si está buscando el mejor indicador de promedio móvil, entonces está en la página correcta. Generalmente, la gente instalará dos medias móviles porque la intersección de las dos medias móviles (el cruce) determinará la dirección de la próxima tendencia de precios. Si el promedio móvil rápido se cruza con el promedio móvil lento y rápido > lento, entonces la tendencia es alcista. Por

ZigZag WaveSize: un indicador ZigZag estándar modificado con la adición de información sobre la longitud de onda en puntos.
Peculiaridades: Lógica de construcción en línea optimizada: las etiquetas no se vuelven a dibujar desde cero en cada marca, sino que funcionan en paralelo con el cálculo principal, dibujando solo las últimas etiquetas cuando ZigZag dibuja nuevas líneas o las actualiza. Se agregó otro modo de cálculo en puntos: la línea se construye si excede el número de puntos especifica
FREE

¡ Bitcoin 999 - es un indicador de tendencia que analiza automáticamente el mercado y proporciona información sobre la tendencia y cada uno de sus cambios, así como dar señales para entrar en operaciones sin redibujar! El indicador utiliza cada vela, analizándolas por separado. refiriéndose a diferentes impulsos - impulso alcista o bajista. ¡ Puntos exactos de entrada en operaciones de divisas, cripto, metales, acciones, índices!
Funciones principales: Señales de entrada exactas SIN REPINTAR ¡
FREE

Este indicador es la base de un Asesor Experto que puede ser categorizado como "casi el Grial". Vea los detalles a continuación. Este indicador muestra la proyección del gráfico Renko en el gráfico de precios. Esta proyección se muestra como una línea escalonada, no como "ladrillos" (rectángulos). Ver diapositivas 1 y 2. Nombre abreviado del indicador: LRC - Línea de Renko en el gráfico de precios. El principio de su construcción es muy simple. En primer lugar, se construye una cuadrícula de lí
FREE
MetaTrader Market es el mejor lugar para vender los robots comerciales e indicadores técnicos.
Sólo necesita escribir un programa demandado para la plataforma MetaTrader, presentarlo de forma bonita y poner una buena descripción. Le ayudaremos publicar su producto en el Servicio Market donde millones de usuarios de MetaTrader podrán comprarlo. Así que, encárguese sólo de sus asuntos profesionales- escribir los programas para el trading automático.
Está perdiendo oportunidades comerciales:
- Aplicaciones de trading gratuitas
- 8 000+ señales para copiar
- Noticias económicas para analizar los mercados financieros
Registro
Entrada
Si no tiene cuenta de usuario, regístrese
Para iniciar sesión y usar el sitio web MQL5.com es necesario permitir el uso de Сookies.
Por favor, active este ajuste en su navegador, de lo contrario, no podrá iniciar sesión.