Indicadores técnicos para MetaTrader 4 - 9

El indicador muestra puntos pivotantes diarios. Es posible especificar el número de días a mostrar. Para forex no considera los datos de la sesión del domingo. Es posible modificar el color, el estilo y la anchura de cada nivel. es mejor utilizar este indicador con un marco de tiempo no superior a Н1. 4 Niveles de soporte y resistencia con también Niveles Intermedios que es posible ocultar.
FREE

La Divergencia SMT (Smart Money Technique) se refiere a la divergencia de precios entre activos correlacionados o su relación con activos inversamente correlacionados. Analizando la Divergencia SMT, los traders pueden obtener información sobre la estructura institucional del mercado e identificar si el dinero inteligente está acumulando o distribuyendo activos. Cada fluctuación de precios debe ser confirmada por la simetría del mercado, y cualquier asimetría de precios indica una Divergencia SMT

indicadores para facilitar el análisis basado en la estrategia BBMA de Oma Ally mostrando las etiquetas CSAK (CSD), CSM y Extreme en el gráfico. 1. Muestra la línea de la banda de Bollinger 2. LWMA 5-10 Máximo y mínimo 3. EMA 50 4. Fibonacci 5. MHV . área 6. Etiquetas Alert & Show BBMA consiste en el uso de 2 indicadores : Medias Móviles Bandas de Bollinger BBMA consiste en 3 tipos de entradas : Extremo MHV Re-Entrada Ajustes de Media Móvil : El sistema utiliza 5 medias móviles: 2 medias móvile
FREE
Evolucione su trading con el indicador UT Alert Bot para MQL4 El UT Alert Bot Indicator es su mejor compañero de trading, meticulosamente diseñado para darle una ventaja en el vertiginoso mundo de los mercados financieros. Impulsado por el renombrado sistema UT, esta herramienta de vanguardia combina análisis avanzados, alertas en tiempo real y funciones personalizables para garantizar que nunca pierda una oportunidad rentable. Tanto si opera con divisas, acciones, índices o materias primas, UT
FREE

Indicador ZigZag de múltiples marcos temporales. Muestra las líneas horizontales de soporte/resistencia y sus rupturas, además de dibujar los objetivos actuales del mercado. También puede mostrar líneas del indicador Fractales y velas de otros períodos (hasta Trimestral). Indicador: conecta mínimos y máximos clave para mostrar líneas de tendencia.
El indicador vuelve a dibujar el último punto (actual) y, en algunos casos, puede cambiar los últimos 2 o 3 puntos.
Todas las líneas están dibujada

Upper and Lower Reversal - Sistema de previsión temprana de momentos de inversión. Le permite encontrar puntos de inflexión de precios en los límites de los canales de movimiento de precios superior e inferior.
El indicador nunca cambiará de color ni cambiará la posición de las flechas de señal. Las flechas rojas son una señal de compra, las flechas azules son una señal de venta.
Se ajusta a cualquier marco de tiempo e instrumento comercial. El indicador no se vuelve a dibujar, sólo funciona c

ADX arrow
Este indicador muestra las señales del indicador ADX (Índice de Movimiento Direccional Promedio) como puntos en el gráfico.
Esto facilita la identificación visual de las señales. El indicador también cuenta con alertas (cuadros de mensajes emergentes) y el envío de señales al correo electrónico.
Parámetros Período -período promedio. Aplicar a-precio utilizado para los cálculos: Cerrar, Abrir, Alto, Bajo, Mediana (alto+bajo) / 2, Típico (alto + bajo + cerca) / 3, Cierre Pond

El indicador determina la dirección del movimiento del precio, calcula la posibilidad de entrar en el mercado utilizando una fórmula interna y muestra una señal de entrada de ruptura. Las señales del indicador aparecen tanto al comienzo de los movimientos de tendencia como en la dirección opuesta, lo que le permite abrir y cerrar órdenes de la manera más eficiente posible en cualquiera de las condiciones del mercado. Versión para МТ5: https://www.mql5.com/en/market/product/58980
Ventajas: una f
FREE
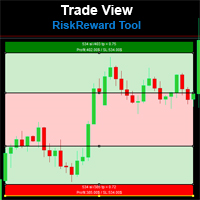
Risk Reward Tool , Es fácil de usar. Con esta herramienta se puede ver las tasas de pérdida de beneficios profit. Usted puede ver su estrategia y las ganancias recompensa estado de su cálculo goals.Double se puede hacer con una sola herramienta. Mover con arrastrar y soltar. Puede ajustar la cantidad de lote para los cálculos. Los resultados de los cálculos se muestran en la sección de comentarios. A veces puede haber errores gráficos durante los movimientos. Cálculos funciona en todas las divis
FREE

El Penta-O es un patrón armonacci de 6 puntos de retroceso que suele preceder a los grandes movimientos del mercado. Los patrones Penta-O pueden expandirse y repintarse bastante. Para facilitar las cosas este indicador implementa un giro: espera una ruptura donchiana en la dirección correcta antes de señalar la operación. El resultado final es un indicador que se repinta con una señal de operación muy fiable. El periodo de ruptura donchiana se introduce como entrada. [ Guía de instalación | Guía
FREE
Signal King: Su indicador de tendencia supremo ¿Alguna vez se ha sentido perdido en el ruido del mercado? El indicador "Signal King" se abre paso a través del caos, proporcionando señales de compra y venta claras y de alta probabilidad directamente en su gráfico. No se trata de un indicador de tendencia más, sino de una poderosa herramienta diseñada para proporcionarle una ventaja mediante la combinación de la robusta Supertendencia con un fiable filtro EMA . La Supertendencia destaca en la iden
FREE

Este indicador separa eficazmente el volumen de ticks en el mercado de divisas en categorías alcistas y bajistas.
Además, proporciona la funcionalidad de calcular y mostrar la suma de los volúmenes de ticks alcistas y bajistas para cualquier período seleccionado de su elección.
Puede ajustar fácilmente el periodo moviendo las dos líneas azules del gráfico, lo que permite un análisis de volumen personalizable y preciso adaptado a sus necesidades de negociación.
Si lo encuentra útil, ¡sus come
FREE

Gold Flux Signal – Indicador de Señales No Repaint para XAUUSD
Diseñado para una Ejecución de Señales Clara
– Gold Flux Signal fue creado para proporcionar entradas claras y estables en XAUUSD , sin repainting ni backpainting
– Diseñado específicamente para estrategias de seguimiento de tendencias y rupturas, evitando el ruido y el desorden en el gráfico
– El indicador opera completamente en velas cerradas
– Optimizado para su uso en los timeframes M1, M5 y H1
Señales Visuales Estables
– U
HTF MACD - Señales alineadas con la tendencia (una subventana, flechas en el gráfico) Qué hace
Este indicador le mantiene operando con la tendencia del marco de tiempo superior mientras usa cruces MACD para entradas precisas. En una única subventana muestra: Histograma de Tendencia HTF - verde = tendencia alcista, rojo = tendencia bajista (neutral está oculto para una vista más limpia) Líneas MACD - azul = MACD principal, naranja = señal MACD Flechas en el gráfico de precios cuando se produce u
FREE
Este programa hará más cómodo el análisis de múltiples marcos temporales.
Ayudará a sincronizar todos los gráficos en un Timeframe diferente sincronizar los gráficos para mostrar el mismo símbolo, mismo período de tiempo específico y sincronizar objetos de dibujo Mostrar en todos los gráficos al mismo tiempo
Cómo usarlo >> https://youtu.be/NEHUW7v1h1c En esta edición sólo hay 6 tipos de objetos que se pueden sincronizar todos los gráficos. Tipos de objetos de dibujo soportados: Línea vertical/
FREE

Quedan 2 copias a $65, el siguiente precio es $120
Scalper System es un indicador fácil de usar diseñado para detectar zonas de consolidación del mercado y anticipar movimientos de ruptura. Optimizado para el marco temporal M1 o M15, funciona mejor en activos altamente volátiles como el oro (XAUUSD). Aunque originalmente diseñado para el marco temporal M1 o M15, este sistema funciona bien en todos los marcos temporales gracias a su sólida estrategia basada en la acción del precio.
Puede realiza

Smart Volume Box ha sido diseñado para proporcionar a los usuarios de MetaTrader una potente herramienta analítica para descubrir la dinámica oculta del mercado. Esta herramienta de precisión, con una configuración fácil de usar, integra información esencial sobre el volumen y funciones avanzadas como el perfil de volumen, el precio medio ponderado por volumen (VWAP) y los niveles del punto de control (POC). A diferencia de los indicadores típicos, Smart Volume Box no proporciona señales comerc

¡COMPRE INDICADOR Y OBTENGA EA GRATIS COMO BONO + ALGUNOS OTROS REGALOS! INDICADOR DE NIVELES ITALO es el mejor indicador de niveles jamás creado, ¿y por qué es eso? El uso de zonas de alto volumen en el mercado y Fibonacci el indicador funciona en todos los plazos y los activos, indicador construido después de 7 años de experiencia en forex y muchos otros mercados. ¡Usted sabe que muchos indicadores de niveles alrededor de la Internet no son completos, no ayuda, y es difícil de operar, pero el

El Zig Zag 123 nos indica cuándo es más probable que se produzca una inversión o una continuación al observar el cambio en la oferta y la demanda. Cuando esto sucede, aparece un patrón característico conocido como 123 (también conocido como ABC), que a menudo rompe en dirección a un mínimo más alto o a un máximo más bajo.
Se han añadido niveles de Stop Loss y Take Profit. Hay un panel que muestra el rendimiento global de sus operaciones para si usted fuera a utilizar estos niveles de stop loss
FREE

World Trend es un indicador de tendencia híbrido, ya que se basa en las señales de indicadores elementales y en un algoritmo especial de análisis. El indicador muestra momentos favorables para entrar en el mercado. El algoritmo inteligente del indicador determina la tendencia, filtra el ruido del mercado y genera señales de entrada.
Puede utilizar el indicador como principal para determinar la tendencia. El indicador puede funcionar tanto para puntos de entrada como para filtro. Utiliza dos op

Esta es una implementación del conocido Indicador SuperTrend. Con este indicador usted puede ver exactamente los mismos valores que serán alertados por los siguientes SuperTrend Scanners:
Escáner SuperTrend Escáner SuperTrend GRATIS
Parámetros SuperTrendATRPeriod: el ajuste del periodo para el cálculo de la SuperTendencia SuperTrendMultiplier : ajuste del multiplicador para el cálculo de la SuperTendencia.
FREE
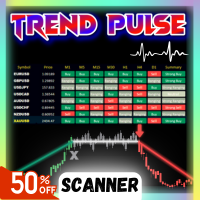
Presentamos Trend Pulse , un indicador único y robusto capaz de detectar tendencias alcistas, bajistas e incluso oscilantes. Trend Pulse utiliza un algoritmo especial para filtrar el ruido del mercado con verdadera precisión. Si el símbolo actual se está moviendo lateralmente, Trend Pulse le enviará una señal de oscilación, haciéndole saber que no es un buen momento para entrar en una operación. Este excelente sistema hace de Trend Pulse una de las mejores herramientas para los operadores.
¿Por

Este indicador dibuja automáticamente los niveles de soporte y resistencia para usted una vez que lo ha colocado en un gráfico. Reduce la molestia de dibujar y volver a dibujar estos niveles cada vez que se analizan los precios en un gráfico. Todo lo que tiene que hacer es colocarlo en un gráfico, ajustar la configuración a su gusto y dejar que el indicador haga el resto. Y aún hay más: ¡el indicador es totalmente gratuito! Consiga la nueva y mejorada versión aquí: https: //youtu.be/rTxbPOBu3nY
FREE
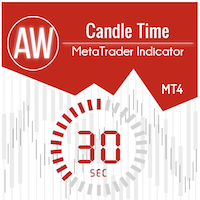
Indicador de tiempo hasta el final de la vela. Muestra el tiempo hasta el final de la vela, así como el tiempo del servidor. El texto puede mostrar la tendencia o la dirección de la vela, las notificaciones de sonido están integradas Peculiaridades:
Muestra el tiempo hasta el final de la vela actual, así como otros marcos de tiempo que se pueden ajustar o desactivar si es necesario AW Candle Time puede seleccionar la dirección de la vela o tendencia actual con el indicador AW Super Trend La est
FREE
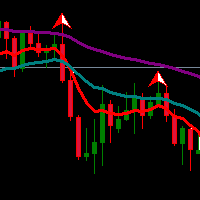
La media móvil exponencial (EMA) es un indicador que suelen utilizar los operadores. La combinación de dos o tres indicadores EMA a menudo se aplica para determinar la dirección de la tendencia. Múltiples EMA combinado con fractales o indicador oscilador para detectar sobrecompra / sobreventa y el punto de divergencia también es ideal para hacer en el sistema de comercio.
Si te gusta el indicador EMA y desea obtener un mejor indicador, muy recomendable el uso de EMA SuperTrend Estrategia Indica
FREE

Si estás utilizando Inside Bar en TradingView, donde detectar inside bars es fácil y reconfortante, pero no lo encuentras en el mercado MQL, tu búsqueda termina aquí. ¿Por qué InsideBar Highlight? Tan fácil como el ABC: Inside bars hecho simple. Nuestra herramienta se centra en el cuerpo de la vela, para que veas lo que importa sin complicaciones. Tu estilo, tu elección: ¿Te gusta colorido o todo igual? Tú decides. Descubre movimientos hacia arriba o hacia abajo sin esfuerzo. Ajusta como un guan
FREE

Una barra o vela de desequilibrio, también llamada brecha de valor justo (FVG) o ineficiencia, muestra una fuerte compra o venta en el mercado o una débil compra o venta que hace que los precios se muevan rápidamente con gran impulso. Por eso es una parte importante del análisis de la acción del precio. Nuestro indicador ofrece tres ventajas principales: Diseño claro: La barra de desequilibrio está integrada en la vela con un aspecto sencillo y limpio que facilita su detección a los operadores,
FREE
Una implementación personal del famoso indicador de bandas de Bollinger como mecanismo de seguimiento de tendencia, que utiliza una media móvil y la desviación estándar para definir qué es una tendencia y cuándo cambia. Las bandas de Bollinger se utilizan normalmente sólo como un indicador de sobreventa/sobrecompra, pero en mi opinión, el enfoque de trading es más completo utilizando la variante de tendencia como estrategia de salida. [ Guía de instalación | Guía de actualización | Solución de p
FREE

Este indicador es una herramienta interactiva de etiquetado de Ondas de Elliott para MetaTrader 4 y 5.
Permite al usuario colocar manualmente etiquetas de ondas directamente en el gráfico, seleccionando el tamaño de la etiqueta, el color y el tipo de onda (correcciones ABC, impulsos de cinco ondas o estructuras WXY) desde un menú en el gráfico.
Con un solo clic en el gráfico, el indicador coloca de forma secuencial las etiquetas de ondas correspondientes en el precio y el tiempo elegidos, ayudan
FREE

Nuestro innovador Panel Básico de Patrones de Velas está diseñado específicamente para identificar patrones de velas rentables en el gráfico de forma automática. Este panel utiliza algoritmos avanzados para escanear los gráficos de precios en tiempo real y detectar una amplia gama de patrones de velas, desde los más clásicos hasta los más complejos. Además, tiene una interfaz fácil de usar que le permite visualizar los patrones detectados en diferentes marcos de tiempo, por lo que es fácil tomar

Detect strength for uptrends and downtrends by tracking Buy Power and Sell Power. Stay on the right side of the market by being able to determine whether the market is in a bull or bear trend and how strong the trend is.
Free download for a limited time! We hope you enjoy, with our very best wishes during this pandemic!
El objetivo de Trend Trigger Factor es aprovechar los movimientos laterales y, al mismo tiempo, situar al operador en el lado correcto del mercado para captar las grandes tend
FREE

BeST Oscillators Collection es un indicador compuesto de MT4 que incluye los osciladores Chaikin, Chande y TRIX que por defecto están contenidos en MT5 pero no en la plataforma MT4. También proporciona la opción de mostrar o no un Mov. Avg. como Línea de Señal y las Señales resultantes como Flechas en Modo Normal (todas las flechas) o en Modo Inverso (sin mostrar ninguna flecha resultante sucesiva y del mismo tipo). Analíticamente para cada uno de los Osciladores específicos: El Oscilador Chaiki
FREE

Indicador Market Profile 3 MetaTrader 4 - es una implementación clásica de Market Profile que puede mostrar la densidad de precios a lo largo del tiempo, destacando los niveles de precios más importantes, el área de valor y el valor de control de una sesión de negociación determinada. Este indicador puede adjuntarse a marcos temporales entre M1 y D1 y mostrará el Perfil de Mercado para sesiones diarias, semanales, mensuales o incluso intradía. Los plazos inferiores ofrecen una mayor precisión. L
FREE

Un indicador Fibonacci se utiliza mejor con otros indicadores como Pivotes, Soporte/Resistencia, etc. El precio tiende a utilizar los niveles de Fibo como líneas de Soporte o Resistencia. Por lo tanto, este indicador es muy útil para saber cuándo el precio podría revertirse o si se cruza un nivel, el precio podría continuar la tendencia. También para encontrar las mejores líneas de Take Profit y StopLoss. No utilice el indicador Fibo solo para operar, ya que no siempre es preciso. Utilícelo para
FREE
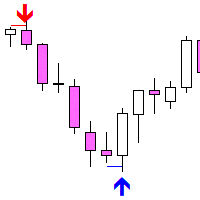
Fakey Detector - Indicador de falsa ruptura (Fakey) Fakey Detector es un indicador que detecta automáticamente el clásico patrón Fakey (falsa ruptura de una barra interior) de Price Action y lo muestra en el gráfico mediante una flecha y un nivel de ruptura. Cómo funciona: El patrón Fakey consta de tres velas: Mother Bar - la más grande por rango Inside Bar - totalmente contenida dentro del rango de la Mother Bar. Fakey Candle - rompe (al alza o a la baja), pero luego cierra de nuevo dentro de
FREE

El indicador dibuja la escala de tiempo en el gráfico. Puede especificar el desfase horario, ajustar el tamaño y el tipo de letra que se mostrará en el gráfico (mostrará su hora local en el gráfico en lugar de la hora MT). También puede seleccionar el formato deseado para mostrar la fecha y la hora. Mientras mantiene pulsado el botón central del ratón y mueve el cursor, aparecerá un control deslizante en la escala. Puede estar interesado en mi otro producto , que contiene una versión más avanza
FREE
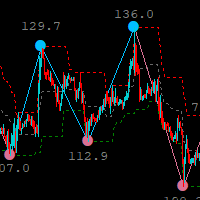
Basado en el indicador de zigzag, el indicador de canal alto-bajo en zigzag es una herramienta para alertar al operador sobre un cambio de tendencia, es de gran utilidad
Como dará una alerta temprana de un cambio en la tendencia actual, el indicador tiene una opción de marco de tiempo múltiple para operar con marcos de tiempo más altos o más bajos.
canal en el período de tiempo actual, este indicador es un complemento a su sistema/estrategia y puede usarse de forma independiente para operar, per
FREE

El indicador Bitcoin Trader Pro es una herramienta avanzada diseñada específicamente para analizar el mercado de criptodivisas, con especial atención al par BTCUSD. Este indicador combina múltiples métodos de análisis técnico para generar señales de trading precisas y fiables. Perfecto tanto para traders principiantes como experimentados, el Indicador Bitcoin Trader Pro proporciona todo lo necesario para tomar decisiones de trading informadas. Mis indicadores gratis. Sólo te pido que dejes tus
FREE

El Candle Power Pro es una herramienta comercial sofisticada diseñada para decodificar Presión del volumen real, desequilibrios en los datos de ticks y dinámica del flujo de órdenes institucionales midiendo la batalla entre las garrapatas del toro y las garrapatas del oso en tiempo real. Este indicador transforma los datos brutos datos de volumen en información procesable , lo que ayuda a los operadores a identificar Movimientos de dinero inteli

¿Tenía una operación rentable pero de repente se invirtió? En una estrategia sólida, salir de una operación es tan importante como entrar.
Exit EDGE le ayuda a maximizar el beneficio de su operación actual y a evitar que las operaciones ganadoras se conviertan en perdedoras.
No vuelva a perder una señal de salida
Supervise todos los pares y marcos temporales en un solo gráfico www.mql5.com/en/blogs/post/726558
Cómo operar Puede cerrar sus operaciones abiertas tan pronto como reciba una seña
Optimiza tu análisis de trading con el Day and Week Separator MT4, una herramienta intuitiva diseñada para trazar líneas separadoras diarias y semanales personalizables, perfecta para traders que enfrentan diferencias de zonas horarias con sus brokers. Muy apreciada en comunidades de trading como Forex Factory y Reddit’s r/Forex por su simplicidad y eficacia, este indicador aborda el desafío común de alinear los marcos temporales de los gráficos con horarios locales o específicos del mercado, co
FREE

Gama UR (impulsado por cálculos similares que se encuentran en los sistemas de aprendizaje automático)
UR Gamma es una herramienta de análisis financiero de vanguardia que ofrece una versión nueva y mejorada del indicador clásico WaveTrend. Al incorporar técnicas avanzadas de procesamiento de señales digitales, UR Gamma aborda algunas de las limitaciones de los algoritmos WaveTrend tradicionales y brinda un enfoque más preciso, sólido y dinámico para identificar y medir tendencias en la acción
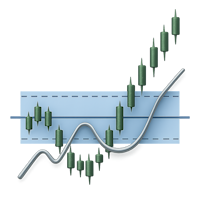
PriceDensity - Indicador profesional de densidad de precios para la detección precisa de niveles de mercado PriceDensity es un indicador inteligente, no basado en volúmenes, que analiza la acción histórica de los precios para determinar los niveles de precios clave con mayor frecuencia de ocurrencia . Detecta automáticamente dónde ha pasado el mercado la mayor parte del tiempo, revelando zonas ocultas de soporte y resistencia basadas en el comportamiento real del mercado, no en dibujos subjetivo

Indicador de estructura de mercado para visualizar Break of Structure (BOS) y barridos de liquidez basados en price action. Solo para fines de análisis. BOS Liquidity Sweep – Indicador de estructura de mercado (MT4) Este indicador visualiza Break of Structure (BOS) y barridos de liquidez directamente en el gráfico utilizando price action puro y análisis de estructura de mercado. Está diseñado como una herramienta de análisis visual y no ejecuta operaciones automáticamente. Concepto Los merca
FREE
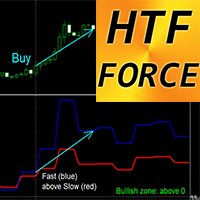
Indicador Crypto_Forex HTF Force Oscilador para MT4.
- HTF Force es un potente indicador para operar en múltiples marcos temporales. HTF significa Marco Temporal Superior. - El índice Force es uno de los principales indicadores que combina datos de precio y volumen en un único valor. - Los valores del marco temporal superior pueden mostrar la dirección de la tendencia (tendencia bajista: por debajo de 0; tendencia alcista: por encima de 0). - Indicador de Fuerza Rápida: línea azul; Indicador d
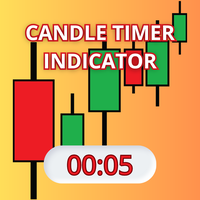
Candle Timer Indicator es una herramienta personalizada diseñada para la plataforma de operaciones MetaTrader 4 (MQL4) . Su propósito principal es mostrar un temporizador en movimiento en el gráfico , indicando el tiempo restante antes de que la vela actual se cierre. en el gráfico, indicando el tiempo rest ante antes del cierre de la vela actual . Esta característica es particularmente útil para los operadores que necesitan un seguimiento preciso de los tiempos de cierre de las velas para sus e
FREE

Katana_Price_Action Descripción del producto [Nombre del producto] (Introduzca el nombre seguro que haya elegido, por ejemplo, Sistema de comercio Katana) Concepto: Vuelta a las raíces - La "Pure KATANA " Este producto es la "Pure KATANA" , creada eliminando todas las características innecesarias para volver a la esencia de la serie KATANA. Aunque hemos evolucionado continuamente la serie incorporando los comentarios de muchos operadores, con el tiempo el sistema se volvió demasiado complejo.

Pips Hunter PRO ha sido desarrollado durante varios años y es una versión mejorada de su predecesor. Este poderoso indicador analiza el mercado y el histórico de precios para generar entradas de compra y venta. Para el cálculo de estas entradas utiliza diferentes indicadores que funcionan en conjunto así como un complejo logaritmo estadístico que filtra las entradas menos favorables y las elimina / Versión MT5 .
Características No repinta
Este indicador no cambia sus valores cuando llegan nue
FREE

Necesario para los operadores: herramientas e indicadores Ondas calcular automáticamente los indicadores, el comercio de tendencia del canal Perfecta tendencia de onda de cálculo automático de cálculo de canales , MT4 Perfecta tendencia de onda de cálculo automático de cálculo de canales , MT5 Copia de comercio local Copia fácil y rápida , MT4 Copia fácil y rápida , MT5 Copia Local Trading Para DEMO Copia fácil y rápida , MT4 DEMO Copia Fácil y Rápida , MT5 DEMO 砖图Renko PRO->>>
La visualizació
FREE

Indicador de Patrón de Cabeza y Hombros - Su Clave para Reconocer los Cambios de Tendencia Libere el poder del reconocimiento de patrones con el "Indicador de Patrón de Cabeza y Hombros". Esta herramienta de vanguardia, diseñada para MetaTrader, es su aliado de confianza para identificar uno de los patrones gráficos más poderosos del análisis técnico. Tanto si es un principiante como un trader experimentado, este indicador simplifica el proceso de detectar el patrón Cabeza y Hombros, permitiéndo
FREE
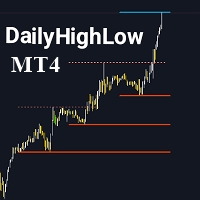
Por favor, no olvides calificar el indicador para ayudarme con la visibilidad. El indicador DailyHighLow está diseñado específicamente para la plataforma MetaTrader 4 (MT4) y tiene como objetivo ayudar a los traders a seguir las fluctuaciones diarias de precios. Este indicador traza automáticamente líneas de tendencia basadas en los precios más altos y más bajos de un período personalizado, proporcionando una asistencia visual clara para los traders que necesitan información precisa del mercado
FREE
Tipu RSI Características 28 símbolos, multi-marco de tiempo de gran alcance Dashboard para la vista completa del mercado Alertas personalizables de compra/venta, alertas push, alertas por correo electrónico y alertas visuales en pantalla. Niveles de sobrecompra y sobreventa marcados. RSI de tres colores que marca los niveles de normalidad, sobreventa y sobrecompra. El índice de fuerza relativa (RSI) es un oscilador ideado por J. Welles Wilder en su famoso libro New Concepts in Technical Trading
FREE

Descripción: Este indicador dibujar ZigZag Line en múltiples marco de tiempo también la búsqueda de patrones armónicos antes de la finalización del patrón.
Características: Cinco instancias de indicadores ZigZag se pueden configurar para cualquier marco de tiempo deseado y entradas. Dibuja patrones armónicos antes de la finalización del patrón. Muestra las relaciones de retroceso de Fibonacci. Ratios de retroceso de Fibonacci configurables. Dibuja AB=CD basado en el retroceso Fibonacci que us
FREE
Este es un Multi par y Multi marco de tiempo tablero de instrumentos. El fundador del sistema es el Sr. Oma Ally, que es un sistema basado en Bollinger Band y Moving Average(BBMA). BBMA consiste en el uso de 2 indicadores: Medias Móviles Bandas de Bollinger BBMA consta de 3 tipos de entradas: Extremo MHV Reentrada Rechazo EMA50 Este tablero le ayuda a escanear Extreme actual, la configuración de reentrada, EMA50 de rechazo y también MHV Cómo leer las señales:
encontrar el mismo color en 3 difer
FREE

Objetivo: Notificar/alertar a los operadores si el precio tocó o cerró por encima/debajo de la media móvil. Características/Configuración: Método de media móvil soportado: Simple, Exponencial, Suavizada y Lineal Ponderada. Funciona con todos los pares de divisas. Establezca el valor del periodo/desplazamiento de la media móvil Plazos admitidos: 1m, 5m 15m, 30m, 1H, 4H, 1D, 1WK, 1Mo Establezca el Precio Aplicado: Cierre, Apertura, Máximo, Mínimo, Precio, etc. Establezca el Tipo de Tamaño de la V
Características principales del indicador: Señales de Compra y Venta: El indicador genera señales de compra y venta basadas en condiciones específicas. Utiliza el cruce de la Media Móvil Rápida (MA Rápida) y la Media Móvil Lenta (MA Lenta) para determinar las entradas en el mercado. El RSI (Relative Strength Index) se utiliza para identificar señales de compra cuando el RSI está por encima de 50 y por debajo de 75. También considera los niveles de soporte y resistencia para una confirmación adic
FREE

Este indicador ayuda a marcar el máximo y mínimo de la sesión de Asia, Londres, Nueva York, con la hora de ajuste personalizado
Este indicador está configurado para contar a partir de velas minuto por lo que se moverá con el mercado actual y se detendrá en la hora designada y crear una línea precisa para el día.
a continuación es la personalización que se puede ajustar :
Descripciones de entrada EnableAsian Habilita o deshabilita la visualización de los niveles máximos y mínimos de la ses
FREE

¡AL FINAL! ¡Un indicador estocástico para MT4 que muestra múltiples marcos de tiempo en un gráfico! Vea la posición real de las líneas principal y de señal en 4 marcos de tiempo separados al instante para ayudarlo a tomar decisiones comerciales informadas.
Un verdadero indicador estocástico de MTF para los operadores que necesitan ver visualmente lo que el indicador les dice en varios períodos de tiempo, sin flechas que solo apunten hacia arriba o hacia abajo o se muestren los números. ¡No más
FREE
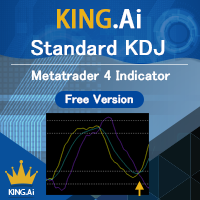
El indicador KDJ estándar es el presentado por KING.Ai. Este indicador se construyeron base en la teoría de la KDJ . KDJ es una estrategia muy eficaz y útil para el comercio, especialmente en el comercio swing. Método a aplicar (por favor, consulte también el gráfico): Regla 80/20: Precio de abajo hacia arriba 20 a 80. Y el precio de arriba a abajo 80 a 20. Ambos son señales de entrada al mercado. Periodo del indicador: El indicador se hace por el período de 9,3,3 KING.Ai Forex cree que esta es
FREE
Se trata de un potente indicador de ruptura con conocimiento de la sesión, diseñado para operadores serios que disfrutan con la volatilidad y la estructura. Diseñado para la precisión, identifica zonas de ruptura de alta probabilidad durante las sesiones de negociación de Londres y Nueva York , donde el mercado se mueve con intención. Características principales: Detección del rango de la sesión
Detecta y destaca automáticamente el rango de precios clave de las sesiones de Londres y Nueva York.
FREE
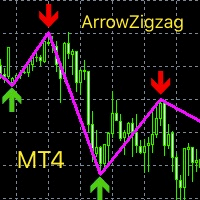
Este índice se basa en el desarrollo secundario de zigzag, añadiendo indicación de flecha de punto alto y bajo, engrosando la línea y cambiando el color. Puede ser una buena visualización de las señales de negociación de admisión actual, largo o corto actual. Se puede combinar con otros indicadores para determinar el punto de negociación, que tiene un gran valor de referencia. En comparación con el índice de tendencia general o el estándar de lote de oscilación, la determinación precisa es mayor
FREE

Este indicador personalizado lo diseñé para Metatrader 4 para poder identificar fácilmente la hora estándar del este (hora local de Nueva York) desde cualquier servidor de metatrader 4. Pero puede usar esto para identificar su hora local cambiando la zona horaria en el menú desplegable. Le permite agregar una línea vertical de cualquier color a cualquier hora en particular en la zona horaria seleccionada de su elección. Le permite agregar líneas horizontales de cálculo automático de apertura, m
FREE

Pipfinite crea herramientas de trading únicas, de alta calidad y asequibles. Nuestras herramientas pueden o no funcionar para usted, por lo que le sugerimos encarecidamente que pruebe primero la versión demo para MT4. Por favor, pruebe el indicador antes de comprarlo para determinar si funciona para usted. Queremos tus buenas críticas, así que date prisa y pruébalo gratis... esperamos que lo encuentres útil.
Combo Rasuradora con Láser Trend Estrategia: Scalp en la dirección de la tendencia Ver
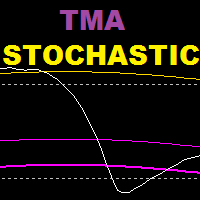
TMA Stochastic es un indicador basado en un oscilador estocástico y un indicador de bandas tma, este indicador se basa en una estrategia de reversión.
Periodo de tiempo recomendado: 15 años y más
Configuraciones recomendadas: valores más bajos para especulación, valores más altos para swing trading
==================================================== ======================
Parámetros:
Historial de tma: cuántas barras retroceden para mostrar las bandas de tma en el estocástico
Período K (e
FREE

Este indicador ha sido creado para encontrar los probables puntos de reversión del precio del símbolo. En su funcionamiento se utiliza un patrón de inversión de velas pequeñas junto con un filtro de extremos. El indicador no se redibuja. Si el filtro de extremos está desactivado, el indicador muestra todos los puntos que tienen un patrón. Si el filtro de extremos está activado, la condición funciona - si el historial de velas de barras anteriores 1 contiene velas más altas y están más lejos que
FREE

MQLTA Support Resistance Lines es un indicador que calcula los niveles históricos de Soporte y Resistencia y los muestra como Líneas en el gráfico. También le avisará si el precio está en una zona segura o peligrosa para operar y le mostrará la distancia hasta el siguiente nivel. El indicador es ideal para ser utilizado en otros Expert Advisor a través de la función iCustom. Este indicador se puede probar EN VIVO en AUDNZD con la siguiente DEMO https://www.mql5.com/en/market/product/26572
¿Cómo
FREE
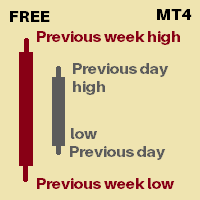
Es un indicador que le mostrará
Máximo del día anterior Mínimo del día anterior Máximo de la semana anterior Mínimo de la semana anterior Usted puede fijar cuántos días de historia usted quisiera ver para el día anterior alto bajo y la semana anterior alta baja Actualmente se marcarán 30 días de PDH/L Se marcarán 4 semanas de PWH/L Puede cambiarlo desde los ajustes del indicador. Las fechas se muestran en las líneas de marcado para identificar a qué fecha pertenece ese marcado.
Gracias :) Siemp
FREE

Tipu Heikin-Ashi Panel es la versión modificada del indicador original Heiken Ashi publicado por MetaQuotes aquí . Una versión profesional de este indicador está disponible aquí .
Características Un Panel fácil de usar que muestra la tendencia Heiken Ashi del marco de tiempo seleccionado. Alertas personalizables de Compra/Venta, alertas push, alertas por email, o alertas visuales en pantalla. Panel Personalizable. El panel puede moverse a cualquier lugar del gráfico o minimizarse para disponer
FREE

El indicador muestra perfiles de volumen basados en el principio de anidamiento. Los periodos de los perfiles están preestablecidos de modo que cada perfil subsiguiente tiene una longitud dos veces mayor que la longitud del perfil anterior. Además de los perfiles, el indicador muestra grupos de volúmenes ordenados por colores, en función del volumen que contienen.
Características de funcionamiento del indicador El indicador funciona en marcos temporales típicos de M5 a MN, pero para los cálcul
FREE
Keltner Señales Pro: ¡Comercie más inteligentemente, gane más! Keltner Signals Pro Ahora disponible en formato EA. Descárguelo ahora. Aumente la precisión de sus operaciones y elimine las señales falsas con Keltner Signals Pro, el indicador avanzado e intuitivo diseñado para operadores serios que buscan beneficios constantes. ¿Cansado de señales engañosas? Keltner Signals Pro combina magistralmente el poder de los Canales de Keltner para identificar rupturas de precios cruciales con un insuperab
FREE
MetaTrader Market - robots comerciales e indicadores técnicos para los trádres, disponibles directamente en el terminal.
El sistema de pago MQL5.community ha sido desarrollado para los Servicios de la plataforma MetaTrader y está disponible automáticamente para todos los usuarios registrados en el sitio web MQL5.com. Puede depositar y retirar el dinero a través de WebMoney, PayPal y tarjetas bancarias.
Está perdiendo oportunidades comerciales:
- Aplicaciones de trading gratuitas
- 8 000+ señales para copiar
- Noticias económicas para analizar los mercados financieros
Registro
Entrada
Si no tiene cuenta de usuario, regístrese
Para iniciar sesión y usar el sitio web MQL5.com es necesario permitir el uso de Сookies.
Por favor, active este ajuste en su navegador, de lo contrario, no podrá iniciar sesión.