Indicadores técnicos para MetaTrader 4 - 31

El propósito de esta nueva versión del indicador estándar de MT4 proporcionado en su plataforma es mostrar en una sub-ventana múltiples marcos temporales del mismo indicador. Vea el ejemplo que se muestra en la imagen de abajo. Pero la visualización no es como un simple indicador MTF. Esta es la visualización real del indicador en su marco de tiempo. Aquí están las opciones disponibles en el indicador FFx: Seleccione los marcos de tiempo a mostrar (M1 a Mensual) Definir el ancho (número de barra
FREE

Entrada equilibrada por VArmadA
Un simple pero poderoso indicador de soporte/resistencia basado en un fractal
Funciona con marcos de tiempo 1H y superiores y probado en todos los pares principales. Preste atención a la señal: Una flecha que indica una entrada larga o corta.
Cómo funciona:
Las flechas indican soporte/resistencia invertida. La flecha hacia arriba significa largo - la flecha hacia abajo indica una operación corta.
Instrucciones:
- Indicador Largo/Indicador Corto: Elija los c
FREE
Se trata de un indicador de propósito general que muestra líneas de color en intervalos de precios fijos y personalizables, introducidos como parámetros. Ofrece intervalos de precios universales, constantes y familiares que permiten un análisis de precios rápido y preciso de un par de divisas. Con los parámetros por defecto, este indicador implementa La Teoría de los Cuartos , como fue descrita originalmente por Ilian Yotov . [ Guía de instalación | Guía de actualización | Solución de problemas
FREE

El indicador mide volúmenes en diferentes gráficos e instrumentos. Su principal ventaja es la posibilidad de comparar distintos brokers. Cuanto menos Volumen Medio y Tick / Segundo , más fiable es el broker. Hay un comentario en la esquina superior izquierda Datos del comentario: Tick/Segundo - número de ticks por segundo para un instrumento seleccionado Middle Volume - volúmenes medios en la penúltima barra Este indicador permite realizar un seguimiento relativo de la actividad del mercado para
FREE
Descripción del producto: BBMA Dashboard Guide BBMA Dashboard Guide es un indicador basado en BBMA diseñado para ayudar a los operadores a monitorear la estructura del mercado en todos los marcos de tiempo - desde MN1 hasta M1 - en un tablero limpio e interactivo. Con esta herramienta, ya no tendrá que alternar entre varios gráficos. Toda la información clave se muestra en un cuadro de mandos único y fácil de leer . Características principales: E structura Multi-Timeframe
Visualice instan

Título del producto Smart Awesome (MT4) – parte de la serie SmartView Indicators Descripción breve Indicador Awesome con una experiencia de usuario única en la plataforma MetaTrader. Ofrece capacidades avanzadas no disponibles anteriormente, como abrir configuraciones con doble clic, ocultar y mostrar indicadores sin eliminarlos, y mostrar la ventana del indicador a tamaño completo del gráfico. Diseñado para funcionar perfectamente con el resto de la serie SmartView Indicators. Visión general La
FREE

Título del producto Smart CCI (MT4) – parte de la serie SmartView Indicators Descripción breve Indicador CCI con una experiencia de usuario única en la plataforma MetaTrader. Ofrece capacidades avanzadas no disponibles anteriormente, como abrir configuraciones con doble clic, ocultar y mostrar indicadores sin eliminarlos, y mostrar la ventana del indicador a tamaño completo del gráfico. Diseñado para funcionar perfectamente con el resto de la serie SmartView Indicators. Visión general La serie S
FREE

Título del Producto Clean Fractal Pro — Indicador RSI Fractal Bias: Señales de Precisión con Ventaja H4 Desbloquea operaciones de alta probabilidad en gráficos M30 con este potente indicador sin repintado . Combina: Sesgo RSI H4 (>50 para alcista, <50 para bajista) para filtrar tendencias mayores. SMA de 20 periodos (Precio Típico) para soporte/resistencia dinámico. Momento RSI M30 (por encima de 40 para compras, por debajo de 60 para ventas) para cronometrar entradas. Confirmación Fractal (f
Presentación de Quantum Signal Pro: Su ventaja en el mercado ¿Está cansado de cuestionar sus decisiones de inversión? ¿Desearía tener una forma más clara y precisa de detectar las tendencias del mercado y los posibles retrocesos? No busque más! Quantum Signal Pro está aquí para transformar su experiencia de trading, ofreciéndole un sistema sofisticado pero fácil de entender que atraviesa el ruido del mercado para ofrecerle información procesable. Imagínese tener un socio de confianza que le guía
FREE

Este indicador identifica velas pinbar en el gráfico y muestra una flecha como señal de operación basada en el patrón de la vela. Ofrece funciones fáciles de usar, como notificaciones push y otros tipos de alertas. Es muy eficaz para identificar puntos de entrada o posibles retrocesos a precios superiores o inferiores. Además, funciona en cualquier marco temporal.
FREE

Visor de calendario económico
Este lector de eventos económicos está adaptado para cargar datos desde un fichero csv. Usted mismo puede preparar el fichero csv según esta plantilla, puede hacerlo en el bloc de notas o en csved. El archivo debe llamarse normalmente Calendario-MM-DD-AAAA.csv. Y contener líneas con cabeceras de columnas de datos según este ejemplo. En la columna Impacto, es decir, repercusión en el mercado en función de la importancia del acontecimiento, los nombres aceptados des
FREE

Presentamos Force Jurik, un potente indicador diseñado para mejorar el conocimiento de las operaciones mediante la combinación de medias móviles personalizadas basadas en Jurik con el indicador Force Index de MetaTrader 4.
Las medias móviles Jurik son famosas por su precisión y suavidad, lo que las hace ideales para analizar los movimientos de precios en el mercado de divisas. Ofrecen a los operadores un método fiable para identificar tendencias y filtrar el ruido del mercado, proporcionando e
FREE
Este indicador permite ocultar Fractales Bill Williams (en todos los timeframes de MT4) a partir de una fecha definida por el usuario con una línea vertical (Solo) o un panel (con "Velas Ocultas"). Entradas del Indicador: Color del Indicador Ancho del Indicador Información sobre el indicador "Fractales" está disponible aquí: https: //www.metatrader4.com/en/trading-platform/help/analytics/tech_indicators/fractals ************************************************************* Somos una comunidad y
FREE
¡Mejora tu experiencia de trading con el indicador Your Chart! Esta herramienta gratuita y altamente personalizable permite a los traders combinar múltiples marcos temporales en una única visualización limpia de velas sin alterar el gráfico original. Con Your Chart, puedes ajustar el número de barras por cada vela personalizada. Por ejemplo, combina cada 18 velas M1 en una sola para tener una visión más amplia de las tendencias del mercado. Características clave: Formación de velas personalizada
FREE
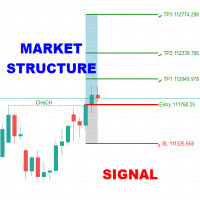
El indicador Market Structure Signal está diseñado para detectar cambios de carácter (CHoCH) y rupturas de estructura (BOS) en la acción del precio, ayudando a los operadores a identificar posibles cambios o continuaciones de tendencia. Combina el análisis de la estructura del mercado con la volatilidad (ATR) para destacar posibles zonas de riesgo/recompensa, al tiempo que admite alertas multicanal para que no se pierda ninguna señal de negociación. Interpretación Análisis de tendencias : La col

Este indicador calcula y dibuja líneas sobre el gráfico. Existen dos tipos de tendencias: Tendencia A: la línea se dibuja utilizando los mínimos locales para las tendencias alcistas y los máximos locales para las tendencias bajistas. Tendencia B: la línea se dibuja utilizando los máximos locales para las tendencias alcistas y los mínimos locales para las tendencias bajistas. Existen algunas condiciones que deben cumplirse y que pueden modificarse mediante los parámetros (véase también la imagen
FREE

El indicador Multi-Timeframe High Low Points (MTF High Low Points) es una poderosa herramienta para los operadores que utilizan MetaTrader 4 (MT4) para analizar los movimientos de precios a través de diferentes marcos de tiempo. Este versátil indicador ayuda a los operadores a identificar niveles significativos de soporte y resistencia mostrando los puntos de precio más alto y más bajo dentro de un número especificado de barras en múltiples marcos temporales simultáneamente. Características prin
FREE

Este indicador calcula gann precios de soporte y resistencia con el uso gann pirámide formulación y dibujar en el gráfico. Y si lo desea, el indicador puede alertarle cuando el precio actual llegue a estos niveles de pivote. Opciones de Alerta: Enviar Mensaje Móvil, Enviar E-mail, Mostrar Mensaje y Alerta Sonora Niveles: S1, S2, S3, S4, S5, R1, R2, R3, R4, R5 Entradas: GannInputPrice: Precio de entrada para la formulación piramidal de gann. GannInputDigit: Cuántos dígitos desea utilizar para la
FREE

El M.O.D.E significa "Multiple Oscillator Divergence Exit ". Es un indicador que señala una divergencia entre el precio, y múltiples osciladores. Inicialmente es un indicador de salida porque señala el debilitamiento de una tendencia, pero podría ser utilizado como una señal de entrada si se utiliza analíticamente. Características principales: Comprueba muchas divergencias a la vez No repinta Envía Alertas y Notificaciones Push Puedes cargar el M.O.D.E en un solo gráfico, y ser capaz de ver las
FREE

Las Bandas Bolliger On-Off le permiten controlar el indicador utilizando el teclado o un botón . Usted puede elegir si desea que el indicador siempre se muestra o siempre oculta al cambiar entre diferentes marcos de tiempo o instrumentos financieros . ---> Este indicador es parte del Combo Indicador OnOff
Las Bandas de Bollinger identifican el grado de volatilidad en tiempo real de un instrumento financiero . Una amplitud menor corresponde a una volatilidad baja, por el contrario, una banda ma
FREE

Momento de operar El indicador del momento oportuno para operar se basa en la volatilidad del mercado a través de 2 indicadores ATR para determinar el momento oportuno de una operación. El indicador determina los momentos en que el mercado tiene una fuerte volatilidad en la tendencia. Cuando el histograma es mayor que 0 (azul) es un mercado fuerte, cuando el histograma es menor que 0 (amarillo) es un mercado débil. Sólo se debe operar dentro de histogramas superiores a 0. Basado en el gráfico de
FREE
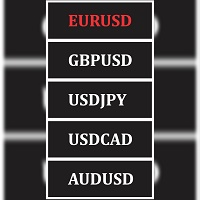
Cambie sin problemas entre diferentes pares desde una ventana, manteniendo su plantilla de gráfico actual en todos los pares. Estas herramientas simplemente obtienen todos los pares en su ventana de vigilancia del mercado y le conceden la facilidad de cambiar entre ellos desde una ventana, manteniendo su configuración de gráfico actual y todos los indicadores cargados y objetos de gráfico a través de todos los pares disponibles en su ventana de vigilancia del mercado.
FREE
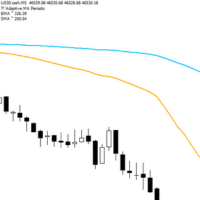
Adaptive Flow MAs es un indicador de media móvil diseñado para ajustarse de forma natural a los movimientos del mercado. A diferencia de las medias tradicionales, adapta dinámicamente sus periodos en función de la volatilidad reciente y la tendencia actual. La EMA sigue de cerca las rápidas oscilaciones de los precios para captar cada impulso, mientras que la SMA se mantiene más suave, proporcionando una referencia estable y fiable. Con una pantalla limpia que muestra los periodos adaptativos a
FREE
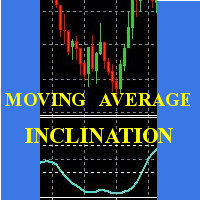
Scalp utilizando el comportamiento de una media móvil corta, el indicador da la pendiente e identifica los momentos "hiper".
Consejo operativo:
Utilizar gráfico M1 . Periodo 20 : abrir comprar después de dos mínimos crecientes; vender después de dos máximos decrecientes; evitar aperturas contra tendencia; cuando la línea se pone plana poner un stop en el precio de apertura. Evitar acciones en periodos de baja volatilidad. Cuando la curva que dibuja el min / max es muy plana, es mejor posponer
FREE
Cuadro de mandos dinámico para MT4 Este potente cuadro de mandos de MT4 ofrece a los operadores una visión completa del rendimiento actual e histórico de las operaciones en un formato intuitivo y visualmente organizado. Con su diseño de ingeniería de precisión, el panel proporciona una mezcla perfecta de información en tiempo real y análisis histórico. Este panel de control es perfecto para los operadores meticulosos que buscan una herramienta precisa y completa para gestionar las posiciones abi
FREE
El indicador determina las zonas de sobrecompra/sobreventa en varios plazos. Las flechas muestran la tendencia del mercado en varias sesiones temporales: si el mercado sale de la zona de sobrecompra, la flecha indicará una tendencia ascendente (flecha hacia arriba), si el mercado sale de la zona de sobreventa, la flecha indicará una tendencia descendente (flecha hacia abajo). La situación en el marco temporal, donde se encuentra el indicador, se muestra en la ventana inferior derecha. En la vent
FREE
El indicador Trend Reversal es una herramienta técnica diseñada para identificar posibles cambios de tendencia en el mercado, basándose en la formación de barras . Es especialmente eficaz en marcos temporales como el H1 (horario) , donde los patrones de inversión tienden a ser más fiables. El indicador señala los cambios de tendencia dibujando un punto rojo para indicar una posible tendencia bajista y un punto verde para una posible tendencia alcista. Cómo funciona el indicador El indicador anal
FREE

Sweeper PRO – Detector Avanzado de Barridos de Velas (3 en 1) Descripción General Sweeper PRO es un indicador potente y totalmente personalizable diseñado para detectar tres tipos únicos de barridos de velas — patrones inteligentes de entrada y reversión comúnmente utilizados por traders profesionales de acción del precio.
Identifica automáticamente posibles falsas rupturas, capturas de liquidez y señales de continuación , ayudándote a anticipar los giros del mercado y confirmar movimiento

Este indicador nos señala la tendencia o direccion del mercado y un posible stop loss
Está indicador trabaja con dos parámetros, período y multiplicador. Las señales de compra y venta se generan cuando el indicador cruza el precio de cierre y este cambia de color.
Este indicador se usa en todo tipo de mercados como acciones, futuros, forex, criptos, adicionalmente se puede usar en difentes temporalidades horas, diario, semanal etc.
se recomienda no usarlo mientras el mercado este lateral, e
FREE

Indicador de Tamaño de Lote Descubre el tamaño adecuado de lote para utilizar en tus operaciones basado en el margen disponible. Este indicador proporciona información valiosa para la gestión del riesgo. Si el indicador muestra un valor de 0, significa que tu saldo o margen disponible es insuficiente para operar. Es importante mantener niveles de margen adecuados para prácticas de trading seguras. Este indicador está diseñado exclusivamente para la plataforma MT4, una plataforma de trading popul
FREE

El indicador muestra el número máximo y mínimo de lotes, así como el tamaño del spread del símbolo.
Esta información es necesaria para tomar una decisión rápida de ingresar al mercado en base al depósito máximo, con el fin de lograr ganancias rápidas y grandes. Se calcula sobre la base de los fondos disponibles y los fondos para abrir un lote.
Tales situaciones ocurren a menudo cuando participa en varios concursos de Forex o opera en el mercado con los medios máximos posibles, así como para l
FREE

Diseñado para marcar un precio específico y un punto temporal en un gráfico MT4 con un solo clic del ratón, sincronizando estos datos en todos los marcos temporales para el mismo símbolo. Su objetivo principal es ayudar a los operadores a localizar y seguir niveles o eventos críticos (por ejemplo, puntos de soporte/resistencia o de entrada) con marcadores visuales persistentes. El indicador utiliza líneas discontinuas para las referencias cruzadas de precio y tiempo, acompañadas de etiquetas que
FREE

Mega Indicador de Nivel de Alerta: Una herramienta sencilla pero valiosa El indicador Mega Alert Level proporciona notificaciones sonoras, informativas, push y por correo electrónico cuando el precio de un par de divisas toca o se aproxima a los niveles estándar de soporte y resistencia, así como a cualquier otro objeto del gráfico que seleccione. Características: Notificaciones: Personalice las notificaciones según sus preferencias: elija entre Correo electrónico, Ventana emergente o Push. Tod
FREE

El indicador traza un gráfico afín para el instrumento actual restando el componente de tendencia del precio. Cuando se lanza, crea una línea de tendencia en la ventana principal. Coloque esta línea en la dirección deseada. El indicador traza un gráfico afín según la tendencia especificada.
Parámetros de entrada Número máximo de barras representadas - número máximo de barras visualizadas. Nombre de la línea de tendencia - nombre de la línea de tendencia. Color de la línea de tendencia - color d
FREE

El indicador está diseñado para la negociación intradía.
Equipado con todas las funciones de notificación para mayor comodidad en el comercio manual.
Se recomienda utilizar marcos temporales m5, m15, m30.
También puede ver y seleccionar los ajustes para cualquier instrumento financiero. Ajustes: Período del indicador - Período del indicador Alerta - La función de habilitar las alertas. notificaciones Push - Habilitación de notificaciones Push al terminal móvil Correo electrónico - Envío de u
FREE
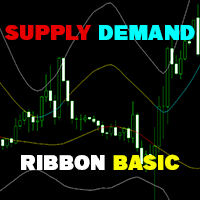
Supply Demand Ribbon es un indicador con líneas móviles de oferta y demanda que le ayuda a identificar las zonas de precios más fácilmente. El indicador le ayuda a determinar zonas flexibles de entrada, stop loss y toma de beneficios. También hay estrategias para cambiar algorítmicamente los colores de la cinta. ¡A partir de ahí se puede llegar a muchas estrategias de negociación para usted! Versión MT5: ¡Haga clic aquí !
¡ Usted puede explorar muchas características en la versión avanzada aqu
FREE

Después de 7 años, he decidido liberar algunos de mis propios indicadores y Asesores Expertos (EA) de forma gratuita.
Si los encuentras útiles, por favor, muestra tu apoyo con una calificación de 5 estrellas. Tu retroalimentación me motiva a seguir ofreciendo herramientas gratuitas. Consulta mis otras herramientas gratuitas aquí
_________________________________ Indicador ATR con Bandas para un Análisis Avanzado de la Volatilidad del Mercado Forex Presentamos el Indicador ATR con
FREE

El indicador Go Trend es un indicador personalizado para MetaTrader 4 (MT4) basado en la lógica ZigZag con tres niveles de periodo diferentes.
Este indicador está diseñado para identificar puntos de reversión de precios (máximos y mínimos) en diferentes marcos temporales, ayudando a los operadores a identificar tendencias potenciales y puntos de entrada/salida en el mercado.
Características principales Identificación de puntos de reversión (ZigZag) El indicador utiliza la lógica ZigZag para tr
FREE

Este escáner muestra los valores de tendencia basados en cruces de dos medias móviles para hasta 30 instrumentos y 8 marcos temporales. Puede recibir alertas vía MT4, Email y Push-Notification tan pronto como la dirección de la tendencia cambie. Esta es la versión GRATUITA del indicador: https://www.mql5.com/en/market/product/29159
Información Importante Cómo puede maximizar el potencial del escáner, por favor lea aquí: www.mql5.com/en/blogs/post/718074
Usted tiene muchas posibilidades para ut
FREE
Cómo operar
¡Ejecute sus operaciones en 3 sencillos pasos!
Paso 1: Configuración de la operación Entrada Comprar = Si el mercado diario abierto por encima de la línea PIVOT o puede Precio ha tocado y cerrado la vela por encima de Resistencia1. Entrada Vender = Si el mercado diario abierto por debajo de la línea PIVOT o puede El precio ha tocado y cerrado la vela por encima de Soporte1. Paso 2: Establecer Stop Loss Stop loss COMPRA ----> Puede establecer el stop loss en la Línea Pivote o Soporte1
FREE

MTF Heiken Ashi MA es un indicador de Heiken Ashi y Media Móvil con múltiples marcos temporales. Totalmente personalizable para cálculos avanzados y únicos de Heiken Ashi y Media Móvil.
Características principales Apariencia modificada y atractivo del tradicional usando solo cuerpos Heiken Ashi MA. MTF Disponible en marcos de tiempo más altos o más bajos, lo que lo hace ideal para tendencias y scalping. Hay muchos ajustes que pueden ser no repintados para señales en una nueva barra y en la barr
FREE

El indicador de Alerta de Patrón de Vela avisa cuando la última vela de precio cerrado coincide con los parámetros de entrada establecidos. Puede elegir escanear a través de todos los símbolos en Market Watch o introducir sus símbolos favoritos y también puede introducir los marcos de tiempo que necesita escanear. ---------Ajustes principales-------- ¿Seleccionar todos los símbolos de Market Watch? - Si la respuesta es Sí , el programa escaneará todos los símbolos mostrados en la Observación del
FREE

RJT SALAMANDER, el indicador como en un videojuego VERSIÓN 2 Pilota tu nave espacial PRECIO dentro de la caverna y evita la colisión contra las estalactitas (verdes) y las estalagmitas (rojas), esquivando estos obstáculos para ganar.
Cuando estos objetos están formándose (o desapareciendo) entonces debes tomar la decisión de cómo mover tu nave (igual que en un videojuego)
Dependiendo del mercado y del tamaño de las velas/barras puedes ajustar el cálculo de las estalactitas y estalagmitas (basado
FREE

Identificación de zonas de soporte y resistencia
Un indicador útil para los traders
totalmente gratuito
Se puede utilizar en todos los símbolos
Se puede utilizar en todos los marcos temporales
Tiene tres tendencias diferentes: corto plazo, medio plazo, largo plazo
Ajustes:
Clr1,2: Puede cambiar el color de las líneas
Tipo Tendencia: Usted puede determinar la tendencia
Mensaje mí para preguntas, críticas y sugerencias
FREE

ADR 10 muestra el rango medio de pips de un par de divisas, medido sobre un número de 10 días . Los operadores pueden utilizarlo para visualizar la posible acción del precio fuera del movimiento medio diario.
Cuando el ADR está por encima de la media, significa que la volatilidad diaria es más alta de lo normal, lo que implica que el par de divisas podría extenderse más allá de su norma.
El ADR también es útil para operar reversiones intradía. Por ejemplo, si un par de divisas alcanza la cima
FREE

SPREADEX es un indicador para MT4 y MT5 que indica la distancia del ACTIVO al GP. El GP es el precio del valor real del ACTIVO subyacente obtenido por estimación. El GP es como un imán, atrae el precio del ACTIVO con alta probabilidad y dentro del mismo día de negociación. Así, SPREADEX indica qué activos están más alejados del GP en ese momento en tiempo real. Proporcionando un punto de vista al TRADER sobre qué activos centrarse y buscar posibles señales de reversión de precios para tener oper
FREE

El propósito de esta nueva versión del indicador estándar de MT4 proporcionado en su plataforma es mostrar en una sub-ventana múltiples marcos temporales del mismo indicador. Vea el ejemplo que se muestra en la imagen de abajo. Pero la visualización no es como un simple indicador MTF. Esta es la visualización real del indicador en su marco de tiempo. Aquí están las opciones disponibles en el indicador FFx: Seleccione los marcos de tiempo a mostrar (M1 a Mensual) Definir el ancho (número de barra
FREE

Este indicador está diseñado para opciones binarias. Se basa en la divergencia propia del indicador CCI. Una señal de venta: Una flecha hacia abajo aparece en el gráfico. Una señal de compra: Una flecha hacia arriba aparece en el gráfico.
Parámetros de entrada Historia - el número de barras en la historia para el cálculo Período C CI - período del indicador técnico CCI Up border - límite de sobrecompra para el cálculo de la divergencia Down border - límite de sobreventa para el cálculo de la di
FREE

Objetivos es un indicador para determinar posibles puntos de inflexión , los objetivos se calculan para determinar los niveles en los que el sentimiento del mercado podría cambiar de "alcista" a "bajista". Este indicador se puede utilizar en cualquier marco temporal y en cualquier par de divisas: EN CASO DE QUE NO VEA EL INDICADOR CUANDO LO AÑADA A SUS GRÁFICOS SÓLO TIENE QUE ABRIR EL MENÚ DE INDICADORES Y VOLVER A CERRAR EL MENÚ TENGA EN CUENTA: Para obtener los mejores resultados utilice este
FREE

El Pivot Mean Oscillator (PMO) es un oscilador no limitado centrado en cero que proporciona una medida rápida y normalizada de la divergencia entre dos spreads. En este artículo se ofrece una descripción detallada de la formulación matemática junto con algunos comentarios y experimentos.
Aspectos comerciales
Esta versión de la PMO se ajusta a los diferenciales relativos a las señales de precio de Cierre y Apertura con respecto a su media móvil acumulada (CMA). Los valores PMO(m,n) positivos sig
FREE

Oscilador Dominator: La ventaja avanzada en sus operaciones ¿Cansado de indicadores rezagados y señales contradictorias? Oscillator Domin ator es un potente indicador patentado diseñado para eliminar el ruido del mercado y detectar oportunidades de inversión de alta probabilidad. No se limita a utilizar un Índice de Fuerza Relativa (RSI) estándar, sino que lo eleva aplicando primero una Media Móvil (MA) al precio, creando una medida de impulso más suave y con mayor capacidad de respuesta , lo q
FREE

El indicador OHLC muestra los valores actuales e históricos de Máximo, Mínimo, Apertura, Cierre y Media para un periodo de tiempo específico. Puede representar los valores actuales o los valores de la sesión anterior. El rango del indicador puede calcularse a partir de una sesión diaria, semanal, mensual o especificada por el usuario.
Niveles Máximo de la sesión actual o anterior. Mínimo de la sesión actual o anterior. Apertura de la sesión actual o anterior. Cierre de la sesión actual o anteri
FREE
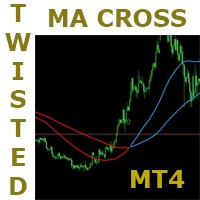
Se trata de una estrategia muy sencilla pero muy poderosa. Tiene mucho potencial. Esta estrategia se basa en el popular cruce de medias móviles, pero con un giro muy interesante. Tiene algunos mecanismos para retrasar las señales hasta que la dirección es clara y confirmada. Siga los colores de las indicaciones y las flechas para obtener ideas de operaciones. Tiene una tasa de ganancia potencial algo superior al 70%. Pruébela en todos los marcos temporales y determine cuál es buena para usted. =
FREE
El indicador Variations Moving Average dispone de ocho tipos de medias móviles no estándar.
Doble MA - DMA Triple MA - TMA Hull MA - HMA Media Móvil Jurik - JMA Media móvil adaptativa - AMA MA Adaptativo Fractal - FAMA MA ponderado por volumen - VWMA MA Dinámico de Índice Variable - VIDMA
Funciona como indicador de tendencia. Configuración del indicador Tipo MA Desplazamiento MA Mostrar Tendencia Periodo MA Método MA Precio aplicado MA Color MA
FREE

Probablemente haya oído hablar de la Teoría de la tendencia del Dow, según la cual los máximos y mínimos más altos indican una tendencia alcista, y los máximos y mínimos más bajos indican una tendencia bajista. Este indicador determina esta tendencia basándose en la Teoría Dow. Sólo tiene que introducir un número que represente el número de velas entre extremos. La solución óptima es el número 3, a menos que quieras tener la tendencia desde M5 pero estés en M1, entonces necesitas multiplicar es
FREE
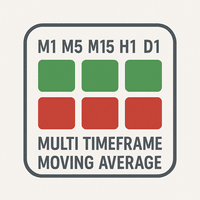
El indicador "MTF Moving Average Panel" es más una herramienta de ayuda que un indicador, sirve para ayudar a conocer la dirección de la tendencia para el par de divisas actual de todos los plazos en un solo lugar. Se utiliza mejor con otros indicadores y señales, para ayudar a filtrar las señales de acuerdo a la tendencia basada en múltiples marcos de tiempo.
Entradas del indicador : - Período de media móvil : Por defecto se establece en 34. - Método de Media Móvil : El método de cálculo de la
FREE

Indicador TurnPoint - Herramienta de señal de reversión de mercado y tendencia El indicador TurnPoint está diseñado para ayudar a los operadores a identificar posibles puntos de inflexión y niveles clave en el mercado. Mediante el análisis de la acción del precio, destaca las áreas en las que es probable que se produzcan retrocesos o continuaciones, lo que permite a los operadores anticiparse a los cambios de tendencia con mayor eficacia. Esta herramienta incorpora una lógica avanzada para filt
FREE

Este indicador muestra la dirección de la tendencia y el cambio de tendencia. Ganesha Trend Viewer es un indicador de tendencia diseñado específicamente para el oro y también se puede utilizar en cualquier instrumento financiero. El indicador no se redibuja. Marco temporal recomendado H1. Ganesha Trend Viewer es perfecto para todos los símbolos Meta Trader. (divisas, metales, criptodivisas, acciones e índices..) ¡Versión MT5 aquí!
Parametrización
MA Periodo Corto ----- Media Móvil periodo cort
FREE

BB & RSI Candle Color: Indicador de Análisis Técnico en MetaTrader 4 El indicador "BB & RSI Candle Color" es una poderosa herramienta de análisis técnico diseñada para traders de MetaTrader 4 que buscan una representación visual efectiva de las condiciones del mercado. Creado por 13 Crow Trading Club, este indicador combina las populares Bandas de Bollinger (Bollinger Bands) y el indicador de Fuerza Relativa (RSI) para proporcionar señales visuales claras y precisas. Este indicador ofrece tres
FREE

KFX SMA: Cambiador de Símbolos + Media Móvil (3x) + ATR + RSI + Candle Timer.
Este indicador le permite crear una lista de símbolos y cambiar entre los símbolos del gráfico actual o Timeframe seleccionando el botón apropiado. En el Gráfico se muestran tres (3) Medias Móviles multi timeframe (seleccionadas por usted), ATR Valor MTF ( seleccionado por usted - ayuda a establecer SL y TP), RSI Valor MTF (seleccionado por usted) y un Temporizador de Velas. Características: - Cambiador de Símbolos :
FREE

¿Le gusta el scalping? Este indicador muestra información sobre las últimas cotizaciones recibidas del broker. [ Guía de instalación | Guía de actualización | Solución de problemas | FAQ | Todos los productos ]
Identifique fácilmente las tendencias de tick Una línea azul significa que el precio ha subido Una línea roja significa que el precio ha bajado Colores y tamaños de letra personalizables Muestre la cantidad de filas que desee El indicador no repinta
Parámetros Filas: cantidad de filas co
FREE

Promedio Dinámico de Índice Variable (VIDYA) desarrollado por Tushar Chande por defecto está contenido en MT5 pero no en la plataforma MT4 y es un EMA dinámico (Promedio Móvil Exponencial) que ajusta su Longitud (Período LB) automáticamente en respuesta a la Volatilidad del Mercado originalmente medida a través del Chande Momentum Oscillator(CMO). El valor del CMO se utiliza como ratio del factor de suavizado de la EMA (The New Technical Trader by Tushar Chande and Stanley Kroll, John Wiley and
FREE
Indicador del Índice Dinámico de Trader (TDI) altamente configurable.
Características: Funciones de alerta altamente personalizables (en niveles, cruces, cambios de dirección vía email, push, sonido, popup) Capacidad de múltiples marcos temporales (marcos temporales superiores e inferiores también) Personalización del color (en niveles, cruces, cambios de dirección) Opciones de interpolación lineal y modo histograma Funciona en el probador de estrategias en modo multi timeframe (también en fin
FREE

Domine sus entradas y salidas del mercado ¿Está cansado de los indicadores confusos y ruidosos que le dan señales falsas? El Estocástico Market Master está diseñado para eliminar el ruido y ofrecerle oportunidades de inversión claras y nítidas. Esta poderosa herramienta utiliza un proceso único de doble suavizado para proporcionar señales de compra y venta más precisas, ayudándole a detectar los cambios de tendencia con confianza y precisión. Con este indicador, puede dejar de mirar la pantalla
FREE

Creé este indicador simple mientras aprendía sobre TheStrat de Rob Smith y lo encuentro tan útil que pensé en compartirlo con usted. Si lo encuentra útil, mire los otros indicadores que he publicado en MQL5. El indicador simplemente dibuja una sola línea en el gráfico que muestra el nivel de precio que selecciona de un marco de tiempo más alto. Con la configuración, tiene control total sobre el período de tiempo que muestra, pero de forma predeterminada, calcula el período de tiempo más alto,
FREE

Double Price Channel Indicador de canal de precio para un cierto número de barras especificado en la configuración.
Las líneas indicadoras representan niveles dinámicos de soporte o resistencia. El límite superior es el precio máximo para un cierto número de períodos, el inferior es el mínimo. A diferencia de los promedios móviles, que se basan en precios de cierre, el indicador no se “distrae” con pequeñas fluctuaciones. Se volverá a calcular solo si cambian los límites. Si ocurre lo último,
FREE
¡Encuentre la dirección de sus operaciones con Signal Compass Pro ! ¿Cansado de adivinar su próximo movimiento? Signal Compass Pro es su respuesta. Este indicador no es sólo una herramienta; es su brújula personal en los mercados financieros. Mediante la combinación de tres potentes indicadores de momentum -CCI , WPR e Índice de Fuerza- proporcionamos señales de trading confirmadas que son más limpias, fiables y menos propensas al "ruido". Principales características y ventajas Señales confirmad
FREE
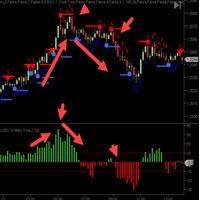
El indicador de valor de fuerza de cierre CycleTraderPro mide la distancia desde el OPEN de una nueva barra hasta el CIERRE de esa barra.
Entrada -
longitud = 10 por defecto
Agregamos estos valores juntos volviendo a la configuración de longitud.
Si la primera barra tenía más 10 tics y luego la siguiente barra era menos 7 tics, entonces esto registraría +3
Hay 2 formas de comerciar con Valor de Fuerza Cerrada:
1. Operar en la dirección de máximos y mínimos más bajos y viceversa para compra
FREE
El propósito de esta nueva versión del indicador estándar de MT4 proporcionado en su plataforma es mostrar en una sub-ventana múltiples marcos temporales del mismo indicador. Vea el ejemplo que se muestra en la imagen de abajo. Pero la visualización no es como un simple indicador MTF. Esta es la visualización real del indicador en su marco de tiempo. Aquí están las opciones disponibles en el indicador FFx: Seleccione los marcos de tiempo a mostrar (M1 a Mensual) Definir el ancho (número de barra
FREE

Este indicador muestra la fortaleza de cada divisa en comparación con el dólar estadounidense calculando la tasa de variación del precio durante un periodo de tiempo determinado. Cuando abra el indicador, verá una lista de diferentes divisas en el gráfico de precios. Cada divisa tendrá un valor numérico que indicará su nivel de fuerza en comparación con el dólar estadounidense, donde: Si el valor es superior al dólar estadounidense, se mostrará en verde, lo que significa que esa divisa es más f
FREE
¿Sabe usted por qué MetaTrader Market es el mejor lugar para vender estrategias comerciales e indicadores técnicos? Con nosotros, el desarrollador no tiene que perder tiempo y fuerzas en publicidad, protección del programa y ajustes de cuentas con los compradores. Todo eso ya está hecho.
Está perdiendo oportunidades comerciales:
- Aplicaciones de trading gratuitas
- 8 000+ señales para copiar
- Noticias económicas para analizar los mercados financieros
Registro
Entrada
Si no tiene cuenta de usuario, regístrese
Para iniciar sesión y usar el sitio web MQL5.com es necesario permitir el uso de Сookies.
Por favor, active este ajuste en su navegador, de lo contrario, no podrá iniciar sesión.