Indicadores técnicos para MetaTrader 4 - 41

Líneas de precios activas
El indicador le ofrece un control personalizado total sobre las líneas de precios de compra y venta, tanto en color como en estilo. El control del color también es personalizable en función del aumento o disminución del precio por tick.
Las opciones incluyen: Mostrar tanto la línea de Oferta como la de Demanda Establecer un color único para cada una Establecer un estilo de línea único para cada una Establecer un color único para el precio incrementado (por tick) Most
FREE

Este indicador determina los volúmenes mínimos necesarios durante la formación de una vela para que sea superior a la media del volumen actual. Aunque puede colocar MAs en su indicador de volumen, este indicador tiene la característica de no repintar, por lo que no debe preocuparse por el aumento repentino del volumen. Este indicador también dibuja su propio indicador de volumen. Descripción de Entrada: period: Periodo usado para el indicador. Debe ser mayor que 1. Salida Descripción: VolumeXove
FREE

This channel is based on the Hodrick-Prescott filter, which is a type of zero-lag digital filter. First, filtered Close price values are calculated. Then, a second filtering with a longer period is applied. This results in two arrays: HP and HPSlow. In the next step, the standard deviation of HP relative to HPSlow is computed, and a channel is constructed. The VHP channel PRT indicator displays the average spread value and the channel width relative to HPSlow (expressed as a percentage) at th
FREE

Indicador RSI con líneas de señal, en cuya intersección se emitirá la notificación correspondiente, que puede ser en forma de alerta normal o en forma de archivo de sonido para el usuario.
El indicador también tiene la función de enviar notificaciones push y notificaciones por correo electrónico en la intersección de estos niveles.
Los valores de los niveles pueden establecerse independientemente en los ajustes del indicador y, si se desea, pueden modificarse y configurarse directamente en la
FREE
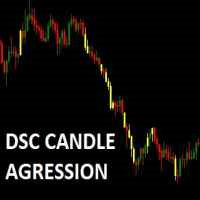
Corretora recomendada para usar este indicador: https://tinyurl.com/5ftaha7c Indicador que pinta la vela de amarre en pontos de mucha agresión en el mercado. Siempre que el mercado se mueva la vela se pondrá amarilla. Válido para todos los activos y todos los marcos de tiempo. VER NUESTROS RESULTADOS EN INSTAGRAM: https://www.instagram.com/diogo.cansi/ GRUPO DE TELEGRAM = https://t.me/robosdsc Más información por email dscinvestimentos@gmail.com o por Whatsapp 55-991372299
FREE
Indicador del índice de vigor relativo (RVI) altamente configurable.
Características: Funciones de alerta altamente personalizables (en niveles, cruces, cambios de dirección vía email, push, sonido, popup) Capacidad de múltiples marcos temporales Personalización del color (en niveles, cruces, cambios de dirección) Opciones de interpolación lineal y modo de histograma Funciona en el probador de estrategias en modo multi timeframe (también en fin de semana sin ticks) Niveles ajustables Parámetro
FREE

Basado en el principio de seguimiento de tendencia del CCI, se ha mejorado para convertirse en un indicador que puede identificar la inversión de la tendencia y su dirección de desarrollo, es decir, puede identificar la atenuación superior e inferior de la tendencia oscilante en el mercado de tendencia. característica Las columnas roja y verde representan la tendencia de desarrollo alcista o bajista en el ciclo actual. La línea azul muestra la posición y la atenuación de la tendencia del precio
FREE

El temporizador de velas muestra el tiempo que falta para que se cierre la barra actual y se forme una nueva barra.
Característica fácil de usar . no hay retraso o demora . Personalice la posición, el color y el tamaño de la fuente. hora del servidor no hora local .
Entradas
- Posición * Al lado de la vela activa (por defecto) * Derecha Superior * Levante Superior * Derecha Inferior * Levantar Inferior - tamaño de letra * 14 (predeterminado) - color * PrimaveraVerde (Predeterminado)
FREE

Intraday Pulse - Indicador de precio medio intradía Intraday Pulse es un indicador diseñado para determinar el precio medio intradía al cierre diario del gráfico. Gracias a su avanzado algoritmo, sigue automáticamente el nivel de referencia, proporcionando un apoyo esencial para estrategias de negociación eficaces. Nota: el gráfico diario es ideal para utilizar el indicador (D1). Actualiza el marco temporal al final de la sesión diaria.
El indicador es versátil y puede utilizarse en cualquier a
FREE

El indicador muestra en el gráfico la hora actual del servidor y la hora hasta el cierre de la barra actual. La información puede ser muy útil en los momentos de publicación de noticias, cuando los operadores esperan el cierre de la vela, para el Inicio de la sesión de negociación. El Tamaño y el color de la fuente se pueden ajustar a Su plantilla gráfica.
Ajustes: Text color - color del texto de visualización Text size - Tamaño del texto de visualización Agrégame como amigo para no perderte l
FREE

Versión gratuita de https://www.mql5.com/en/market/product/44606 Sencillo indicador para calcular el beneficio en los niveles de retroceso de fibonacci con tamaño de lote fijo, o calcular el tamaño de lote en los niveles de fibonacci con beneficio fijo. Añadir al gráfico y mover la línea de tendencia para establecer los niveles de retroceso de fibonacci. Funciona de forma similar al estudio de la línea de retroceso de fibonacci por defecto en Metatrader . Entradas Fijo - seleccione que valor ser
FREE
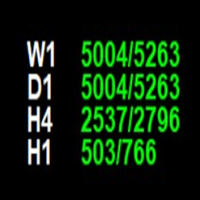
El **Indicador Punto de la Semana** es un poderoso indicador de MetaTrader 4 que muestra valores de puntos para múltiples marcos de tiempo (W1, D1, H4, H1) directamente en su gráfico. Calcula la posición del precio de cierre dentro del rango de la vela y lo muestra como un valor de punto, junto con el rango total de la vela.
## Características
- Muestra los valores de punto para 4 marcos de tiempo: **Semanal (W1), Diario (D1), 4-Horas (H4) y Horario (H1)**. - Muestra el valor del punto y
FREE

MaSonic MT4 versión japonesa
Este indicador le permite hacer clic en cualquier punto del gráfico para localizar y mostrar rápidamente una media móvil (MA) a través de ese punto.
Características: Funcionamiento sencillo: haga clic en cualquier punto en el que desee encontrar una MA . Resultados instantáneos : muestra las MA coincidentes encontradas. Función de reposo: oculta los botones cuando no se utilizan , manteniendo limpia la interfaz. Control manual: ajuste manualmente las MA mediante lo
FREE
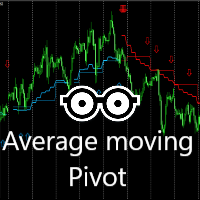
Este indicador es muy eficaz para el comercio todos los días. Una combinación de medias móviles y 2X Pivots cálculo para producir una señal muy convincente todos los días. El color azul indica una oportunidad de compra. Siga las flechas para posibles puntos de compra. Los pivotes azules y la línea media sirven como posible soporte. El color rojo indica una oportunidad de venta. Siga las flechas para encontrar posibles puntos de venta. Los pivotes rojos y la línea media sirven como posible resist
FREE
Este indicador multi-marco de tiempo identifica la tendencia del mercado a operar dentro de una estrecha banda de precios. [ Guía de instalación | Guía de actualización | Solución de problemas | FAQ | Todos los productos ]
Es fácil de entender Encuentra situaciones de sobrecompra y sobreventa Dibuja al cierre de la barra y no retropinta El marco temporal de cálculo es personalizable La línea roja es el precio de sobrecompra La línea verde es el precio de sobreventa Tiene implicaciones comercial
FREE
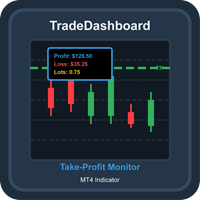
TradeDashboard Indicador MT4 Completo para Visualización y Análisis de Operaciones Descripción General TradeDashboard es un potente indicador para MetaTrader 4 diseñado para mejorar tu experiencia de trading mediante la visualización en tiempo real de los niveles de take-profit para todas las posiciones abiertas. Esta herramienta avanzada va más allá de los indicadores básicos de TP al mostrar métricas completas que incluyen ganancias potenciales, pérdidas y tamaños totales de lotes, todo direct
FREE

Tasa de cambio
Basado en la fórmula, ROC = (Close[n] - Close[n-lookback]) / Close[n-lookback] * 100 para trazar la tasa de cambio de la acción del precio de un par de divisas durante un período retrospectivo, y proporciona dos variables globales, SYMBOL_ROC y SYMBOL_ROC_LOOKBACK, que representan el último valor de Tasa de cambio y la Tasa de cambio en el período retrospectivo anterior. Invocando el indicador usando la función iCustom, iCustom ( "Market/RedeeCash_Rate_of_Change.ex4" , Symbol ()
FREE

Después de 7 años he decidido publicar algunos de mis indicadores y EA de forma gratuita.
Si los encuentras útiles, por favor ¡Muestra tu apoyo con una valoración de 5 estrellas! ¡Tu feedback mantiene las herramientas gratuitas llegando! Ve también mis otras herramientas gratuitas aquí
_________________________________ Índice de Intensidad Intradía (III) para Análisis de Forex Precisos El Índice de Intensidad Intradía, desarrollado meticulosamente en MQL4, es una herramienta inno
FREE

Este indicador le avisa cuando las líneas creadas por el indicador son "tocadas" por el precio, Puede cambiar el intervalo entre alertas. Puede cambiar los colores y estilos de las líneas como desee. Sin embargo, las líneas deben llamarse "Superior" e "Inferior".
Existe una versión PRO más potente.
Parámetros de entrada WaitTime: Intervalo entre alarmas.
Modo de empleo Coloque las líneas donde quiera añadir alarmas.
FREE

Estrategia de trading universal, muy sencilla pero fiable, para captar retrocesos tras un fuerte impulso. Adecuada para Forex, acciones y opciones binarias. Cuanto más alto sea el TF, más precisas serán las señales, pero menos frecuentes las entradas. Se puede utilizar como entrada para trabajar en una (dos) barras, así como para construir una pequeña parrilla de 3-5 rodillas con o sin martingala. Para las opciones binarias sólo el tiempo de caducidad. El indicador tiene alertas, notificaciones
FREE
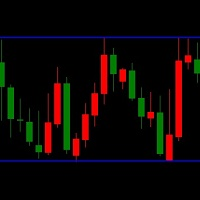
LT Triple Support Resistance Screen Method es un tipo de indicador de niveles que consta de tres líneas SR. Es construido por el lenguaje de programación MQL4 y puede ser utilizado para la plataforma MT4. Un indicador de versión gratuita para determinar los niveles de soporte y resistencia fácilmente . Este indicador funciona basado en el método de pantalla para calcular el valor más apropiado para cada tope. Un complejo algoritmo basado en una larga investigación se aplica a este indicador pers
FREE

Este indicador muestra gráficamente el beneficio ($), el riesgo/recompensa y el % de riesgo según las órdenes SL&TP abiertas en el símbolo actual. cuando usted abre ordenes en el simbolo actual y establece StoplLoss y TakeProfit este indicador automaticamente calcula el Riesgo/Recompensa y calcula el % de riesgo de la cuenta de capital que su orden obtenga stop Loss. Si usted opera en varios símbolos al mismo tiempo, puede instalar el indicador en cada uno por separado y ver los cálculos pertine
FREE
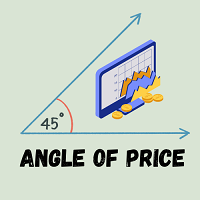
Ángulo del precio Es un indicador de seguimiento de tendencia. La idea detrás de este indicador es muy simple. calcula el ángulo de cierto tipo de precio con su tipo de precio N vela atrás. Cuando el precio se mueve hacia arriba, se crean histogramas de ángulos positivos y viceversa para direcciones bajistas. Hay un par de tipos de precios soportados en este indicador. Que son los siguientes Cierre Abierto Alto Bajo Mediana Típico Ponderado Cuando se combina con otros indicadores, puede utilizar
FREE

Descripción del indicador Se trata de un indicador único en su género. Predice barras futuras utilizando la teoría del comportamiento cíclico de los precios y cierta estacionariedad del mercado. Este indicador le ayudará a predecir 1 o más barras futuras, proporcionando así una imagen de la posible evolución de la situación del mercado. Se basa en 5 métodos de predicción. El primer método es la transformada de Fourier, mientras que los otros están representados por diferentes variaciones de méto
FREE

Introducción Este indicador se basa en el precio medio/máximo precio se mueve, y el uso de bandas de Bollinger en movimiento y medias móviles.
La Ventaja De Usarlo Con Su Propio Análisis Confirmará Soportes Y Resistencias Potenciales Mientras Se Complementa Con Su Análisis.
El Indicador No Se Repinta
Y junto con nuestra tendencia especial METRE que cambia con las condiciones de una tendencia alcista o bajista....
Recomendar Marcos De Tiempo: H1 H4 M15
Uso: El Indicador Es Muy Rentab
FREE

El indicador estándar RSI es muy útil para identificar las zonas de sobrecompra o sobreventa durante una plana, pero da muchas señales falsas cuando el mercado está en tendencia. Por ejemplo: durante una tendencia alcista, el indicador estándar entra a menudo en la zona de "sobreventa" y muy raramente (la mayoría de las veces, cuando la tendencia ya ha terminado) entra en la zona de "sobrecompra". Este indicador tiene en cuenta el movimiento de la tendencia y, con los ajustes seleccionados, pued
FREE
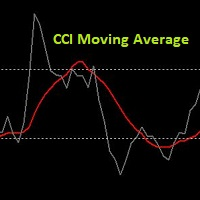
Es un indicador muy sencillo. Se trata simplemente de la media móvil CCI. El indicador de media móvil CCI nos permite reducir las señales falsas y optimizar nuestras operaciones. Las entradas necesarias del indicador son: Periodo del CCI, Precio aplicado del CCI, Periodo de la media móvil del CCI y Método de la media móvil del CCI. El gráfico muestra el CCI original y su media móvil. Este es mi primer indicador que publico. Espero que el indicador le beneficie. El autor de este indicador es Toma
FREE
El uso de múltiples marcos temporales para el análisis con Multi Timeframe Average True Range puede proporcionar varios beneficios significativos para los operadores: Visión completa del mercado: Al aplicar Mtf ATR Standard a través de diferentes marcos temporales, los operadores obtienen una perspectiva más amplia de la dinámica del mercado. Esto les permite identificar tendencias, patrones y potenciales puntos de reversión que podrían ser más evidentes o consistentes a través de varias escalas
FREE
Panel de control simple para ver el valor de ATR en múltiples períodos de tiempo, sin necesidad de hacer clic en ningún período de tiempo, podemos ver la descripción general de ATR más rápido.
Apoyar el cambio de valor del período ATR.
¡Descargar gratis!
Ya lo probamos a través de Strategy Tester, no hay nada de malo.
Si encuentra algo mal, simplemente deje caer el comentario a continuación o contácteme en el sitio: http://www.thanksmybot.com
Correo electrónico: gmail@thanksmybot.com
Est
FREE
El indicador RSI S-RoC difiere del RSI estándar en que tiene en cuenta la tasa de variación del precio a la hora de calcular los valores. Cuando el precio se mueve en una tendencia, el indicador produce buenas señales de entrada cuando el precio toca sus niveles. Los valores de los niveles pueden configurarse en los ajustes del indicador. También se pueden modificar y ajustar directamente en la ventana del indicador. También puede establecer líneas de señal en un gráfico. Una vez cruzadas, el in
FREE
Indicador de Tasa de Cambio (ROC) altamente configurable. Funciones: Funciones de alerta altamente personalizables (en niveles, cruces, cambios de dirección vía email, push, sonido, popup). Capacidad de múltiples marcos temporales Personalización del color (en niveles, cruces, cambios de dirección) Opciones de interpolación lineal y modo de histograma Funciona en el probador de estrategias en modo multi timeframe (también en fin de semana sin ticks) Niveles ajustables Parámetros:
ROC Timeframe:
FREE

Este indicador convertirá los colores de sus velas en un color orientado a la tendencia mostrando 4 colores diferentes basados en dos medias móviles y la pendiente de la media móvil lenta. indicador muy potente para todos los periodos de tiempo mostrándole la dirección de la tendencia para confirmar sus operaciones.
Verde: Alcista
Verde oscuro: Alcista Débil
Rojo claro Bajista Débil
Rojo Bajista
Para más información:
h ttps:// linktr.ee/trader_1st
FREE
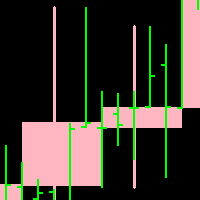
Candleline: indicador de línea de vela. Según el periodo especificado, dibuja la línea de vela del periodo especificado en el gráfico actual. Además, la nueva línea de vela se superpone a la línea de vela del gráfico actual.
Nota: el periodo del gráfico actual debe ser inferior al periodo de la línea de vela que se va a dibujar.
Para ver el efecto específico de la línea de vela autodibujada, consulte la imagen adjunta a continuación. Parámetro: 1.TimeFrame; 2. NumberOfBar; 3.Up línea de la ve
FREE

El propósito de esta nueva versión del indicador estándar de MT4 proporcionado en su plataforma es mostrar en una sub-ventana múltiples marcos temporales del mismo indicador. Vea el ejemplo que se muestra en la imagen de abajo. Pero la visualización no es como un simple indicador MTF. Esta es la visualización real del indicador en su marco de tiempo. Aquí están las opciones disponibles en el indicador FFx: Seleccione los marcos de tiempo a mostrar (M1 a Mensual) Definir el ancho (número de barra
FREE

Este es un indicador de oferta y demanda en múltiples marcos de tiempo para la plataforma MT4. Puede utilizar niveles de oferta y demanda en marcos de tiempo más pequeños. Adicionalmente puede elegir matar cada nivel que ha sido probado. Tiene bandas estrechas, es decir, puede seleccionar todo el nivel de oferta y demanda o sólo una sección estrecha. Por último, también se obtiene el rango de precios para las zonas. Impresionante
FREE
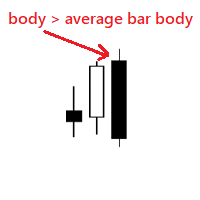
Indicador muy simple que muestra si el cuerpo de una nueva barra es más grande que el cuerpo medio de la barra. Podemos usar el indicador para notar barras que son más grandes de lo usual, por ejemplo esto podría significar una nueva tendencia. Parámetros de entrada: barras históricas a mostrar de cuantas barras obtener el cuerpo medio de la barra Para calcular sólo barras del mismo tipo distancia para los puntos color toro color oso tamaño del punto
FREE

Índice de Fuerza Relativa Cruzado [RSI Cross] Una combinación de 2 RSI para crear una configuración de negociación cruzada Parámetros de entrada: signal mode: ajústelo a true si desea conectarlo a STAT (Signal Tester and Trader) desplazamiento de la flecha: distancia entre la línea EMA rápida y la flecha en el gráfico filtro de línea de precio periodo RSI rápido periodo RSI lento método de precio RSI nivel superior del precio nivel inferior del precio Usted puede encontrar la mejor configuración
FREE

El indicador muestra las medias móviles en un número determinado de barras (barra de recuento para mostrar MA ). Esta forma de visualización simplifica el análisis, ya que el gráfico no está abarrotado de líneas innecesarias. También hay una etiqueta de texto que muestra el precio actual de la media móvil y el periodo del gráfico. Se utilizan teclas de acceso rápido para simplificar el uso del indicador.
Ajustes del indicador: Media móvil nº 1 - media móvil nº 1 Period - periodo de media Modo
FREE
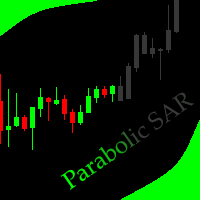
Este indicador permite ocultar el SAR Parabólico (en todos los timeframes de MT4) a partir de una fecha definida por el usuario, con una línea vertical (Solo) o un panel (con "Velas Ocultas"). Entradas del indicador: Paso Máximo Color Anchura Información sobre el indicador "Parabolic SAR" está disponible aquí: https: //www.metatrader4.com/en/trading-platform/help/analytics/tech_indicators/parabolic ************************************************************* Hola traders!! ¡¡¡Denme sus feeds!!
FREE

El indicador de media móvil R Var es un indicador de seguimiento de tendencias diseñado para seguidores de tendencias acérrimos.
Es un indicador de compraventa de divisas bastante popular entre los comerciantes de acciones, así como entre los comerciantes de productos básicos, y su popularidad se debe a su capacidad para ofrecer señales genuinas de hacer dinero a sus usuarios.
El indicador se compone de puntos verdes y rojos que se colocan en una línea de siena. El punto verde apunta a una se
FREE

Symbol Cycler es una utilidad ligera que le permite cambiar rápidamente entre los símbolos de su lista de observación del mercado mediante dos simples botones de flecha (). Con un solo clic, puede desplazarse hacia delante o hacia atrás por los símbolos predefinidos sin salir del gráfico. Características principales: Cambio de símbolo con un solo clic desde el gráfico Funciona con su orden de lista de vigilancia del mercado Los botones se pueden colocar en cualquier esquina del gráfico o inc
FREE

Proporcionamos indicadores adaptados para satisfacer mejor sus necesidades de trading >> MT Sideway Filter <<
MT Focus Sesión : Centrado en el seguimiento de los tiempos de sesión, el indicador MT Focus Session enfatiza la actividad del mercado desde la apertura hasta el cierre, con preferencia por los periodos de alto volumen entre la apertura de Londres y el cierre de Estados Unidos.
operativa: forex
MARCO TEMPORAL: M5 M15 M30 H1
PAR DE SÍMBOLOS: Todos los símbolos
AJUSTES:
SESI
FREE
Indicador Average True Range (ATR) altamente configurable.
Características: Funciones de alerta altamente personalizables (en niveles, cruces, cambios de dirección vía email, push, sonido, popup). Capacidad multi-marco de tiempo Personalización del color (en niveles, cruces, cambios de dirección) Opciones de interpolación lineal y modo de histograma Funciona en el probador de estrategias en modo multi timeframe (también en fin de semana sin ticks) Niveles ajustables Parámetros:
ATR Timeframe:
FREE

SpreadChartOscillator es un indicador que muestra la línea de propagación del símbolo en la subventana del oscilador. En los parámetros es posible especificar otro símbolo a partir del cual se emitirá la línea de spread. Si el parámetro "Símbolo" se deja vacío, la línea de spread se mostrará desde el símbolo actual en el que está fijado el indicador. Esta herramienta es ideal para los operadores que desean ver la dinámica del spread en el formato del oscilador y utilizarla para protegerse de en
FREE

ReviewCandleChart es un producto único que puede verificar las fluctuaciones de precios en el pasado utilizando gráficos de velas. Este indicador reproduce con precisión las fluctuaciones de los precios del mercado en el pasado y puede tomar decisiones comerciales (entradas, ganancias, corte de pérdidas) muchas veces para que pueda aprender el comercio más rápido. ReviewCandleCahrt es el mejor indicador para mejorar las habilidades de negociación. RevisiónCandleCahrt abastece tanto a los princip
FREE

Esta herramienta le ayuda a controlar la situación en otros momentos e incluirlos en sus operaciones al analizar el mercado Esta herramienta escanea el mercado e informa del movimiento del mercado en diferentes momentos Con la ayuda de esta herramienta, puede evitar muchos análisis erróneos. Con la ayuda de esta herramienta, usted puede tener una visión general del mercado en el menor tiempo y ahorrar su tiempo
FREE

TPP : Patrón del punto de inflexión El indicador muestra el mercado Turning Point Pattern como flechas. Las señales de inversión se basan en la observación de la acción del precio y el comportamiento del mercado. Se basa en los principios de búsqueda de extremos, volatilidad y patrones de velas. El indicador proporciona señales sobre los siguientes principios: Búsqueda del final de la tendencia ascendente/descendente Búsqueda del patrón de inversión basado en el patrón de velas Confirmación de l
FREE
Por favor, comparta un comentario o tasa de mejora Función principal : La función de inicio es llamada en cada nuevo tick. Realiza la lógica principal del indicador: Inicializa las matrices para almacenar los precios máximos y mínimos diarios. Redimensiona e inicializa estas matrices basándose en el número de días especificados por el parámetro de entrada DÍAS. Copia los precios máximos y mínimos diarios en estas matrices. Busca el precio máximo más alto y el mínimo más bajo durante el número d
FREE

El GTAS BSI es un indicador diseñado para proporcionar la dirección de la tendencia y señales de compra/venta, utilizando una combinación de indicadores de impulso. Este indicador fue creado por Bernard Prats Desclaux, proprietary trader y ex gestor de fondos de cobertura, fundador de E-Winvest.
Descripción El indicador BSI se representa como un histograma bajo el gráfico de precios. Un valor de +100 (verde) indica una tendencia alcista. El valor -100 (rojo) indica una tendencia bajista. Cuando
FREE

Currency Explorer es la herramienta absoluta para los operadores que desean conocer con certeza cuantificada la fortaleza y debilidad de cada divisa y operar con ellas utilizando estrategias aplicables. Nuestros modelos de aprendizaje automático se ejecutan y proporcionan la fuerza / debilidad de cada moneda sobre la base de múltiples factores, además de la acción del precio. Proporciona al trader un resultado CUANTIFICADO de la fortaleza de las 8 divisas más populares y principales (EUR, USD, J
FREE

Grid Vision TP y NP (Edición Mundial) Grid Vision TP y NP es un indicador de ayuda visual para la cuadrícula / promedio de comercio de estilo.
Se trata únicamente de una herramienta de visualización de gráficos. No coloca, modifica o cierra ninguna orden. Le muestra, directamente en el gráfico: dónde está el precio medio de su cesta a qué precio su cesta alcanzará un objetivo de beneficio en dinero a qué precio su cesta alcanzará una pérdida máxima en dinero (opcional) cuántos pasos de rejilla
FREE

Las velas envolventes están formadas por dos barras en un gráfico de precios. Se utilizan para indicar una inversión del mercado. La segunda vela será mucho más grande que la primera, de forma que cubra o "engulla" por completo la longitud de la barra anterior.
Al combinar esto con la capacidad de observar la dirección de la tendencia, este indicador elimina muchas señales falsas que normalmente se generan si no se tiene en cuenta la tendencia general.
FREE

Se trata de un indicador de señales de 15 minutos para todo tipo de operadores. Esto significa que puede obtener grandes beneficios operando con dos señales diferentes en un solo indicador.
NOTA: Ambos indicadores son canales para obtener el mismo resultado. FLECHA ROJA -- Señal de venta FLECHA AZUL -- Señal de compra
Compre ahora para formar parte de nuestra comunidad. Ofrecemos configuraciones de gráficos estándar para operadores principiantes e intermedios. ¡Opere con facilidad!
FREE

Es una herramienta sencilla pero útil para crear una rejilla basada en Sobres.
Sólo se pueden establecer 2 parámetros: 1) "Periodo" - el periodo de todas las Envolventes visibles (es decir, 4) y 1 Media Móvil (eje de las Envolventes), 2) "Distancia de las Desviaciones" - la distancia entre las Envolventes.
Naturalmente, los colores de las 9 líneas se pueden cambiar como se desee. Funciona con todo lo que está disponible en su Market Watch.
¡Suerte!
FREE

Este indicador permite ocultar Ichimoku Kinko Hyo (en todos los timeframes de MT4) a partir de una fecha definida por el usuario, con una línea vertical (Solo) o un panel (con "Velas Ocultas"). Entradas del Indicador: Tenkan-sen Kijun-sen Senkou Span B Información sobre el indicador "Ichimoku Kinko Hyo" está disponible aquí: https: //www.metatrader4.com/en/trading-platform/help/analytics/tech_indicators/ichimoku ************************************************************* Somos una comunidad y
FREE

Similar a la lógica utilizada en: Golden MA MTF TT Resumen
Indicador "Golden MA" para niveles OB/OS. Se basa en los máximos/mínimos de la barra anterior del marco de tiempo superior (HTF). Sólo útil en swing trading o scalping. Mejor para al menos M15+. Para marcos de tiempo más bajos necesitará cambiar StartPips a un valor más bajo para obtener líneas consistentes. Porque los marcos de tiempo más bajos tendrán distancias de pip más pequeñas. Características - Defina plazos superiores para el pl
FREE

Indicador de Bandas de Fibonacci para Metatrader 4 . Este indicador funciona de forma similar a las conocidas Bandas de Bollinger clásicas, pero en lugar de usar la desviación estándar para trazar las bandas usa números de Fibonacci y el ATR (Average True Range). Puede usarse para trazar niveles de soporte y resistencia que pueden emplearse en sistemas de scalping de corto plazo y swing trading. Las bandas del indicador son calculadas de la siguiente forma: Línea central : Media móvil de n peri
FREE

Panda Oscillator - un nuevo indicador de autor diseñado para scalping.
El indicador da señales basadas en las lecturas de todo un conjunto de herramientas estándar y de autor.
Características principales de Panda Oscillator: Funciones analíticas
Se puede utilizar en cualquier par de divisas y Marcos de tiempo; El indicador no se vuelve a dibujar; Excelente complemento a otros indicadores; Características gráficas
Ocupa la cantidad mínima de espacio en el gráfico; Tinturas flexibles; Fácil
FREE
Indicador Demarker altamente configurable.
Funciones: Funciones de alerta altamente personalizables (en niveles, cruces, cambios de dirección vía email, push, sonido, popup) Capacidad multi timeframe Personalización del color (en niveles, cruces, cambios de dirección) Opciones de interpolación lineal y modo de histograma Funciona en el probador de estrategias en modo multi timeframe (también en fin de semana sin ticks) Niveles ajustables Parámetros:
Demarker Timeframe: Puede establecer los mar
FREE
Visualiza cualquier media móvil en su temporalidad original, sin importar el timeframe del gráfico.
¿Qué hace?
Este indicador te permite ver una media móvil de cualquier temporalidad (M5, H1, H4, D1, etc.) directamente en tu gráfico actual, manteniendo sus valores originales de la temporalidad que elegiste.
Ejemplo práctico:
Estás operando en M5
Activas la MA de H1 con este indicador
Ves exactamente la misma línea que verías si cambiaras a H1
Sin cambiar de timeframe
Características
Cua
FREE
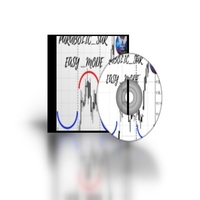
Parabolic Sar easy mode, remake del indicador p.sar original haciendolo mas facil de leer para traders novatos y experimentados que buscan reducir el tiempo analizando los graficos, puedes hacer tu propia estrategia modificando los periodos y fusionandolo con otros indicadores como RSI ,estocastico o lo que quieras, este indicador funciona mejor en graficos de tiempo alto como H4 o D1.
FREE
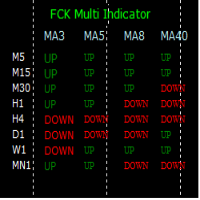
El FCK Multi Indicador para MT4 muestra la dirección de la tendencia de múltiples indicadores en múltiples marcos de tiempo para un par. Por lo tanto, los operadores de divisas pueden ver la dirección de la tendencia en un instante y el comercio con la confluencia de múltiples indicadores. Además, ayuda a los operadores a ver la tendencia en múltiples marcos de tiempo y operar en la dirección de la tendencia general del mercado. Además, muestra el stop loss, los pips a detener y los pips en bene
FREE

Echa un vistazo a otros grandes productos de https://www.mql5.com/en/users/augustinekamatu/seller
Este indicador es el mejor hasta ahora para determinar la fuerza de la divisa de cada par. Proporciona valores estables y se adapta muy bien a los cambios del mercado. Es una gran herramienta para añadir a su arsenal para asegurarse de que está en el lado derecho de la tendencia en todo momento. No se requieren entradas, es simple plug and play. Una estrategia ganadora En este artículo se describen
FREE

Esta es la Versión Demo de PipsFactoryDaily Este indicador depende del precio Alto y Bajo de la moneda en el último día, y luego hice algunas ecuaciones secretas para dibujar 10 líneas.
Características Usted sabrá exactamente a qué precio debe entrar en el mercado. Usted sabrá cuando estar fuera del mercado. Usted sabrá lo que debe hacer en el mercado: Comprar Vender Tomar beneficios, y hay tres niveles para hacerlo Soporte Resistencia Riesgo de comprar Riesgo de vender
Tipos de señales y plaz
FREE

El indicador muestra en el gráfico las estadísticas de negociación de la señal de Mercado analizada. Los datos de las transacciones de la señal se presentan en un archivo excel (csv) y se pueden tomar de Señal>Historial de operaciones ( Exportar a CSV: Historial ). El archivo copiado debe guardarse en el directorio MT4>Archivo>Abrir carpeta de datos>MQL4>Archivos. Gestión de colores y salida de fuentes disponibles. Si los nombres de las divisas son diferentes en las cuentas de Señal y Usuario, u
FREE

Se trata de un indicador de seguimiento de tendencias que identifica puntos de entrada óptimos en la dirección de una tendencia con un stop loss objetivo para gestionar la operación. El indicador le permite captar la tendencia a tiempo y seguirla. El indicador traza una línea de resistencia cuando detecta una tendencia alcista y una línea de soporte cuando detecta una tendencia bajista en el gráfico. Cuando se rompen esos niveles, le permite identificar la dirección de la tendencia y el impulso
FREE

Descripción Indicador de color para colorear el estado de ánimo del mercado del gráfico de línea en la ventana del instrumento financiero principal. Es útil para buscar las líneas de apoyo y resistencia. Utilidad El indicador puede utilizarse tanto para el comercio manual, como el automático en la composición del asesor. Para el comercio automático se pueden usar los índices de los búfers de indicador del tipo double : la línea creciente - búfer 0, no debe ser igual a EMPTY_VALUE. la línea de
FREE

El Asistente de Opciones Binarias (BOA) ICE Signals Indicator proporciona señales basadas en la estrategia de opciones binarias gkNextLevel. Indicadores: 2 Bandas de Bollinger & Estocástico
¡Deje de perder operaciones, deje de saltar de gráfico en gráfico buscando configuraciones de operaciones y obtenga todas las señales en 1 gráfico! Utilice cualquiera de los Indicadores de Señales BOA con el Panel de Múltiples Divisas del Asistente de Opciones Binarias (BOA ).
Todos los ajustes del Indica
FREE

El bloque de barras se recoge en condiciones de convergencia . Si no se cumplen las condiciones de convergencia, se elimina el bloque. Más concretamente, la condición es la transición del bloque de barras del estado de convergencia al estado de divergencia . Los bloques se forman selectivamente con huecos. Los huecos se caracterizan por el estado de divergencia de las barras. Antes de eliminar el bloque, encontramos las barras extremas dentro del bloque ( mín, máx). La línea une las barras extr
FREE

please leave 5 stars to me Un nivel de soporte es un nivel en el que el precio tiende a encontrar apoyo a medida que cae. Esto significa que es más probable que el precio "rebote" en este nivel en lugar de atravesarlo. Sin embargo, una vez que el precio ha superado este nivel, por una cantidad superior a cierto ruido, es probable que siga cayendo hasta encontrar otro nivel de soporte. Un nivel de resistencia es lo contrario de un nivel de soporte. Es donde el precio tiende a encontrar resistenc
FREE
MetaTrader Market - robots comerciales e indicadores técnicos para los trádres, disponibles directamente en el terminal.
El sistema de pago MQL5.community ha sido desarrollado para los Servicios de la plataforma MetaTrader y está disponible automáticamente para todos los usuarios registrados en el sitio web MQL5.com. Puede depositar y retirar el dinero a través de WebMoney, PayPal y tarjetas bancarias.
Está perdiendo oportunidades comerciales:
- Aplicaciones de trading gratuitas
- 8 000+ señales para copiar
- Noticias económicas para analizar los mercados financieros
Registro
Entrada
Si no tiene cuenta de usuario, regístrese
Para iniciar sesión y usar el sitio web MQL5.com es necesario permitir el uso de Сookies.
Por favor, active este ajuste en su navegador, de lo contrario, no podrá iniciar sesión.