Indicadores técnicos para MetaTrader 4 - 25
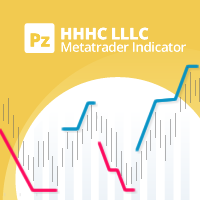
Una implementación personal de un famoso principio de tendencia conocido como higher high, higher close, lower low, lower close (HHHC - HHHL). Utiliza únicamente la acción del precio para determinar la dirección de la tendencia, los cambios de tendencia y las zonas de retroceso. [ Guía de instalación | Guía de actualización | Solución de problemas | FAQ | Todos los productos ] Periodo de ruptura personalizable Colores y tamaños personalizables No repinta ni retropinta Implementa alertas de todo
FREE
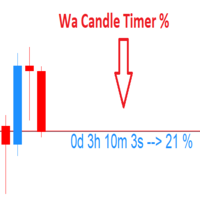
Wa Candle Timer Percentage MT4 es un indicador que muestra al usuario cuánto tiempo queda hasta que se forme la siguiente vela. También se muestra el porcentaje de la evolución de la vela actual. El usuario puede establecer el porcentaje que el temporizador de velas cambiará de color. Estos son los ajustes: 1- El porcentaje en que el temporizador de velas cambiará de color. 2- Color de la vela cuando está POR DEBAJO del porcentaje establecido por el usuario. 3- Color de la vela cuando está POR
FREE

MA MTF Overlay Chart es un software que permite superponer el gráfico de velas de un instrumento financiero con un segundo gráfico de velas del mismo, o de otro, instrumento financiero, estableciendo un marco temporal diferente al del gráfico básico. El software es muy sencillo de utilizar y los parámetros de entrada se indican a continuación.
Parámetros de entrada: Configuración del gráfico de superposición Instrumento financiero : instrumento financiero que desea superponer en el gráfico base
FREE

Estocástico con Filtro de Tendencia: Señales de Precisión Este es un indicador potente y fácil de usar diseñado para operadores que desean señales más fiables del oscilador estocástico clásico. Cómo funciona: Este indicador mejora el Estocástico estándar añadiendo un potente filtro de tendencia. Utiliza una Media Móvil Exponencial (EMA) para determinar la dirección general del mercado. El indicador sólo generará una señal de "compra" cuando el cruce del estocástico sea alcista y el precio esté p
FREE
¡Desbloquee el trading de alta confianza con Flash Signal! ¿Cansado de señales que aparecen demasiado tarde o se repiten? El indicador Flash Signal: El indicador EMA-Stoch System está diseñado para ofrecer entradas comerciales filtradas y oportunas, transformando el complicado análisis del mercado en flechas de compra y venta claras y procesables. ¡Deje de adivinar y empiece a operar con convicción! Ventajas clave: Por qué necesita Flash Signal Calidad filtrada: No se trata de un simple cruce d
FREE

Este asesor experto no realiza ninguna operación, pero escanea todos los símbolos en su reloj de mercado y escanea cada acción una por una en diferentes marcos de tiempo y al final le muestra qué símbolo en qué marco de tiempo tiene una poderosa vela envolvente.
Además, puede definir un período MA y un límite RSI alto y bajo, y le muestra qué símbolos en qué período de tiempo cruzarán el promedio móvil ajustado, y qué símbolo en qué período de tiempo cruzarán el límite alto o bajo del RSI.
FREE
¡Domine el mercado con el indicador Laguerre Edge Signal! ¡Deje de adivinar y empiece a operar con confianza! Nuestro indicador Laguerre Edge es la herramienta definitiva para detectar puntos de entrada de alta probabilidad. Este indicador combina la potencia de dos métodos de análisis clásicos: las medias móviles para la dirección de la tendencia y el RSI de Laguerre para detectar los retrocesos, todo ello filtrado por la sólida línea de tendencia EMA 200 . Está diseñado para ofrecerle señales
FREE
Libere todo el potencial de su estrategia de negociación con el indicador Dynamic Range Breaker . Esta herramienta esencial está diseñada para señalar puntos de inflexión significativos en el mercado y fuertes continuaciones de tendencia, dándole la claridad y la confianza para actuar. El indicador Dynamic Range Breaker se centra en identificar "rupturas" claras de los puntos máximos y mínimos anteriores, señalando cuándo el mercado está listo para realizar un movimiento decisivo. Olvídese de la
FREE
El LWO es una herramienta que indica eficazmente el final de las tendencias. Al ser un oscilador, tiene valores entre 0 y 100, definiendo las zonas de hiperventa y las de hipercompra. Su eficacia se debe a la ponderación de los precios al final de los períodos individuales en una escala logarítmica; esto le permite tener una percepción de la voluntad del mercado.
Los parámetros
El indicador sólo tiene 2 valores ajustables, el periodo y el factor de suavidad.
El periodo indica cuántas barras se
FREE

El Indicador Wave Rider: Su clave para operar con confianza ¿Cansado de intentar adivinar los movimientos del mercado? El indicador Wave R ider es su solución. Es una herramienta inteligente diseñada para ayudarle a detectar tendencias rentables con facilidad y confianza. ¿Por qué es tan potente? Vea las tendencias con claridad : Wave Rider simplifica los complejos datos del mercado, para que pueda identificar fácilmente la dirección de la tendencia y tomar decisiones más inteligentes. Obtenga
FREE

Este indicador semáforo se basa en el RSI estándar, que se aplica sobre el indicador Envelopes que muestra una envolvente o bordes de fluctuación de envolvente. Esta es una versión del gráfico RSI vs Envelopes dibujado en una ventana separada . Una señal de venta emerge cuando la envolvente/borde superior es rota por el indicador RSI de arriba hacia abajo. Una señal de compra surge cuando la envolvente/frontera inferior es rota por el indicador RSI de abajo hacia arriba. El indicador puede dibuj
FREE
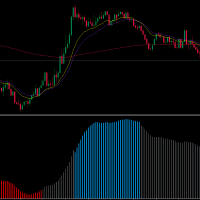
Bienvenido trader, MA SLOPE SCALPER es una herramienta realmente poderosa para mejorar tu scalping. ¿Ha estado luchando con sus estrategias de scalping? ¿Ha intentado la acción del precio? Bueno, no funciona. ¿Ha intentado Rsi - Estrategias de reversión? Bueno, no es una idea inteligente. MA SLPOPE SCALPER ES UN SISTEMA SEGUIDOR DE TENDENCIA MA SLOPE SCALPER se basa en 3 medias móviles exponenciales diferentes que han sido estudiadas y seleccionadas en orden para maximizar la precisión de las s
FREE

Título del producto Smart Bulls (MT4) – parte de la serie SmartView Indicators Descripción breve Indicador Bulls con una experiencia de usuario única en la plataforma MetaTrader. Ofrece capacidades avanzadas no disponibles anteriormente, como abrir configuraciones con doble clic, ocultar y mostrar indicadores sin eliminarlos, y mostrar la ventana del indicador a tamaño completo del gráfico. Diseñado para funcionar perfectamente con el resto de la serie SmartView Indicators. Visión general La ser
FREE

Título del producto Smart RSI (MT4) – parte de la serie SmartView Indicators Descripción breve Indicador RSI con una experiencia de usuario única en la plataforma MetaTrader. Ofrece capacidades avanzadas no disponibles anteriormente, como abrir configuraciones con doble clic, ocultar y mostrar indicadores sin eliminarlos, y mostrar la ventana del indicador a tamaño completo del gráfico. Diseñado para funcionar perfectamente con el resto de la serie SmartView Indicators. Visión general La serie S
FREE

Este escáner monitoriza todo el mercado en busca de oportunidades de negociación para todos los símbolos y para todos los plazos. Usted no tiene que mirar todos los gráficos, para todos los símbolos y para todos los marcos de tiempo. Este escáner le avisará en su ordenador, o en su móvil, cuando se haya encontrado una oportunidad de comercio. Usted nunca tiene que perder una oportunidad de comercio! Este indicador está diseñado para escanear todos los pares y símbolos, para todos los marcos de t
Historial de versiones : Fecha Versión Cambios 6/20/2022 1.00 Versión inicial 6/21/2022 1.10 Adición de variables globales para los volúmenes históricos mínimo (SYMBOL_volume_min) y máximo (SYMBOL_volume_max) Descripción : RedeeCash Volumes Indicator es el indicador de volúmenes en el que ha llegado a confiar para la entrada y salida del mercado con la ventaja añadida de exponer métricas clave como variables globales. La inclusión de variables globales en un indicador permite una interacción más
FREE

A veces un trader necesita saber cuando se cerrará una vela y aparecerá una nueva para tomar las decisiones correctas, este indicador calcula y muestra el tiempo restante de la vela actual . Es fácil de usar, basta con arrastrarlo en el gráfico. Por favor, utilice y expresar su opinión, expresar sus opiniones promoverá los productos. Para ver otros productos gratuitos, por favor visite mi página .
FREE

El YK-LOT-SIZE es un indicador que muestra el tamaño total del lote y el beneficio/pérdida de todas las órdenes comerciales para el símbolo actual en el gráfico de precios. Tiene las siguientes características: Muestra el Tamaño de Lote total de las órdenes de compra (COMPRA) y las órdenes de venta (VENTA) en líneas separadas. Muestra la ganancia/pérdida de las órdenes de compra (COMPRA) y venta (VENTA) calculando la suma de ganancia, comisión y swap. Los usuarios pueden personalizar el color de
FREE

¿Qué es G Force Trend? G Force Trend es un indicador de análisis técnico desarrollado para la plataforma MetaTrader 4. Analiza los movimientos de los precios para identificar la dirección de la tendencia y genera señales de compra/venta. El indicador crea un canal dinámico para seguir el comportamiento del precio dentro del canal y visualiza los cambios de tendencia. ¿Qué hace? Detección de la tendencia : Determina si el precio se encuentra en una tendencia alcista o bajista. Señales de Compra/V
FREE
** Todos los Símbolos x Todos los Plazos escanean con sólo pulsar el botón del escáner ** *** Contacta conmigo para enviarte instrucciones y añadirte en "RSI scanner group" para compartir o ver experiencias con otros usuarios.
Introducción La divergencia RSI es una técnica principal utilizada para determinar la inversión de la tendencia cuando es el momento de vender o comprar porque es probable que los precios bajen o suban en los gráficos. El indicador de Divergencia RSI puede ayudarle a loc

Este escáner muestra los valores de tendencia del conocido indicador SuperTrend para hasta 30 instrumentos y 8 marcos temporales. Puede recibir alertas vía MT4, Email y Push-Notification tan pronto como la dirección de la tendencia cambie. Esta es la versión GRATUITA del indicador: SuperTrend Scanner ¡La versión gratuita sólo funciona en EURUSD y GBPUSD!
Información importante Cómo puede maximizar el potencial del escáner, por favor lea aquí: www.mql5.com/en/blogs/post/718074
Con el siguiente
FREE
El indicador puede utilizarse con cualquier marco temporal y par de divisas. Un parámetro fácil de usar en el indicador le permitirá adaptar las señales a cualquier par de divisas y marco de tiempo que desee operar.
¡Las flechas NO SE REPITEN !
Panel de Información: Hemos equipado este indicador con un panel fácil de usar. A un lado del panel, se muestra el marco temporal, mientras que al otro lado, se muestra el par de divisas. Debajo, se identifica la dirección de la tendencia, mostrando si
Indicador RSI altamente configurable. Características: Funciones de alerta altamente personalizables (en niveles, cruces, cambios de dirección vía email, push, sonido, popup). Capacidad multi timeframe Personalización del color (en niveles, cruces, cambios de dirección) Opciones de interpolación lineal y modo de histograma Funciona en el probador de estrategias en modo multi timeframe (también en fin de semana sin ticks) Niveles ajustables Parámetros:
RSI Timeframe: Puede establecer el timefram
FREE

El indicador encuentra patrones de velas basado en Gregory L.' Morris "Candlestick Charting Explained: Timeless Techniques for Trading Stocks and Futures". Si se detecta un patrón, el indicador muestra un mensaje al cierre de una barra. Si opera con el terminal MetaTrader 5, puede descargar el análogo completo del indicador "Candle Pattern Finder for MT5 ". Reconoce los siguientes patrones: Alcista/bajista (posibles configuraciones entre paréntesis) : Martillo / Estrella fugaz (con o sin confirm

El indicador Multi Trendlines dibuja automáticamente las líneas de tendencia dominantes en el gráfico actual. El indicador busca las 5 mejores tendencias alcistas y las 5 mejores tendencias bajistas en el precio actual, dibujando cada línea de tendencia si se cumplen las condiciones del filtro. Las líneas de tendencia se denominan "Trendline "+[Direction]+Symbol()+TrendlineSequenceNumber Por ejemplo: La segunda línea de tendencia alcista en un gráfico EURUSD se llamaría "TrendlineUpEURUSD2". Par
FREE

El indicador define la barra envolvente alcista y bajista. El patrón tiene mayor fiabilidad cuando el precio de apertura de la vela envolvente está muy por encima del cierre de la primera vela, y cuando el cierre de la vela envolvente está muy por debajo de la apertura de la primera vela. Para que una barra envolvente sea válida, debe envolver completamente al menos una barra o vela anterior, lo que incluye todo el cuerpo y la mecha. La barra envolvente puede envolver más de una barra siempre qu
FREE

Un indicador para visualizar los rangos temporales de las principales sesiones bursátiles: Asiática, Europea y Americana. El indicador dispone de funciones para establecer las horas de inicio y fin de cada sesión de negociación, así como una zona horaria ajustable del servidor de negociación. Las principales ventajas del indicador incluyen la capacidad de funcionar con una carga de CPU y un uso de memoria mínimos. Además, ofrece la opción de especificar el número de días históricos mostrados, pr
FREE

Un simple indicador de información que muestra el tiempo que falta para la apertura de la siguiente vela o barra.
Sobre el concepto de timeframe Un marco temporal es el intervalo de tiempo considerado en el análisis técnico de los mercados financieros libres (lo mismo se aplica al mercado mundial de divisas), durante el cual cambian el precio y otros datos del mercado. El marco temporal más pequeño es el denominado tick. Un marco temporal es el intervalo de tiempo utilizado para agrupar las cot
FREE
Flechas de Entrada de Precisión: ¡No vuelva a perderse una operación de alta probabilidad! Deje de adivinar y empiece a operar con confianza. El indicador Precision Entry Arro ws es una sofisticada herramienta todo en uno diseñada para ofrecer señales de compra y venta de alta calidad y sin repintado directamente en su gráfico. Combina de forma experta el poder del MACD , el Estocástico y una Cruz EMA 5 única para señalar los momentos exactos de entrada , y luego filtra todo a través de una EMA
FREE

Este escáner monitoriza todo el mercado en busca de oportunidades comerciales Ichimoku para todos los símbolos y para todos los marcos temporales. Usted no tiene que mirar a todos los gráficos, para todos los símbolos y para todos los marcos de tiempo. Este escáner le avisará en su ordenador, o en su móvil, cuando se haya encontrado una oportunidad de comercio. Usted nunca tiene que perder una oportunidad de comercio! Este indicador está diseñado para escanear todos los pares y símbolos, para to
Alertas de reducción ¡Gratis ! Indicador Meta Trader 4. Por favor, deje un comentario sobre este producto para ayudar a otros usuarios a beneficiarse de él. Este indicador de Alertas de Drawdown muestra el porcentaje de drawdown en tiempo real y le avisa cuando se alcanza el límite que usted especifique. El cálculo del Drawdown depende del importe del saldo de la operación. Puede personalizar las Alertas de Drawdown para Esquina - Izquierda , Derecha , Arriba , Abajo X Y Color Número de dígitos
FREE

Al instalar el indicador en el gráfico, es necesario crear una línea de tendencia con el nombre especificado en el campo "Unique name of trend line to place fib on". Por defecto el nombre=" Nombre único de la línea de tendencia para colocar fib on" = "+" .En el indicador puede sustituir los niveles de Fibonacci a su discreción.también cambiar el color, el estilo, el grosor de las líneas, etc.
FREE

El indicador MACD col oreado es una herramienta versátil y potente diseñada para mejorar su análisis técnico proporcionando una visualización intuitiva del impulso del mercado y los cambios de tendencia. Construido sobre la base del popular indicador MACD (Moving Average Convergence Divergence), esta versión introduce histogramas codificados por colores para distinguir fácilmente entre impulso alcista y bajista. Características principales: Visualización codificada por colores : El indicador pre
FREE

ES GRATIS Recomiendo www.CoinexxBroker.com como un gran corredor y el que yo personalmente uso Asia sesión 1:00 a 9:00 (6pm est a 2 am est) Eur significa Londres Sesión 10:00 a 18:00 (3 am est a 11 am est) USA significa Sesión de Nueva York 15:00 a 23:00 (8 am est a 4 pm est) El indicador de sesión resalta el inicio de cada sesión de negociación. Puede mostrar todas las sesiones o editar la configuración para mostrar sólo las horas que desea resaltar (Asia) significa Sesión Asiática ,(Eur) signi
FREE
El indicador Free Pro Level está diseñado para la construcción automática de niveles de soporte y resistencia. Ventajas del indicador: adecuado tanto para operadores experimentados como para principiantes; fácil de utilizar; los niveles no se redibujan la probabilidad de reacción del precio al tocar el nivel es superior al 80%; gratuito. El indicador gratuito Pro Level tiene sólo 5 puntos de parámetros de entrada: Duración mínima de la vela en puntos de 5 dígitos - el parámetro principal en base
FREE

El indicador CYCLE WAVE OSCILLATOR es un indicador basado en las fluctuaciones cíclicas de los precios. Este indicador puede ayudarle a determinar los niveles de sobrecompra y sobreventa, y ayudarle a predecir las tendencias de los precios dentro del ciclo. ¡Versión MT5 aquí! Puede combinarlo con nuestros indicadores a continuación para que sus decisiones de trading sean más precisas: Cinta Oferta Demanda MT4 Básico
Características: - Tres Tipos de Tendencia: + Cero + Básica + Avanzada
FREE

Este indicador de escáner de tendencia utiliza dos indicadores principales para identificar tendencias. En primer lugar, las EMA proporcionan una visión del impulso alcista/bajista. Cuando la EMA más corta (calculada a partir de la acción del precio más reciente) cruza, o está por encima, de la EMA más lenta (calculada a partir de un período más largo de acción del precio), sugiere que el mercado está en una tendencia alcista. En segundo lugar, el estocástico RSI. Cuando el RSI es inferior a 20
FREE
Tablero de Estrategias Range-Bound & Reversal (MT4) Opere reversiones limpias con confianza.
Este indicador MT4 escanea 20 instrumentos principales en tiempo real y señala las oportunidades de rango de alta probabilidad y de reversión de la media, y luego lo muestra todo en un panel de control sencillo y profesional. Por qué a los operadores les encanta 10 configuraciones probadas en una sola herramienta
Rebote de soporte/resistencia, reversión a la media de Bollinger, OB/OS del RSI, giro del MA
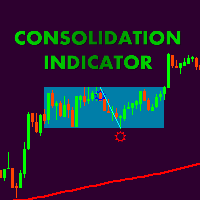
Сonsolidation caja indicador con posibilidad de ajustes flexibles de acuerdo a los traiders requipments. Además, es posible incrustar indicatior en EA. Gracias Alexey Mavrin para la realización de la tarea técnica. De acuerdo con el análisis técnico clásico el precio está en movimiento sin una dirección clara para casi el 70% del tiempo de mercado y los métodos de obtener beneficios de plano debe estar en el arsenal de cualquier comerciante. Consolidación de precios - son periodos de equilibrio
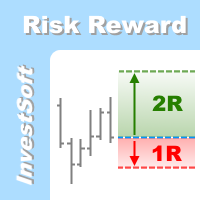
Esta es la herramienta de órdenes visuales forex y calculadora de tamaño de posición forex (lote) con panel intuitivo. Risk Reward Ratio Indicator funciona en todo tipo de símbolos: pares de divisas, índices, metales, materias primas, criptomonedas, etc.
Si desea asegurarse de que Risk Reward Ratio Indicator funciona en sus símbolos favoritos, póngase en contacto con nosotros (visite nuestro perfil ) y solicite una prueba gratuita de 7 días para probar esta herramienta sin límites. ¿Si quiere

Indicador (incluye Perfil de Volumen + Bloques de Órdenes ) - un indicador revolucionario que combina dos de los conceptos más potentes del análisis técnico moderno: los perfiles de volumen y los bloques de órdenes de los operadores institucionales. Esta herramienta le permite ver lo que está oculto para la mayoría de los operadores y le proporciona una ventaja significativa en el mercado.
Principales ventajas del indicador: Visualización del "dinero inteligente": Muestra claramente las áreas d
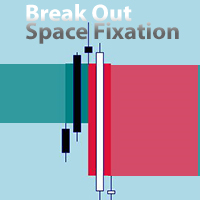
Se está preparando una versión EA. Usted puede enviar un mensaje privado "notificar acerca de la versión EA".
EA será versátil con muchos ajustes para el comercio en varios indicadores. El nuevo EA también permitirá el comercio en este indicador. Por ejemplo, permitiendo señales después de X señales/barras a X señales/barras en una dirección, antes de cambiar de dirección. Si el Break Out ocurrió antes/después de la señal de otro indicador. Recoger beneficios en cada siguiente señal por encima
FREE

" Los sentimientos de los operadores" en los mercados financieros es un tema que nos interesa desde hace mucho tiempo. Con el tiempo, no conseguíamos encontrar la fórmula adecuada para definir estos sentimientos. Pasamos por muchas etapas en la búsqueda de la metodología adecuada: desde tomar datos de fuentes externas para calcular las posiciones abiertas de compradores y vendedores hasta calcular los volúmenes de ticks, pero seguíamos sin estar satisfechos con los resultados. El cálculo de las

Este indicador es una versión independiente de MP Pivot Levels (All in one) que contiene Demark's Pivots.
Cálculos: PP = X / 4 R1 = X / 2 - LOWprev S1 = X / 2 - HIGHprev Usos: Cuando el precio del par de divisas puede cambiar la dirección del movimiento. Posibles restricciones de soporte y resistencia que crean mesetas para los precios del par de divisas. Identificación de tendencias comparando los precios actuales según el punto pivote del día actual y también los puntos pivote del día anterior
FREE
Por favor, lea antes de comprar : - No tenemos detalles del comprador cuando se hizo la compra. Con el fin de obtener los bonos, es necesario ponerse en contacto conmigo a través de comentario del producto (no revisión del producto). De esa manera me pondré en contacto con usted a través de mensaje mql pidiendo correo electrónico. - Por favor, asegúrese de habilitar la recepción de mensajes de la lista de no amigos, de lo contrario no puedo mensaje de correo electrónico. Este indicador no es sól
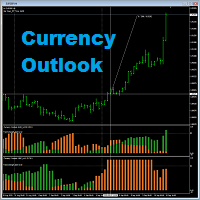
Currency Outlook es un indicador que nos puede ayudar a "Operar el par correcto en la dirección correcta y en el momento adecuado". Este indicador analiza los precios de todos los pares de divisas cruzados de la divisa seleccionada y nos informa del resultado en forma de diagrama de histograma de dos colores. La altura máxima del diagrama del histograma del indicador es 100. El indicador está programado exclusivamente para AUD, CAD, CHF, EUR, GBP, JPY, NZD y USD. Puede trabajar en cualquier marc
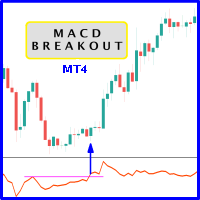
Surge la probabilidad de registrar precios más altos cuando MACD rompe el nivel de resistencia histórico del oscilador. Se recomienda encarecidamente confirmar la ruptura del precio con la ruptura del oscilador, ya que tienen efectos comparables a la ruptura de los niveles de soporte y resistencia del precio; seguramente, las operaciones cortas tendrán la misma percepción. Como ventaja, muchas veces la ruptura del oscilador precede a la ruptura del precio como una alerta temprana de un evento pr
FREE

El sistema de análisis de indicadores ZhiBiJuJi utiliza un poderoso bucle interno para llamar a sus propios indicadores externos, y luego llama al análisis antes y después del ciclo. El cálculo de los datos de este sistema de análisis de indicadores es muy complicado (llamar antes y después del ciclo), por lo que se reduce la histéresis de la señal y se logra la precisión de la predicción de avance. Este indicador se puede utilizar en todos los ciclos en MT4, y es más adecuado para 15 minutos, 3

Este indicador es una herramienta sencilla para detectar una posible tendencia.
Cuando la cinta está por debajo de las barras de precios, se volverá de color verde y la tendencia se considera alcista. Cuando la cinta está por encima de las barras de precios, se volverá de color rojo y la tendencia se considera bajista. Se puede utilizar como señal de entrada Señal de salida o trailing stop, por lo que es muy versátil. El color por defecto es: Verde para tendencia alcista y Rojo para tendencia
FREE

Algo corto pero agradable que da señales y algunas ideas para las paradas. Se utilizan cinco medias móviles para encontrar cruces y crear una zona. Todos los periodos y métodos son ajustables pero los valores por defecto ya están optimizados. Si usted tiene retrasos en la historia larga puede reducir MaxBars para que funcione más rápido. Por favor comente si necesita explicar los parámetros. También cualquier idea de mejora son bienvenidos.
FREE

Use GANN 369 para usar una combinación de 30's,60's,90's tiempo para cruzar 3's,6's,9's. Cualquier combinación mayor de estas cruzan combinaciones menores de estas
Uso del método GANN 369 para operar con retrocesos El método GANN 369, inspirado en los trabajos de W.D. Gann y en los patrones numéricos 3, 6, 9 de Nikola Tesla, puede emplearse para identificar potenciales retrocesos en los mercados financieros. Combinando periodos específicos (30, 60 y 90) con los números 3, 6 y 9, los operadores
FREE

1. Propósito y datos del indicador Visión general El pronosticador de regresión lineal es un indicador analítico avanzado diseñado para realizar una evaluación exhaustiva de la tendencia y un pronóstico de precios a corto plazo utilizando el método estadístico de regresión lineal (LR) .
Está optimizado para el marco temporal semanal (W1) y combina tanto el análisis de tendencias a largo plazo como la dinámica de tendencias móviles a corto plazo para generar previsiones semanales fiables. El indi
FREE

"Gold Miner Robot" es un potente robot basado en IA diseñado y construido para analizar con precisión el mercado y el comercio de oro. Desarrollado por "Keyvan Systems" después de más de 3 años de investigación y desarrollo en cada tick del gráfico de oro. "Gold Miner Robot" utiliza un enfoque algorítmico complejo basado en el análisis de precios, análisis de tendencias. También hemos proporcionado otros dos indicadores personalizados llamados "GoldMinerRobot SI 1" y "GoldMinerRobot SI 2" para u
FREE
Cuadro de mandos potente con 28 símbolos y marcos temporales múltiples para una visión completa del mercado. Alertas personalizables de compra/venta, alertas push, alertas por correo electrónico y alertas visuales en pantalla. Señales de compra/venta marcadas Histograma de tendencia en dos colores. El índice de canal de materias primas (CCI) es un oscilador introducido originalmente por Donald Lambert en 1980. El CCI mide el nivel de precios actual en relación con un nivel de precios medio dura
FREE

Supreme Stoploss es un indicador para metatrader 4 que se basa en el indicador ATR , da stoploss/take profit como lineas dibujadas por encima y por debajo del precio , este indicador no repaint/back paint y no se retrasa. puede ser usado para determinar el stop loss o take profit de una operación usando el valor ATR multiplicado por el número establecido por el usuario. ====================================================================================================== Parámetros : Periodo ATR
FREE

Para los operadores, el seguimiento de los movimientos de los precios es una actividad constante, porque cada movimiento de los precios determina la acción que debe emprenderse a continuación. Este sencillo indicador ayudará a los operadores a mostrar los precios con mayor claridad y en un tamaño más grande. Los usuarios pueden configurar el tamaño de la fuente y elegir el color que se mostrará en el gráfico. Hay tres opciones de color que se pueden seleccionar para que se muestren en el gráfic
FREE

Indicador "Five Minute Drives" que está diseñado para ser utilizado en el marco temporal de 5 minutos. Una de sus ventajas más importantes es que muestra la tendencia general en los marcos temporales superiores cuando se mira el marco temporal de 5 minutos. Por lo tanto, al abrir posiciones en el marco de tiempo de 5 minutos, cuando está en línea con las tendencias en los marcos de tiempo superiores, es menos probable que esté al revés. Si puede evaluar las oportunidades de ruptura entre las cur
FREE

** Todos los símbolos x Todos los marcos de tiempo escanear con sólo pulsar el botón del escáner **. *** Contacta conmigo para enviarte instrucciones y añadirte en "Divergence group" para compartir o ver experiencias con otros usuarios. Introducción La divergencia MACD es una técnica principal utilizada para determinar la inversión de tendencia cuando es el momento de vender o comprar porque los precios son propensos a caer o recoger en los gráficos. El indicador de Divergencia MACD puede ayudar

Se trata de una implementación del indicador de ciclo de mercado descrito por Raghee Horner en el libro "Forex Trading for Maximum Profit" . El estado actual del mercado puede determinarse analizando el ángulo de inclinación de la media móvil exponencial (EMA) que se ejecuta en un periodo de 34 barras. Si la inclinación de la EMA se define como la dirección de la aguja horaria del dial de 12 a 2 horas, se considera que existe una tendencia alcista; de 2 a 4 horas, el mercado se consolida; de 4 a
FREE

Características:
- Pendiente de la media móvil para barras máximas pasadas - Periodo de Pendiente - Umbrales de pendiente - Múltiples opciones de Tipo de Pendiente - Ver la pendiente visualmente como un histograma - Mostrar/Ocultar panel de información Cálculos y tipos de pendiente:
El valor de la pendiente se calcula utilizando el Período de Pendiente. Suponga que el Período es 5, revisará el valor MA para la barra (x) y la barra (x+5). Y encontrará el ángulo de pendiente entre ellos.
Lea la
FREE
Simulador para la calculadora del ratio Riesgo / Recompensa We-RiskReward es un indicador MT4 hecho por el equipo de We-Trading para simular una orden con la calculadora de Riesgo / Recompensa.
Líneas Horizontales Este indicador te muestra 3 líneas horizontales que son: Línea de apertura Línea Take Profit Línea de Stop Loss Puedes mover las líneas y verás el cálculo de R/R y Lotes en tiempo real. Puede utilizarlo para simular posiciones Largas y Cortas.
Parámetros del indicador Como parámetros
FREE
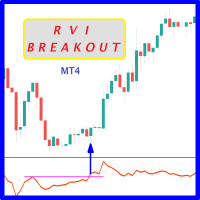
Surge la probabilidad de registrar precios más altos cuando el RVi rompe el nivel de resistencia histórico del oscilador. Se recomienda encarecidamente confirmar la ruptura del precio con la ruptura del oscilador, ya que tienen efectos comparables a la ruptura del precio de los niveles de soporte y resistencia; sin duda, las operaciones cortas tendrán la misma percepción. Como ventaja, muchas veces la ruptura del oscilador precede a la ruptura del precio como alerta temprana de un evento próximo
FREE

Market Calculator es una potente herramienta que le permite calcular fácil y rápidamente los principales parámetros de una operación: Tamaño del lote, StopLoss y TakeProfit, así como estimar la cantidad de fondos (Margen requerido) para abrir una posición. El programa tiene un control muy cómodo e intuitivo, porque implementado en el estilo de OS Windows. Hay muchas características interesantes y útiles - sólo ver el video: youtu.be/FG2qqTJTIhE Todos los datos del programa se clasifican en secci

El tablero de patrones de triángulos simétricos le permite monitorear múltiples mercados y marcos de tiempo a la vez para patrones de triángulos simétricos como lo dibuja el indicador de patrón de triángulos simétricos disponible aquí: https://www.mql5.com/en/market/product/68709/ Visite el indicador anterior para obtener más información sobre cómo se forman los patrones de triángulos simétricos y las estrategias fáciles de seguir para operar con ellos.
El tablero es un producto independiente

¡Desbloquee un trading más inteligente con Triple Candle Trend! Deje de perseguir señales y empiece a operar con confianza y confluencia . El indicador Triple Candle Trend es su sistema todo-en-uno diseñado para cortar el ruido del mercado y ofrecer puntos de entrada de alta probabilidad. No nos basamos en un único factor; ¡combinamos el poder de tres herramientas de confirmación en una señal clara! Por qué necesita este indicador: Filtre el ruido, encuentre la tendencia: Este sistema utiliza l
FREE
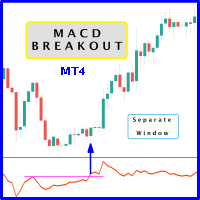
Surge la probabilidad de registrar precios más altos cuando el MACD rompe el nivel de resistencia histórico del oscilador. Se recomienda confirmar la ruptura del precio con la ruptura del oscilador, ya que tienen efectos comparables a la ruptura del precio de los niveles de soporte y resistencia; sin duda, las operaciones cortas tendrán la misma percepción. Como ventaja, muchas veces la ruptura del oscilador precede a la ruptura del precio como alerta temprana de un evento próximo, como se ilust
FREE

Filtro Range - BreakOut EA
¿Qué es el filtro Range? El Filtro de Rango es una herramienta innovadora diseñada para suavizar el ruido del mercado y resaltar los movimientos significativos de los precios. En lugar de centrarse en cada pequeña fluctuación, el Filtro de Rango elimina la actividad insignificante, permitiendo a los operadores ver las tendencias con mayor claridad. La idea procede del filtro de volatilidad del QQE, pero en lugar de aplicarlo al RSI, este enfoque se aplica directamente
FREE

Esta poderosa herramienta le ayuda a acceder fácilmente a las herramientas de Fibonacci en diferentes momentos y en diferentes mercados. Esta herramienta tiene la capacidad de enviar señales basadas en Fibonacci, así como establecer alarmas para estar al tanto de los niveles de Fibonacci rotos. Entre las capacidades de esta herramienta se encuentran las siguientes:
Identifica las tendencias del mercado Diseño automático de Fibonacci Si se rompen los niveles de Fibonacci, envía un mensaje Envía
FREE

FTU Fibonacci Este indicador dibuja niveles de Fibonacci para sistemas de entrada de tipo retroceso ** Vea el video para obtener sugerencias de estrategia Características: Múltiples niveles de Fibonacci ajustables Cambie el color y la cantidad de barras del rango 2 líneas para 50 barras de retroceso máximo-mínimo anterior y 2 líneas para 20 barras Las líneas muestran los niveles de Fibonacci 38 y 61 Uso: El propósito es estudiar o medir el retroceso de precios Cambie el color y la cantidad de b
FREE
Indicador Volume Profile Pro Este indicador es la herramienta Volume Profile Pro , que ayuda a analizar "en qué precio ocurre la mayor actividad comercial". Cuenta con las siguientes características especiales: Modos de Visualización (Display Modes) Volume Profile (Normal): Muestra el volumen total de operaciones (Total Volume) en cada nivel de precios para identificar zonas clave de soporte y resistencia. Delta / Money Flow: Muestra la "diferencia" entre la presión de compra y venta (Buy vs Sel
El Mercado MetaTrader es la única tienda donde se puede descargar la versión demo de un robot comercial y ponerla a prueba, e incluso optimizarla según los datos históricos.
Lea la descripción y los comentarios de los compradores sobre el producto que le interese, descárguelo directamente al terminal y compruebe cómo testar el robot comercial antes de la compra. Sólo con nosotros podrá hacerse una idea sobre el programa, sin pagar por ello.
Está perdiendo oportunidades comerciales:
- Aplicaciones de trading gratuitas
- 8 000+ señales para copiar
- Noticias económicas para analizar los mercados financieros
Registro
Entrada
Si no tiene cuenta de usuario, regístrese
Para iniciar sesión y usar el sitio web MQL5.com es necesario permitir el uso de Сookies.
Por favor, active este ajuste en su navegador, de lo contrario, no podrá iniciar sesión.