Indicadores técnicos para MetaTrader 4 - 8
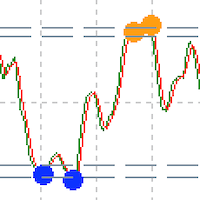
Custom Relative Strength Indicator with multiple timeframe selection About RSI The relative strength index is a technical indicator used in the analysis of financial markets. It is intended to chart the current and historical strength or weakness of a stock or market based on the closing prices of a recent trading period. Features
Indicator gives alert when reached oversold or overbought levels Gives dot indication while reaching levels. Can set indicator bar alert intervals for alerts Can choos
FREE
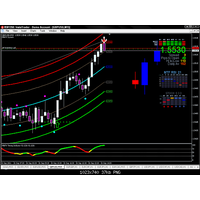
Gravity Timing Indicator -GTI-
El indicador GTI es el indicador más fácil y preciso hasta el momento. Utiliza soporte y resistencia de forma gravitacional. Trabajar en él es muy fácil, consta de 7 líneas, las más poderosas de las cuales son las líneas más baja y más alta, así que cuando el indicador rebota, es el mejor momento para entrar.
funciona en todos los pares sin excepción
para el marco de tiempo, prefiero marcos de tiempo pequeños como 5 minutos y 15 minutos para reventa.
FREE

Royal Wave es un oscilador Trend-Power que ha sido programado para localizar y señalar zonas de entrada y salida de bajo riesgo. Su algoritmo central analiza estadísticamente el mercado y genera señales de trading para zonas de sobrecompra, sobreventa y baja volatilidad. Mediante el uso de un sistema de alertas bien diseñado, este indicador facilita la toma de decisiones adecuadas con respecto a dónde entrar y dónde salir de las operaciones. Características Algoritmo Trend-Power Zonas de Entrada

Este tablero es una herramienta de alerta para usar con el indicador de reversión de la estructura del mercado. Su propósito principal es alertarlo sobre oportunidades de reversión en marcos de tiempo específicos y también para volver a probar las alertas (confirmación) como lo hace el indicador. El tablero está diseñado para ubicarse en un gráfico por sí solo y funcionar en segundo plano para enviarle alertas sobre los pares y marcos de tiempo elegidos. Fue desarrollado después de que muchas p
GRATIS Heiken Ashi Smoothed indicador es totalmente ajustable, fácil de usar y viene con la posibilidad de acceder al indicador a través de la función iCustom para que pueda utilizarlo en su propio software de comercio. El indicador también puede mostrar alertas cuando la señal cambia o enviar notificaciones push. Para la versión Metatrader 5 haga clic aquí: https: //www.mql5.com/en/market/product/70825 Para obtener información detallada, haga clic: >>AQUÍ<< Características
Fácil de utilizar A
FREE

¿Qué indicador mira más en sus gráficos MT4? No creo que las líneas de cuadrícula predeterminadas en los gráficos de MT4 -que probablemente vea cientos o miles de veces- estén diseñadas con la intención de ayudar al usuario a ganar. Esta es la razón por la que los usuarios de MT4 aplican varios indicadores y pasan por ensayo y error. Dado que es un gráfico que se mira todos los días, debe presentar información fiable que los humanos podamos reconocer intuitivamente. Este indicador nació de un ú
Título del producto ZigZag Colored (MT4)
See also >> Smart ZigZag Pro , Smart ZigZag (free)
Descripción breve ZigZag bicolor para MT4 que resuelve la limitación de color único y ofrece buffers para EA con valor y dirección de la pierna actual en cada barra. Visión general Presenta el ZigZag clásico como dos piernas separadas y codificadas por color; valores por barra expuestos para EAs/indicadores. Características clave Piernas de dos colores; buffers ZigZag Up , ZigZag Down , ZigZag Per
FREE

El Indicador de Tendencia Omega es una herramienta avanzada que ha sido diseñada específicamente para detectar las tendencias del mercado con antelación, y seguirlas con eficacia. El indicador traza dos líneas. La línea de tendencia principal (más gruesa) representa los supuestos límites inferior o superior de volatilidad de la tendencia actual del mercado. Una ruptura en la Línea de Tendencia principal indica una posible inversión o cambio en el movimiento de la tendencia. La línea de tendencia
FREE
indicador de contador de velas este indicador cuenta las velas que están en el gráfico de cualquier período de tiempo una barra de barra gratis para descargar en mt4 el contador de barras cuenta cuántas velas hay dentro de un gráfico más grande con este contador de candles puedes hacer el conteo automático de velas Indicador de conteo de velas gratis para que descargues y cuentes las barras automáticamente bar counter to count the bars count candle counter indicator mt4 count candle contador de
FREE

Esta herramienta le da la oportunidad de mostrar los niveles de soporte y resistencia de los puntos pivote, así como los niveles de apertura diaria, cierre semanal y cierre mensual en su gráfico con altos niveles de personalización.
Los puntos pivote son importantes niveles horizontales de soporte y resistencia que se calculan utilizando el precio máximo, mínimo y de cierre del periodo anterior (por ejemplo D1). Con este indicador, puede elegir entre plazos horarios y mensuales para basar el c
FREE
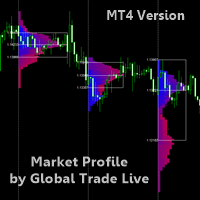
LEA LA DESCRIPCIÓN ES IMPORTANTE - SÓLO TOMA 2 MINUTOS - ESTO ES UNA HERRAMIENTA NO UNA ESTRATEGIA DE NEGOCIACIÓN
Perfil de Mercado de Global Trade Live Un Perfil de Mercado es una representación gráfica que combina información de precio y tiempo en forma de distribución. Un perfil de mercado se utiliza para determinar el tiempo transcurrido, el número de ticks y los volúmenes negociados a precios específicos, o en un intervalo de precios, durante un periodo determinado. Un Perfil de Mercado t
FREE

Presentamos Order Blocks Breaker , una nueva forma de identificar y aprovechar los bloques de órdenes en su estrategia de trading. Después de desarrollar múltiples herramientas de bloques de órdenes con conceptos únicos, estoy orgulloso de presentar esta herramienta que lleva las cosas al siguiente nivel. A diferencia de las herramientas anteriores, Order Blocks Breaker no sólo identifica los bloques de órdenes, sino que también destaca los Breaker Order Blocks, áreas clave donde es probable que
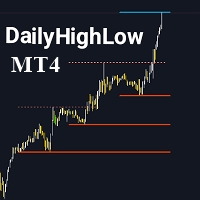
Por favor, no olvides calificar el indicador para ayudarme con la visibilidad. El indicador DailyHighLow está diseñado específicamente para la plataforma MetaTrader 4 (MT4) y tiene como objetivo ayudar a los traders a seguir las fluctuaciones diarias de precios. Este indicador traza automáticamente líneas de tendencia basadas en los precios más altos y más bajos de un período personalizado, proporcionando una asistencia visual clara para los traders que necesitan información precisa del mercado
FREE

Advanced Reversal Hunter Pro (ARH) es un potente e innovador indicador de impulso basado en la volatilidad, diseñado para identificar con precisión los principales cambios de tendencia. Desarrollado utilizando un algoritmo especial que proporciona una construcción clara del rango medio de volatilidad, sin redibujar sus valores y no los modifica. El indicador se adapta a cualquier volatilidad del mercado y ajusta dinámicamente la anchura del rango de la banda, dependiendo de las condiciones actua

El indicador muestra ganancias (pérdidas) en el símbolo actual. Puede arrastrar y soltar libremente la línea para mostrar la ganancia o pérdida actual.
Puedes encontrar mis productos aquí
Parámetros Calculation in money or in points — calcula la ganancia/pérdida en puntos o en dinero. Add pending orders to calculate — tenga en cuenta las órdenes pendientes en los cálculos. Magic Number (0 - all orders on symbol) — número mágico, si es necesario evaluar órdenes específicas. Offset for first dr
FREE

¡AL FINAL! ¡Un indicador estocástico para MT4 que muestra múltiples marcos de tiempo en un gráfico! Vea la posición real de las líneas principal y de señal en 4 marcos de tiempo separados al instante para ayudarlo a tomar decisiones comerciales informadas.
Un verdadero indicador estocástico de MTF para los operadores que necesitan ver visualmente lo que el indicador les dice en varios períodos de tiempo, sin flechas que solo apunten hacia arriba o hacia abajo o se muestren los números. ¡No más
FREE

Multi Anchor VWAP Pro MT4 - VWAP Puro Anclado | σ-Bandas Adaptativas | Alertas Inteligentes Anclaje VWAP de precisión, especialmente diseñado para MetaTrader 4. Anclajes con un solo clic, bandas σ dinámicas o bandas de % y alertas instantáneas multicanal - ideal para scalpers, intradía y swing traders que necesitan un mapeo de valor razonable de grado institucional. Guía del usuario completa - ¿Necesita MT5? Haga clic aquí POR QUÉ LOS OPERADORES PROFESIONALES ELIGEN MULTI ANCHOR VWAP PRO VWAP es
Versión MT4: https://www.mql5.com/en/market/product/157679 Versión MT5: https://www.mql5.com/en/market/product/157680
Soporte y Resistencia — Niveles Inteligentes de Estructura de Mercado
Un indicador de Soporte y Resistencia claro, inteligente y altamente confiable, diseñado para traders profesionales y sistemas automatizados.
Soporte y Resistencia está diseñado para detectar niveles reales del mercado mediante un algoritmo de agrupamiento avanzado que combina fractales, segmentación de pre
FREE

AHORA PUEDE DESCARGAR VERSIONES GRATUITAS DE NUESTROS INDICADORES DE PAGO . ES NUESTRA FORMA DE RETRIBUIR A LA COMUNIDAD. >>> IR AQUÍ PARA DESCARGAR
Este sistema es un sistema Heiken Ashi basado en cálculos RSI. El sistema es un script gratuito de código abierto publicado originalmente en TradingView por JayRogers . Nos hemos tomado la libertad de convertir la secuencia de comandos de pino a Mq4 indicador. También hemos añadido una nueva característica que permite filtrar las señales y reduce
FREE

Descripción Le ayuda a detectar la estructura del mercado, utilizando diferentes tipos de conceptos de Smart Money. Esto le ayudará a mejorar su estrategia de trading en todos los sentidos. Versión MT5 Aquí Características de Smart Money: Vela de color para señalar el tipo de estructura Muestra CHOCH y BOS Iguala Mínimos y Máximos Orden Bloques Internos y Swings Máximos y mínimos débiles y fuertes Gaps de Valor Justo Máximos y mínimos en plazos diarios, semanales y mensuales Zonas de primas y de
FREE
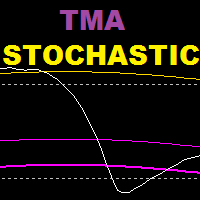
TMA Stochastic es un indicador basado en un oscilador estocástico y un indicador de bandas tma, este indicador se basa en una estrategia de reversión.
Periodo de tiempo recomendado: 15 años y más
Configuraciones recomendadas: valores más bajos para especulación, valores más altos para swing trading
==================================================== ======================
Parámetros:
Historial de tma: cuántas barras retroceden para mostrar las bandas de tma en el estocástico
Período K (e
FREE

Bermaui Bands (BB) es una herramienta de análisis técnico que ayuda a filtrar entre los movimientos de precios de rango y tendencia. La idea detrás de este indicador se puede explicar en los siguientes pasos: Calcule la desviación estándar como un oscilador que se mueve entre 0 y 100. Lo llamaré porcentaje de desviación de Bermaui (BD%). Si "BD%" está cerca de cero, la volatilidad está en su punto máximo. Además, si "BD%" está cerca de 100, la volatilidad es muy baja. Una alta volatilidad signif
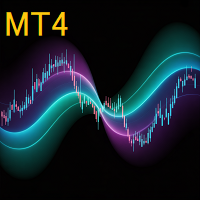
AP VWAP Bandas Pro (MT4) Precio medio ponderado por volumen con bandas ±σ para un sesgo intradía claro, zonas de reversión media y soporte/resistencia dinámicos. Funciona con criptomonedas (incluido BTC), divisas, índices y metales. Utiliza tick-volumen cuando el volumen real no está disponible.
Lo que muestra Línea VWAP (precio medio ponderado por volumen).
Dos envolventes alrededor del VWAP (por defecto ±1σ y ±2σ) para resaltar el equilibrio frente a la extensión.
Modos de reajuste: Día, S
FREE

Nas100 killer V2 (Ver video de como probamos el indicador en vivo) 1000% indicador no repinta aparece en la vela actual. Marcos de tiempo: M5, M15, M30, H1, H4. Funciona en pares como (NAS100, US30, SPX500, y Oro) El indicador es estrictamente para scalping no mantener las operaciones durante demasiado tiempo. Las flechas naranjas buscan oportunidades de venta. Las flechas azul claro buscan oportunidades de compra.
El Indicador de Rupturas de Rango de Apertura es una herramienta de trading basada en sesiones, diseñada para operadores que siguen conceptos de trading institucional, como ICT (Inner Circle Trader), Smart Money Concepts (SMC) y estrategias basadas en volumen o flujo de órdenes . Este indicador traza rangos de apertura esenciales de la sesión, lo que permite a los operadores identificar posibles barridos de liquidez, zonas de ruptura, fakeouts y niveles intradía clave en
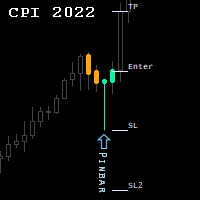
Indicador de patrones de velas.
NUEVO! GRATIS Candlestick Patterns Expert Advisor > https://www.mql5.com/en/market/product/105634?source=Site+Profile
El indicador dibuja patrones de velas de colores, su descripción y los futuros niveles de Stop Loss / Take Profit. Combinado con otros análisis de mercado, puede mejorar en gran medida los resultados comerciales. Indicador puede ser altamente personalizado por el usuario, incluyendo el cambio de colores, fuentes, niveles, tamaños de vela, etc ..
FREE

Nota : El problema de la lentitud de carga del indicador ha sido solucionado. Esta nueva versión carga rápido y no ralentiza la plataforma.
Versión 1.3 : Hemos actualizado el indicador para incluir una opción de escaneo histórico de barras. Así que en lugar de escanear todas las barras de la historia (que puede hacer que el indicador lento a veces), puede seleccionar el número máximo de barras que puede escanear que puede aumentar el rendimiento y hacer que el indicador más rápido.
Este indi

El Triángulo de Elliot está tomado de 1 de los 13 patrones dentro de la Teoría de la Onda de Elliot que dice que el comportamiento social o de la multitud tiende a invertirse en patrones reconocibles y de los cuales revelan un patrón estructural que aparece en la naturaleza, así como la psicología de masas de los participantes en el comercio. A partir de esto, ha ideado varios patrones identificables que aparecen en los precios del mercado. Uno de ellos es el que he denominado Triángulo de Elli
FREE

DTFX Algo Zones son retrocesos de Fibonacci autogenerados basados en los cambios de la estructura del mercado.
Estos niveles de retroceso están destinados a ser utilizados como niveles de soporte y resistencia para buscar el rebote del precio para confirmar la dirección.
USO Figura 1 Debido a que los niveles de retroceso sólo se generan a partir de cambios identificados en la estructura del mercado, los retrocesos se limitan a partir de las zonas consideradas más importantes debido a la r

SIGA LA LÍNEA OBTENGA LA VERSIÓN COMPLETA AQUÍ: https://www.mql5.com/en/market/product/36024 Este indicador obedece a la máxima popular de que: "LA TENDENCIA ES TU AMIGA" Pinta una línea VERDE para la COMPRA y también pinta una línea ROJA para la VENTA. Da alarmas y alertas de todo tipo. NO SE REPITE y se puede utilizar para todos los pares de divisas y marcos temporales. Sí, tan fácil y sencillo como eso. Incluso un novato puede utilizarlo para hacer grandes y fiables operaciones. NB: Para obte
FREE
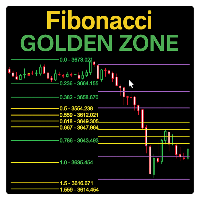
El Indicador Fibonacci Sessions es una poderosa herramienta de trading diseñada para scalping de precisión y estrategias intradía. Traza automáticamente los niveles clave de Fibonacci para las sesiones de Nueva York, Londres y Asia, brindando a los traders una visión clara de la dinámica del precio en los principales mercados. Cada sesión resalta Zonas Doradas únicas, donde el precio reacciona con mayor frecuencia. Esto crea áreas altamente confiables para reversiones, rupturas y operaciones de
FREE
Indicador de tiempo hasta el final de la vela. Muestra el tiempo hasta el final de la vela, así como el tiempo del servidor. El texto puede mostrar la tendencia o la dirección de la vela, las notificaciones de sonido están integradas Peculiaridades:
Muestra el tiempo hasta el final de la vela actual, así como otros marcos de tiempo que se pueden ajustar o desactivar si es necesario AW Candle Time puede seleccionar la dirección de la vela o tendencia actual con el indicador AW Super Trend La est
FREE

El volumen da profundidad a la acción del precio El volumen crítico puede localizar con precisión las zonas más baratas para colocar operaciones. Entre en los retrocesos lo antes posible para obtener las mejores configuraciones de riesgo-recompensa.
Características Algoritmo agresivo que anticipa los retrocesos Clasificaciones de Volumen Histogramas grises - Volumen normal, actividad media del mercado Histograma Naranja - Volumen Tendencial, actividad de mercado incrementada Histogramas rosas -

Forex Gunslinger es un indicador de señales de reversión de COMPRA/VENTA diseñado en torno a la idea de combinar soporte/resistencia, cruces y osciladores en modo MTF. Cuando todo está alineado, el indicador genera una señal de COMPRA o VENTA. Aunque el indicador se basa en la idea MTF, el algoritmo es muy estable y genera señales de reversión confiables. Este es un indicador de tipo MTF donde puede usar un marco de tiempo mayor o menor para calcular las señales para su gráfico actual. Pero tamb
Signal King: Su indicador de tendencia supremo ¿Alguna vez se ha sentido perdido en el ruido del mercado? El indicador "Signal King" se abre paso a través del caos, proporcionando señales de compra y venta claras y de alta probabilidad directamente en su gráfico. No se trata de un indicador de tendencia más, sino de una poderosa herramienta diseñada para proporcionarle una ventaja mediante la combinación de la robusta Supertendencia con un fiable filtro EMA . La Supertendencia destaca en la iden
FREE

Este indicador es una herramienta interactiva de etiquetado de Ondas de Elliott para MetaTrader 4 y 5.
Permite al usuario colocar manualmente etiquetas de ondas directamente en el gráfico, seleccionando el tamaño de la etiqueta, el color y el tipo de onda (correcciones ABC, impulsos de cinco ondas o estructuras WXY) desde un menú en el gráfico.
Con un solo clic en el gráfico, el indicador coloca de forma secuencial las etiquetas de ondas correspondientes en el precio y el tiempo elegidos, ayudan
FREE

Un indicador Fibonacci se utiliza mejor con otros indicadores como Pivotes, Soporte/Resistencia, etc. El precio tiende a utilizar los niveles de Fibo como líneas de Soporte o Resistencia. Por lo tanto, este indicador es muy útil para saber cuándo el precio podría revertirse o si se cruza un nivel, el precio podría continuar la tendencia. También para encontrar las mejores líneas de Take Profit y StopLoss. No utilice el indicador Fibo solo para operar, ya que no siempre es preciso. Utilícelo para
FREE
Cuenta atrás con temporizador para velas (CTC) - Temporizador para velas minimalista y preciso Candle Timer Countdown (CTC) es un indicador de MetaTrader ligero y no intrusivo que muestra el tiempo restante de la vela actual en su gráfico. Diseñado con la simplicidad y la claridad en mente, esta herramienta ayuda a los operadores a mantenerse al tanto de los cierres de las velas sin saturar el gráfico. Características principales: Cuenta atrás de velas en tiempo real
Sepa siempre cuántos segundo
FREE
NYXORA SIGNAL - Precision Scalping Power para XAUUSD (M1) NYXORA SIGNAL es un indicador avanzado de scalping diseñado exclusivamente para XAUUSD (Oro) en el marco temporal M1 .
Detecta automáticamente las zonas potenciales de reversión y las refina en un área precisa de 30 pips , dando a los operadores entradas rápidas y precisas en el ultra volátil mercado del oro. Características principales Detección automática de zonas de reversión - Algoritmo inteligente que identifica y refina posibles zon
FREE

Descripción: Este indicador dibujar ZigZag Line en múltiples marco de tiempo también la búsqueda de patrones armónicos antes de la finalización del patrón.
Características: Cinco instancias de indicadores ZigZag se pueden configurar para cualquier marco de tiempo deseado y entradas. Dibuja patrones armónicos antes de la finalización del patrón. Muestra las relaciones de retroceso de Fibonacci. Ratios de retroceso de Fibonacci configurables. Dibuja AB=CD basado en el retroceso Fibonacci que us
FREE

En el sistema de negociación "Masters of Risk ", uno de los conceptos principales está relacionado con los lugares donde los mercados cambian de dirección. De hecho, se trata de un cambio de prioridad y una violación de la estructura de tendencia en los extremos del mercado, donde supuestamente hay o habría stop-losses de participantes "inteligentes" que están fuera de los límites de la acumulación de volumen. Por esta razón, los llamamos "Patrones de Reversión " - lugares con mucho peso para el

Este indicador es como un tipo especial de termómetro que mide la fuerza del par de divisas actual que está viendo. En lugar de mostrar la temperatura, muestra si el par está ganando o perdiendo fuerza en un momento dado, presentado como un histograma fácil de leer (esas barras verticales) en una ventana separada debajo de su gráfico principal.
Así es como funciona en términos sencillos: El indicador utiliza dos ajustes de velocidad diferentes para analizar el precio: un ajuste "rápido" (que r
FREE

La divergencia y la convergencia son importantes precursores de retrocesos en los mercados de valores.
El indicador Divergence Sync está diseñado para buscar automáticamente divergencias en un gran número de indicadores con diferentes parámetros.
La búsqueda de divergencias se lleva a cabo en estos indicadores: (CCI, CHO, DeMarker, MACD, MFI, Momentum, OBV, OsMA, RSI, Estocástico, WPR, Awesome Oscillator ).
Para buscar divergencias, puede utilizar un indicador técnico o buscar simultáneamente
El indicador AX Forex MT4 es una sofisticada herramienta de negociación diseñada para proporcionar a los operadores un análisis exhaustivo de múltiples pares de divisas. Este potente indicador simplifica la compleja naturaleza del mercado de divisas, haciéndolo accesible tanto para operadores principiantes como experimentados. AX Forex Indicator utiliza algoritmos avanzados para detectar tendencias y patrones, y es una herramienta esencial para los operadores que deseen mejorar su rendimiento e
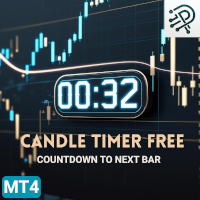
Temporizador de Velas Cuenta Atrás para la Próxima Barra MT4 Gratis por DigitalPrime Un temporizador de velas fiable y ligero que muestra el tiempo exacto restante hasta la siguiente barra - ahora disponible de forma gratuita con funcionalidad básica. Usado y confiado por cientos de traders - ¡más de 800 descargas! Características principales Cuenta atrás en tiempo real hasta el cierre de la siguiente vela (sólo para M1, M15 y H1) Se actualiza independientemente de la actividad del mercado Uso
FREE
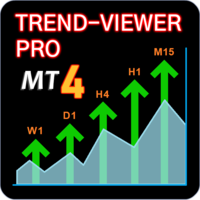
VEA LA TENDENCIA EN CADA MARCO TEMPORAL. INDICADOR INTELIGENTE LEE LA ACCIÓN DEL PRECIO PARA DETECTAR VERDADEROS CICLOS DE MERCADO Y LA TENDENCIA. Este avanzado indicador multidivisa y multitemporal, lee la tendencia en tiempo real para que siempre conozca las tendencias de los mercados en los que desea operar.
Trend-Viewer Pro ha sido específicamente diseñado para leer la tendencia de cada marco de tiempo y cada mercado , simultáneamente, haciendo mucho más fácil para usted encontrar mercados
Evolucione su trading con el indicador UT Alert Bot para MQL4 El UT Alert Bot Indicator es su mejor compañero de trading, meticulosamente diseñado para darle una ventaja en el vertiginoso mundo de los mercados financieros. Impulsado por el renombrado sistema UT, esta herramienta de vanguardia combina análisis avanzados, alertas en tiempo real y funciones personalizables para garantizar que nunca pierda una oportunidad rentable. Tanto si opera con divisas, acciones, índices o materias primas, UT
FREE
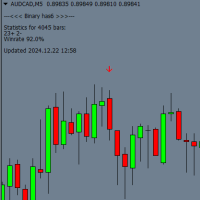
Binary has 6 es un indicador para operar con opciones binarias en MT4 que funciona en cualquier marco de tiempo y con cualquier par de divisas. También se puede utilizar para operar en Forex. Características clave: Expiración: Por defecto está configurada a 1 vela, pero los usuarios pueden ajustarla a un período de 1 a 3 velas en la configuración. Comercio basado en tendencias: El indicador genera señales según la tendencia actual. Señales: Antes de que se cierre la vela actual, aparece una flec
FREE

Modificación multidivisa y multitemporal del indicador ZigZag. Muestra la dirección actual del mercado, la altura del último movimiento, el número de barras de este movimiento y la ruptura del punto anterior del ZigZag (línea horizontal). Este es el escáner MTF.
Puede especificar las monedas y plazos que desee en los parámetros. Además, el panel puede enviar notificaciones cuando el ZigZag cambia de dirección o cuando se produce un avance en el punto anterior. Al hacer clic en una celda con un
- El precio real es de 200$ - Descuento del 50% (Ahora es de 99$) - Está habilitado para 4 compras. ¡Póngase en contacto conmigo para el bono extra ( indicador de tendencia de Gann), instrucción o cualquier pregunta! - No repintado, No lag - Yo sólo vendo mis productos en Elif Kaya Perfil, cualquier otro sitio web son robados versiones antiguas, Así que no hay nuevas actualizaciones o apoyo. - Actualización de por vida libre Gann Oro EA MT5 Introducción Las teorías de W.D. Gann en el análisis t
** Todos los Símbolos x Todos los Plazos escanean con sólo pulsar el botón del escáner ** *** Ponte en contacto conmigo para enviarte las instrucciones y añadirte en "M W Scanner group" para compartir o ver experiencias con otros usuarios. Introducción: Doble Top(M) y Doble Bottom(W) es un tipo común muy repetitivo de los patrones de reversión de precios. Double Top se asemeja al patrón M e indica una reversión bajista mientras que Double Bottom se asemeja al patrón W e indica una reversión alci

La ventaja que te falta para atrapar las rupturas como un profesional. ¡Siga un sistema paso a paso que detecta las rupturas más potentes!
Descubra patrones de mercado que generan enormes beneficios basados en una estrategia probada y contrastada.
Libere su ventaja
Información importante aquí www.mql5.com/en/blogs/post/723208
La versión fiable del asesor experto
Automatice las señales de Breakout EDGE utilizando "EA Breakout EDGE" Haga clic aquí Tener acceso a la estrategia de cambio de ju

Este indicador ha sido creado para encontrar los probables puntos de reversión del precio del símbolo. En su funcionamiento se utiliza un patrón de inversión de velas pequeñas junto con un filtro de extremos. El indicador no se redibuja. Si el filtro de extremos está desactivado, el indicador muestra todos los puntos que tienen un patrón. Si el filtro de extremos está activado, la condición funciona - si el historial de velas de barras anteriores 1 contiene velas más altas y están más lejos que
FREE
BBRSI Quantum (Edición Gratuita) BBRSI Quantum es un potente indicador 100% Sin Repintado (Non-Repainting) para MetaTrader 4 que genera flechas claras de Compra y Venta basadas en una estrategia avanzada de momentum. Esta herramienta está diseñada para traders que buscan identificar puntos de entrada precisos durante condiciones de sobrecompra o sobreventa. Esa es la edición GRATUITA y totalmente funcional. La Estrategia Central: Bandas de Bollinger sobre el RSI A diferencia de los indicadores
FREE
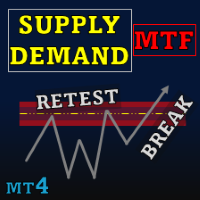
Special offer : ALL TOOLS , just $35 each! New tools will be $30 for the first week or the first 3 purchases ! Trading Tools Channel on MQL5 : Join my MQL5 channel to update the latest news from me Supply Demand Retest and Break Multi Timeframe , esta herramienta traza zonas de oferta y demanda basadas en velas de fuerte momentum, permitiéndole identificar estas zonas en múltiples marcos de tiempo utilizando la función timeframe selector . Con etiquetas de retest y break, junto
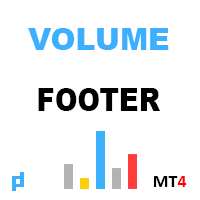
El indicador muestra el volumen vertical. En la configuración, hay 2 coeficientes para determinar alto y extremo, y 1 para determinar bajo volumen. Un algoritmo similar también se usa en el indicador UPD1 Volume Pixel . Cuando se detecta el volumen especificado, el histograma se colorea en el color correspondiente. El ancho del histograma se selecciona automáticamente, dependiendo de la escala. Como regla general, el precio responde al volumen máximo y mínimo. Pero es necesario usar señales de
FREE

El Pips Stalker es un indicador de flecha largo y corto, que ayuda a traders de todos los niveles a tomar mejores decisiones al operar en el mercado, nunca se repinta y utiliza el RSI como lógica principal de señal; una vez que se da una flecha, nunca se repinta ni retropinta y las flechas no se retrasan.
CARACTERÍSTICAS DE LA FLECHA PIPS STALKER :
PANEL DE ESTADÍSTICAS Un panel de información único que muestra el porcentaje general de tasas de victorias y estadísticas útiles como el máximo d

El indicador Block Master Pro está diseñado para identificar visualmente zonas del gráfico en las que es probable que se concentren volúmenes significativos de los principales participantes del mercado. Estas áreas, conocidas como bloques de órdenes, representan rangos de precios en los que los grandes participantes colocan sus órdenes, lo que podría indicar una inversión del precio y un movimiento en la dirección opuesta. Principales características:
Identificación de bloques de órdenes: Block

Trend Hunter es un indicador de tendencia para trabajar en el mercado Forex. Una característica del indicador es que se mueve con confianza con la tendencia, sin cambiar la señal si el precio atraviesa ligeramente la línea de tendencia. El indicador no se vuelve a dibujar, la señal para ingresar al mercado aparece después de que se cierra la barra.
Trend Hunter es un indicador justo. Pase el mouse sobre la señal del indicador para mostrar el beneficio potencial de la señal.
Para operar con un

Extreme Value Sniper es un indicador de precios sin tendencia. El indicador encuentra los niveles potenciales de reversión comprobando los rangos de valores y los ciclos de precios. Versión MT5 del producto : https://www.mql5.com/en/market/product/114550
Muestra los niveles de sobrecompra y sobreventa utilizando el rango medio. Los niveles de sobrecompra están entre 4 y 10 Los niveles de sobreventa están entre -4 y -10
Estos niveles pueden ser usados como niveles de reversión.
Extreme Value
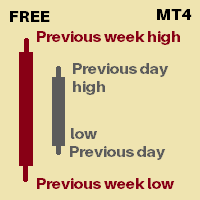
Es un indicador que le mostrará
Máximo del día anterior Mínimo del día anterior Máximo de la semana anterior Mínimo de la semana anterior Usted puede fijar cuántos días de historia usted quisiera ver para el día anterior alto bajo y la semana anterior alta baja Actualmente se marcarán 30 días de PDH/L Se marcarán 4 semanas de PWH/L Puede cambiarlo desde los ajustes del indicador. Las fechas se muestran en las líneas de marcado para identificar a qué fecha pertenece ese marcado.
Gracias :) Siemp
FREE

Este indicador está diseñado para gráficos en vivo, no para el probador. El indicador PRO Trend Divergence es una herramienta avanzada de análisis técnico diseñada para detectar divergencias de continuación de tendencia , una señal de que la tendencia actual probablemente continuará. A diferencia de los indicadores tradicionales que se centran en los cambios de tendencia, esta herramienta permite identificar cuando la tendencia sigue siendo fuerte, incluso durante retrocesos o correcciones menor

Super Trend Pro Su simple. como se ve en la imagen del producto se puede averiguar cómo funciona. Utilizamos varios MA y el uso de Estadística y Probabilidad en el código para dibujar agradable, grande y pura Detección de Tendencia. ¿Le gusta? Sí a mí también Aquí, Super tendencia pro con 100% no repintado indicador
Parámetro de entrada es clara y sencilla.
Entradas Período 1 --------------------------->>>> Uso para el cálculo matemático
Período 2 --------------------------->>>> MA Período
Tipo
FREE
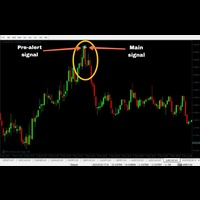
Indicador MT4 100% no repintado con prealerta anticipada
Marco temporal de velas recomendado M15
Vencimiento de la operación 15 minutos
Buffer de compra 0
Buffer de venta 1
Intrabarra
Ventajas Basado en red neuronal Algoritmos avanzados de acción de precios Algoritmos avanzados de filtrado de tendencias Algoritmos avanzados de filtrado de consolidación
Señales de prealerta (prepárese)
Indicaciones sin retardo
Compatible con operaciones automáticas
100% Sin repintado
100% Sin retardo
Sin recál
FREE
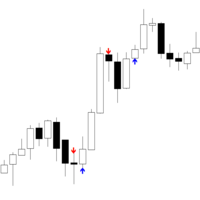
Frase corta:
Iceblock — indicador MT4 que identifica clusters de alto volumen con poco movimiento de precio (comportamiento tipo iceberg). TF:
Funciona en todos los marcos temporales (M1 a D1). Par:
Compatible con Forex, índices, oro y CFDs. Ajustes: VolumeLookback – velas para calcular volumen medio VolumeThreshold – multiplicador para detectar volumen anormal ClusterSize – número de velas cercanas para confirmar un cluster RangeComparisonPeriod – periodo para promediar rangos (high–low) Con
FREE

indicadores para facilitar el análisis basado en la estrategia BBMA de Oma Ally mostrando las etiquetas CSAK (CSD), CSM y Extreme en el gráfico. 1. Muestra la línea de la banda de Bollinger 2. LWMA 5-10 Máximo y mínimo 3. EMA 50 4. Fibonacci 5. MHV . área 6. Etiquetas Alert & Show BBMA consiste en el uso de 2 indicadores : Medias Móviles Bandas de Bollinger BBMA consiste en 3 tipos de entradas : Extremo MHV Re-Entrada Ajustes de Media Móvil : El sistema utiliza 5 medias móviles: 2 medias móvile
FREE

Este indicador está basado en el famoso indicador fractal pero con mucha personalización y flexibilidad.
Esta es una herramienta poderosa para identificar cambios de tendencias y maximizar su potencial de ganancias.
Con sus funciones avanzadas y su interfaz fácil de usar, es la mejor opción para operadores de todos los niveles. Versión MT5: Ultimate Fractals MT5 Características :
Recuento de velas fractales personalizable. Líneas de inversión. Configuraciones personalizables. Interfaz amig
FREE

"The Squeeze indicator attempts to identify periods of consolidation in a market. In general the market is either in a period of quiet consolidation or vertical price discovery. By identifying these calm periods, we have a better opportunity of getting into trades with the potential for larger moves. Once a market enters into a "squeeze," we watch the overall market momentum to help forecast the market direction and await a release of market energy." El indicador TTM Squeeze modificado es una m

Antecedentes : El swing trading en Forex es una estrategia de corto a medio plazo cuyo objetivo es beneficiarse de las "oscilaciones" de los precios (tendencias alcistas/bajistas cortas) dentro de movimientos más amplios del mercado.
Este es un sistema simple que negocia el rechazo de un oscilación anterior alta/baja. El sistema no se repinta y es facil de usar, por favor uselo con discrecion, da una precision decente y definitivamente mejorara sus operaciones. Se puede utilizar en cualquier p
FREE

Este indicador examina la estructura de precios de fractales de diferentes períodos para determinar los posibles puntos de reversión en el mercado, brindando tiempo a los operadores posicionales que ya tienen un modelo de valoración fundamental o técnico. A diferencia de su hermano menor, Reversal Fractals , este indicador no perderá las reversiones debido al período seleccionado, y encontrará fractales de reversión en forma de zig-zag, ignorando esas reversiones que no tienen el impulso sufici
El Mercado MetaTrader es una plataforma única y sin análogos en la venta de robots e indicadores técnicos para traders.
Las instrucciones de usuario MQL5.community le darán información sobre otras posibilidades que están al alcance de los traders sólo en nuestro caso: como la copia de señales comerciales, el encargo de programas para freelance, cuentas y cálculos automáticos a través del sistema de pago, el alquiler de la potencia de cálculo de la MQL5 Cloud Network.
Está perdiendo oportunidades comerciales:
- Aplicaciones de trading gratuitas
- 8 000+ señales para copiar
- Noticias económicas para analizar los mercados financieros
Registro
Entrada
Si no tiene cuenta de usuario, regístrese
Para iniciar sesión y usar el sitio web MQL5.com es necesario permitir el uso de Сookies.
Por favor, active este ajuste en su navegador, de lo contrario, no podrá iniciar sesión.