Indicadores técnicos para MetaTrader 4 - 16

El indicador analiza el número especificado de velas y traza los niveles de Fibonacci en función del máximo-mínimo. Dado que los niveles se están reorganizando, estamos interesados en el lado derecho del rango. El precio ima a los niveles y reacciona al tacto. Utilice esta herramienta para encontrar un punto de entrada de tendencia después de una corrección. Si a la izquierda vemos que los niveles han subido perfectamente, entonces podemos suponer que hemos encontrado el final del movimiento e
FREE
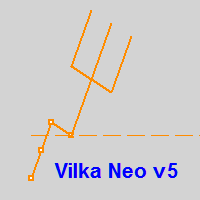
Neo Fork v5 se desarrolló para el sistema de trading "Oracle", pero poco a poco se fue complementando con, por ejemplo, ángulos de Gann y otras opciones.....
Usted puede crear objetos gráficos con color, estilo y grosor especificados, tales como: rectángulos con y sin relleno, segmentos de líneas de tendencia y una herramienta no estándar - "Neo Fork" en forma de tridente, así como existe la oportunidad de ajustar interactivamente la paleta de colores directamente desde el gráfico, ajustar la vi
FREE
Indicador Didi Index con alerta visual de compra y venta, con alerta de confirmación.
Alertas de compra o venta, en pantalla y para móviles, ¡con descripción visual en colores de la dirección en pantalla!
Un aviso en el color de la dirección actual del gráfico en la pantalla le informa rápidamente si el par es comprado o vendido por Didi Index.
Con posición y tamaño de texto configurables, facilitando el seguimiento de la tendencia del par.
FREE
Our modernized version of the popular channel TMA_TRUE indicator for MT4, which provides information on the main points of trend reversal and momentum exhaustion by drawing a channel on the chart, also draws arrows of signals for buy and sell. As a result, traders can identify bullish and bearish price reversal zones and BUY and SELL accordingly.
This indicator works well on all instruments and on all Timeframes.
This indicator is the basis of our Channel Trigger EA, which you can buy in MQL
FREE
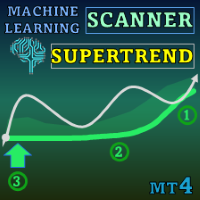
Special offer : ALL TOOLS , just $35 each! New tools will be $30 for the first week or the first 3 purchases ! Trading Tools Channel on MQL5 : Join my MQL5 channel to update the latest news from me Descubra el poder del aprendizaje automático avanzado con el Machine Learning Adaptive SuperTrend , un indicador de vanguardia diseñado para adaptarse sin problemas a las condiciones cambiantes del mercado. Al integrar la agrupación en clústeres de k-medias con la metodología SuperTrend,

Se trata de un indicador personalizado no repintado para identificar oportunidades comerciales en la acción oscilante a medida que los precios se mueven dentro de una banda superior e inferior. Inspirado en el Canal de Keltner, el indicador de canal más popular introducido por Chester Keltner. Es diferente con las Bandas de Bollinger. Representa la volatilidad utilizando los precios máximos y mínimos, mientras que los estudios de Bollinger se basan en la desviación estándar. El algoritmo de este
FREE

Este indicador se basa en Zigzag... Añadido: 1. 1. Añadido flechas para hacer el gráfico más distintivo. 2. Añadida la visualización de precios, para que pueda ver el precio con mayor claridad. 3. Añadido ajustes de alarma, y puede soportar el envío de correos electrónicos. Características del indicador original. 1. Configuración básica del indicador de onda. 2. Los últimos 2 puntos ZIGZAG no tienen estabilidad, con el mercado y el cambio, (es decir, los usuarios dijeron que la función futura) 3
FREE
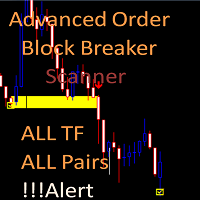
Explorador avanzado de bloques de pedidos
Este escáner es de descarga gratuita, pero depende de que usted posea el indicador avanzado de ruptura de bloques de órdenes. Necesita comprar el indicador aquí: https: //www.mql5.com/en/market/product/59127
Versión MT5: https: //www.mql5.com/en/market/product/62769
El Scanner le mostrará en un solo gráfico todos los marcos temporales (M1 a Mensual) con su propio estado para el indicador: advance order block breaker Escanea todos los marcos de tiempo
FREE

Como comerciante de divisas, comprende el valor de la estrategia comercial de Fibonacci en el análisis técnico. Sin embargo, dibujar y ajustar manualmente los niveles de Fibonacci puede llevar mucho tiempo. Ahí es donde entra en juego el indicador Fibonacci Of Yesterday Ultimate . Está diseñado específicamente para operadores que utilizan la estrategia Fibonacci basada en la acción del precio del día anterior, ahorrándole tiempo y esfuerzo. Este innovador indicador identifica automáticam
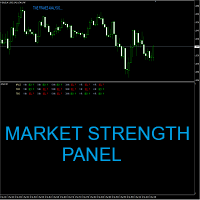
Apollo Market Strength Panel es un indicador de marco de tiempo múltiple que puede ser útil para los comerciantes de divisas y opciones binarias. El panel representa las condiciones del mercado en varios marcos de tiempo desde M1 hasta H4. El indicador proporciona información sobre tres aspectos importantes del mercado. Son Tendencia, Fuerza e Impulso. Si estos 3 componentes se alinean, el indicador le proporcionará una señal de COMPRA o VENTA dependiendo de la dirección del mercado. El indicado
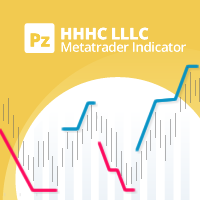
Una implementación personal de un famoso principio de tendencia conocido como higher high, higher close, lower low, lower close (HHHC - HHHL). Utiliza únicamente la acción del precio para determinar la dirección de la tendencia, los cambios de tendencia y las zonas de retroceso. [ Guía de instalación | Guía de actualización | Solución de problemas | FAQ | Todos los productos ] Periodo de ruptura personalizable Colores y tamaños personalizables No repinta ni retropinta Implementa alertas de todo
FREE

El indicador ha combinado 5 estrategias populares. Dibuja una flecha después de confirmar una señal para la estrategia seleccionada. Hay alertas de señal. No redibuja sus valores. I recommend watching my advisor - Noche Zen EA
5 estrategias. La línea principal cruza la línea de señal. La línea principal cruza la línea de señal en las zonas de sobreventa (para comprar) / sobrecompra (para vender). La línea principal entra en las zonas de sobreventa (para vender) / sobrecompra (para comprar). L
FREE

El indicador " Countdown Candle Timer " es una herramienta visual para la plataforma MetaTrader 4 que muestra una cuenta regresiva precisa del tiempo restante hasta la próxima vela en el gráfico.
Proporciona información en tiempo real sobre la duración restante de la vela actual, lo que permite a los operadores realizar un seguimiento preciso del tiempo y optimizar su toma de decisiones comerciales.
El indicador se puede personalizar en términos de color, tamaño de fuente y posición en el gráfi
FREE

Modificación multidivisa y multitemporal del indicador Bandas de Bollinger. En el tablero puedes ver rupturas y toques de las Bandas de Bollinger. En los parámetros puede especificar las monedas y plazos que desee. El indicador también puede enviar notificaciones cuando el precio toca las Bandas de Bollinger, cuando la volatilidad actual cambia (se expande o cae) y cuando el precio toca todas las bandas. Al hacer clic en una celda con un punto, se abrirá este símbolo y punto. Este es el escáner

Le presentamos un indicador que no sólo mejora el aspecto visual del gráfico, sino que también le confiere un carácter vivo y dinámico. Nuestro indicador es una combinación de uno o más indicadores de Media Móvil (MA), que cambian constantemente de color, creando un aspecto interesante y colorido.
Este producto es una solución gráfica, por lo que es difícil describir lo que hace en texto, es más fácil verlo descargándolo, además el producto es gratuito. Este indicador es adecuado para los blog
FREE

Bitcoin Predictor es un indicador basado en flechas diseñado para predecir reversiones de precios. Esta herramienta se puede utilizar con BTC y otras criptomonedas. También se puede usar con monedas. Pero primero debe verificar qué pares funcionan mejor. Algunos pares y marcos de tiempo pueden funcionar realmente bien. Eres libre de probarlo y verlo tú mismo. El indicador es muy fácil de usar. Todo lo que necesitas es seguir las flechas. El indicador puede funcionar como un sistema independiente

Basado en el famoso y útil indicador - Super Trend, añadimos algunas características para hacer este indicador mucho más fácil de usar y potente. Facilidad para identificar la tendencia de cualquier gráfico. Adecuado para Scalping y Swing Mejor para usar en el mercado de tendencia tenga cuidado en el mercado lateral, podría proporcionar algunas señales falsas Ajuste : Multiplicador ATR Periodo ATR ATR Max Bars (Max 10.000) Mostrar nodo ARRIBA/ABAJO Tamaño de los nodos Mostrar señales Pull-back R
FREE

Falso estocástico de ruptura para utilizar con nuestro indicador de ondas de Elliott como parte de la estrategia general de negociación de la 5ª onda.
Como no podemos cargar varios archivos, lo hemos listado por separado. El falso estocástico de ruptura se utiliza mejor como herramienta de confirmación que como único indicador de señal. El conjunto de indicadores de ondas de Elliott está diseñado en torno a una estrategia de negociación simple pero eficaz. El conjunto de indicadores es ideal par
FREE

ste indicador identifica automáticamente los niveles clave de soporte y resistencia analizando los patrones de volumen. A diferencia de las herramientas tradicionales de S/R que se basan únicamente en el precio, Volume S/R encuentra niveles en los que el mercado realmente reaccionó. LÓGICA DE DETECCIÓN : - Zonas de alto volumen: Niveles de precios donde se produjeron fuertes compras/ventas - Zonas de bajo volumen: Zonas de interés débil - zonas potenciales de ruptura o inversión
FILTRADO INTEL
FREE

El indicador construye un gráfico Renko en la ventana secundaria para el símbolo actual. Las barras se forman a partir de datos en tiempo real y el tamaño de barra deseado puede establecerse en la pestaña de entradas. Y lo que es más importante, dado que el gráfico Renko sólo utiliza el precio para construir las barras e ignora el tiempo, el indicador puede aplicarse a cualquier marco temporal y se pueden obtener los mismos resultados. Uso recomendado
Como los gráficos Renko son famosos por elim
FREE

Este indicador es una herramienta multifuncional de análisis técnico, basada en la combinación de una media móvil exponencial adaptativa y filtros de volatilidad calculados a través del Average True Range (ATR). Está diseñado para identificar con precisión la dirección actual del precio, resaltar las áreas clave de posibles cambios de tendencia y mostrar visualmente las zonas potenciales de reversión. El algoritmo se fundamenta en la construcción dinámica de una banda de tendencia utilizando dos
Indicador de acción del precio le da señales de tendencia inversa o incluso continua dependiendo de su marco de tiempo y la estrategia utilizada. !!!Este no es un indicador santo grial y no va a dar 100% tasa de ganar!!! Como se puede ver, no está dando una gran cantidad de señales debido a los movimientos de los precios en la tendencia lateral (plana). Se puede utilizar en todos los principales pares de divisas e incluso en los índices. Por favor, tenga en cuenta el uso de este indicador con o
FREE
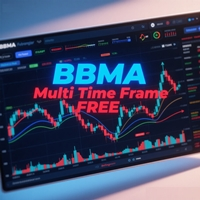
LINK : https://linktr.ee/ARFXTools;
BBMA + SMC TRADING FLOW (Smart & Simple) 1. IDENTIFICAR LA TENDENCIA PRINCIPAL (Multi Time Frame) Utilice indicadores: PANEL BBMA MTF (compruebe la dirección de la tendencia en MN, W1, D1, H4). Opere sólo cuando D1 y H4 estén en la misma dirección . Ejemplo :
Si D1 = Compra y H4 = Compra → Céntrese sólo en la compra de reentrada . 2. ESPERAR A CSA + CSM (Configuración de entrada válida). CSA Compra : La vela cierra fuera de la banda inferior de Bol
FREE

ZigZag WaveSize: un indicador ZigZag estándar modificado con la adición de información sobre la longitud de onda en puntos.
Peculiaridades: Lógica de construcción en línea optimizada: las etiquetas no se vuelven a dibujar desde cero en cada marca, sino que funcionan en paralelo con el cálculo principal, dibujando solo las últimas etiquetas cuando ZigZag dibuja nuevas líneas o las actualiza. Se agregó otro modo de cálculo en puntos: la línea se construye si excede el número de puntos especifica
FREE

¿Está cansado de dibujar líneas de tendencia cada vez que analiza gráficos? O tal vez le gustaría tener más coherencia en su análisis técnico. Entonces esto es para usted. Este indicador dibujará líneas de tendencia automáticamente cuando se deje caer sobre un gráfico. Cómo funciona Funciona de forma similar al canal de desviación estándar que se encuentra en mt4 y mt5. Tiene 2 parámetros: 1. Barra de inicio 2. Número de barras para el cálculo La barra de inicio es la barra en la que comenzará e
FREE

El indicador busca velas de impulso y las muestra en el gráfico. Incluye un filtro de sombras. También encuentra los niveles de ruptura de las Bandas de Bollinger. Puede activar el tablero multidivisa en los ajustes. Alertas elegir entre el gráfico actual o toda la lista. Blog-Link - Retest and Fake Breakout with UPD1
Patrones de negociación: Retest de tendencia. Falsa ruptura. Otros.
EURUSD, GBPUSD, XAUUSD, ... M15, M30, H1.
Parámetros de entrada.
Básicos. Bars Count - el número de barras

El indicador de sesiones SMC es una herramienta de precisión diseñada para operadores de dinero inteligente que confían en conceptos de TIC, búsquedas de liquidez y estrategias basadas en sesiones . Mapea a la perfección zonas críticas de negociación basadas en sesiones utilizando los conceptos más probados y populares utilizados por operadores de nivel institucional. Este indicador de sesión todo en uno superpone su gráfico con las estrategias de rango más efectivas y de alta pr
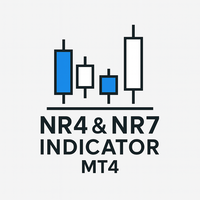
Descripción:
NR4 & NR7 Inside Bar Highlighter para MetaTrader 4 es un indicador que detecta automáticamente patrones de compresión de precio basados en la combinación de NR4 o NR7 con una Inside Bar . Cómo funciona:
El patrón NR4 (Narrow Range 4) identifica la vela con el rango más estrecho entre las últimas 4 barras, mientras que NR7 considera las últimas 7. Cuando esta condición de rango reducido ocurre junto con una Inside Bar (una vela completamente contenida dentro de la anterior), a menu
FREE

El indicador Chart High Low es un indicador para META TRADER 4, con la función de analizar y mostrar los niveles MÁXIMO semanal, MÍNIMO semanal, MÁXIMO mensual y MÍNIMO mensual.
Esto puede ayudar mucho al crear TrendLine o incluso trazar su línea FIBONNACI, ya que no es necesario acceder a sitios de Internet para analizar los niveles MÁXIMO/MÍNIMO.
Hay funciones de "marca" en el indicador, que pueden marcar áreas con un rectángulo, haciéndolas aún más visibles en el gráfico. Esto es opcional
FREE

Presentamos el Tablero de control del predictor parabólico , un indicador de tablero avanzado de múltiples símbolos, marcos de tiempo múltiples y sin repintado basado en el popular Indicador parabólico. Filtra las señales parabólicas tradicionales para identificar la tendencia exacta y predecir los niveles de entrada y salida del mercado.
Este indicador no es solo un tablero. Con un clic en el símbolo, puede ver la dirección de la tendencia, los niveles de entrada precisos y los niveles de

Indicador multidivisa y multitemporal Inside Bar (IB). En los parámetros, puede especificar las monedas y plazos que desee. El panel muestra el último patrón de barra interior (y barra madre) encontrado, la posición actual del precio y la ruptura de los niveles de las barras madre e interior. Puede establecer el tamaño y el color de las barras y el texto de las celdas. El indicador también puede enviar notificaciones cuando se superan los niveles. Al hacer clic en una celda con un punto, se abr

El indicador busca una consolidación (plano) en el mercado en un momento determinado, construye un canal de caja y marca niveles con sangría a partir de él para una ruptura. Tras cruzar uno de los niveles, el indicador marca la zona para la toma de beneficios y calcula el beneficio o la pérdida correspondiente en la dirección de esta entrada en el panel. Así, el indicador, ajustándose al mercado, encuentra una zona plana del mercado, con el inicio de un movimiento tendencial para entrar en ella.
FREE

Este indicador tiene el propósito de representar visualmente el canal Donchian en tu gráfico de trading. El canal Donchian es una herramienta técnica sencilla utilizada para representar el rango entre el punto más alto y el punto más bajo durante un período específico. Este indicador mejora el análisis visual de los movimientos de precios, ofreciendo perspicacia en puntos potenciales de ruptura y continuación de tendencias. El canal Donchian puede aplicarse tanto al marco de tiempo actual como a
FREE

Este es un indicador para el patrón Quasimodo o Over and Under. Encuentra automáticamente los puntos de oscilación e incluso puede colocar operaciones virtuales con stop loss y take profit. Pulse el botón "Optimizar" para encontrar automáticamente la configuración más eficaz. El patrón consta de cuatro patas A,B,C,D como se muestra en las imágenes. Los precios de apertura y cierre de las operaciones virtuales son el precio Bid, pero las estadísticas del panel de visualización tienen en cuenta el
FREE

Simple ATR Stop Loss : Tu brújula de volatilidad del mercado que te ayuda a navegar por las traicioneras aguas del trading , estableciendo Stop Losses más inteligentes y haciéndote parecer un ninja del trading (capa no incluida). ¡Atención, aficionados al trading y expertos del mercado! Contemplad el indicador Simple ATR Stop Loss – vuestro nuevo mejor amigo en el salvaje mundo del trading. Es más simple que un rompecabezas de dos piezas pero más poderoso que un toro cafeinado e
FREE

Indicador de scalping. Tiene en cuenta la volatilidad, el movimiento del precio en el intervalo local y la dirección de la tendencia actual. Marco temporal recomendado - M5. Ventajas: La baja volatilidad cuando aparece una señal asegura un movimiento mínimo contra una posición abierta. El indicador no redibuja sus señales. Hay señales de alerta. Es una gran herramienta para el day trading.
Ajustes: Nombre Descripción Período Período del indicador Rango de cada barra en el periodo (pp.) El tamañ
FREE
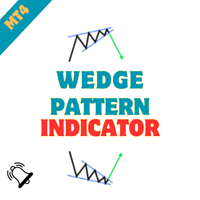
Indicador de patrón de gráfico de cuña - Libere el poder de los patrones de cuña en sus operaciones Embárquese en un viaje de precisión en sus operaciones con el "Indicador de Patrones de Gráficos de Cuña". Diseñada para MetaTrader, esta herramienta avanzada es su mejor compañera para identificar patrones de gráficos de cuña, permitiéndole tomar decisiones de trading informadas y estratégicas. Tanto si es un trader experimentado como si acaba de empezar, este indicador simplifica el proceso de d
FREE
ALGO BOX - Sistema Avanzado de Trading Diurno ALGO BOX es un potente indicador de operaciones diarias diseñado para operadores serios que exigen precisión y fiabilidad en las operaciones de ruptura. Combinando un análisis avanzado de la acción del precio con datos en tiempo real, le ayuda a detectar operaciones de alta probabilidad manteniendo el riesgo bajo control. Por qué destaca ALGO BOX Identifica oportunidades de ruptura claras y rentables Reduce las señales falsas para mejorar la precisió
FREE

Entrada detallada en el blog: https://www.mql5.com/en/blogs/post/766378
Características principales
Bandas superior/inferior adaptables Línea central suave Longitud personalizable (sensibilidad) Sin repintado (sólo se actualiza la barra en curso cada número de ticks "Actualizar después de ticks") Múltiples fuentes de precios - Elija entre cierre, apertura, máximo, mínimo, mediana, típico o cierre ponderado Componentes:
La Línea Base La línea central suave representa la media ponderada del prec
FREE

Trendlines'' es un Indicador, que todo Trader necesita y muestra la Línea de Tendencia y los niveles de Soporte y Resistencia en todos los Marcos de Tiempo. También en 1 hora, 4 horas y marcos de tiempo diarios y marcos de tiempo actuales, apoyo, y los niveles de resistencia se especifican y las líneas de tendencia se dibujan para que el comerciante puede ver todos los niveles en un gráfico. En Propiedades es posible desactivar las Líneas innecesarias.
En ' Indicador de Tendencia '' , como paq
FREE
PATRÓN DE VELAS DBD Y RBR: Este indicador se basa en el concepto de dos patrones de velas. DROP BASE DROP (DBD) es un patrón de velas de compra y RALLY BASE RALLY (RBR) es un patrón de velas de venta. Las flechas indican la configuración potencial de la señal para operaciones largas y cortas. Este indicador incluye alertas pop-up, push to phone y send to email que pueden ser activadas o desactivadas. El color y el tamaño de DBD y RBR se pueden cambiar.

Este indicador analiza los rangos en las Barras LookBack seleccionadas y muestra la fuerza relativa del movimiento del precio con el porcentaje de Nivel que usted establezca. La línea azul indica que el movimiento actual del precio es fuerte, y la línea amarilla indica que estamos en un movimiento de precio plano. La línea azul no determina si la acción del precio es alcista o bajista, sólo muestra la fuerza relativa. Por lo tanto, como se ve en la imagen, la dirección se puede determinar con un

Utilizar con una gestión disciplinada del riesgo. Sistema de entrada Fibonacci basado en la zona dorada 38,2 - 61,8 donde la entrada se confirma en 23,6 con indicaciones de Take Profit 3:1. Fibonacci trazado automáticamente contiene retroceso y expansión Fibonacci en un solo indicador. Hasta un 77% de ganancias con este sistema. FTMO challenge pass con 0.50% de riesgo y 1.50% R:R.
Estimados operadores, echad un vistazo a mi nuevo indicador de liquidez de mercado multinivel: https://www.mql5.com/en/market/product/73098
Muchos de vosotros habéis estado operando muy bien con este indicador, ¡gracias por el apoyo y los comentarios positivos! Para obtener más información sobre la liquidez del mercado, un manual sobre cómo utilizar este indicador por favor envíeme un mensaje. Mucha información se puede encontrar en la red. (busque liquidity trading/ inner circle trader)
https:

Presentamos un potente indicador diseñado con precisión que combina a la perfección puntos pivote, medias móviles y análisis multitemporal para ofrecer señales de compra y venta de alta probabilidad en tiempo real. Esta herramienta es su ventaja estratégica, diseñada para identificar los cambios de tendencia, el impulso del mercado y las entradas comerciales óptimas, independientemente de su estilo de negociación preferido.
Nuestro algoritmo va más allá de los indicadores estándar: al analizar

Cuando los niveles de resistencia de ruptura de precios se combinan con el oscilador Larry Williams' Percentage Range "WPR " rompe sus niveles de resistencia históricos, entonces surge la probabilidad de registrar precios más lejanos . Se recomienda encarecidamente confirmar la ruptura de precios con la ruptura del oscilador, ya que tienen efectos comparables a los niveles de soporte y resistencia de ruptura de precios; seguramente, las operaciones cortas tendrán la misma percepción. El concepto
FREE
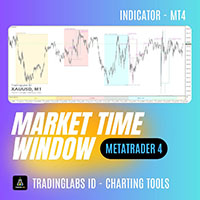
Ciclo temporal del mercado de las TIC - Sesión completa y ventana temporal ICT Market Time Cycle es un indicador profesional diseñado para ayudar a los operadores a seguir la metodología ICT (Inner Circle Trader) con facilidad.
Muestra automáticamente las principales sesiones del mercado (Asia, Londres y Nueva York), junto con las Killzones, las ventanas Silver Bullet y los tiempos Macro directamente en su gráfico. Con esta herramienta, ya no tendrá que calcular manualmente los tiempos de las se

Estrategia Óptima
Sea su asistente de trading MT Merit Conteo de Velas :
Diseñado para la negociación de opciones binarias, el indicador cuenta el número de velas alcistas o bajistas, por lo que es adecuado tanto para estrategias de martingala como de negociación estándar.
Es ideal para operadores experimentados y aplicable a Forex, ya que ayuda a calibrar el volumen y a identificar tendencias o posibles retrocesos en el gráfico. Indicador para operadores que prefieren el trading manual.
OPER
FREE

Este indicador es una visión original de los volúmenes. Se sabe que los volúmenes muestran la cantidad de compradores y vendedores durante un cierto período de tiempo. Una vela se utiliza un período de tiempo. Los volúmenes en una vela alta muestran los compradores. Los volúmenes en una vela Baja muestran a los vendedores. Una vela Abierta muestra el Delta. Delta indica quién era dominante en una vela dada, compradores o vendedores.
Parámetros de entrada Distancia - distancia del texto de los v
FREE

¿Qué es G Force Trend? G Force Trend es un indicador de análisis técnico desarrollado para la plataforma MetaTrader 4. Analiza los movimientos de los precios para identificar la dirección de la tendencia y genera señales de compra/venta. El indicador crea un canal dinámico para seguir el comportamiento del precio dentro del canal y visualiza los cambios de tendencia. ¿Qué hace? Detección de la tendencia : Determina si el precio se encuentra en una tendencia alcista o bajista. Señales de Compra/V
FREE

Indicador Heikin Ashi multidivisa y multiplazo. Muestra el estado actual del mercado. En el panel del escáner puede ver la dirección, la fuerza y el número de barras de la tendencia actual. Las velas de Consolidación/Reversión también se muestran usando colores. Puede especificar las monedas y períodos que desee en los parámetros. Además, el indicador puede enviar notificaciones cuando cambia la tendencia o cuando aparecen velas de reversión y consolidación (dojis). Al hacer clic en una celda,

El Perfil Inteligente de Liquidez está codificado por colores basándose en la importancia de la actividad negociada en niveles de precios específicos, permitiendo a los operadores identificar niveles de precios significativos tales como niveles de soporte y resistencia, zonas de oferta y demanda, huecos de liquidez, zonas de consolidación, Liquidez de Compra/Lado de Venta, etc. El Perfil Inteligente de Liquidez permite a los usuarios elegir entre diferentes periodos de tiempo incluyendo 'Auto',

Dark Oscillator es un indicador para el comercio intradía. Este indicador se basa en la estrategia de Contratendencia , tratando de interceptar los cambios en la dirección, por adelantado en comparación con los indicadores de seguimiento de tendencia. Podemos entrar en buen precio con este indicador, con el fin de seguir la inversión de la tendencia en el instrumento actual. Se aconseja utilizar brokers ECN de bajo spread. Este indicador no repinta y no lag . Los plazos recomendados son M5, M15
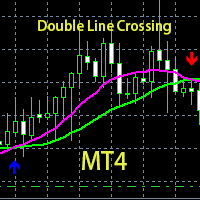
ste es un indicador personalizado basado en el cruce de medias dobles y el marcado de flechas.
Haga varias listas cuando las flechas azules aparezcan hacia arriba.
Haga una lista en blanco cuando la flecha roja aparezca hacia abajo.
Cuando la línea rosa cruza la línea verde hacia arriba, la línea rosa está arriba, la línea verde está abajo, aparece la horquilla dorada y la flecha azul.
Cuando la línea rosa cruza hacia abajo la línea verde, la línea rosa está abajo, la línea verde está arriba
FREE

¡Desbloquee las operaciones más inteligentes con la ruptura de bandas! ¿Está cansado de gráficos confusos y oportunidades perdidas? Obtenga señales de entrada y salida claras y de alta probabilidad directamente en su gráfico con el indicador Bands Breakout . Este no es un indicador más; es un sistema completo, consciente de la tendencia, diseñado para simplificar sus decisiones de trading y centrarse sólo en los mejores movimientos. Nuestro motor único combina el poder de impulso de la EMA 10 c
FREE
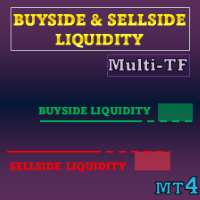
Oferta especial : TODAS LAS HERRAMIENTAS , solo $35 cada una. Las nuevas herramientas costarán $30 durante la primera semana o para las primeras 3 compras ! Canal de Trading Tools en MQL5 : únete a mi canal de MQL5 para recibir mis últimas novedades Este indicador visualiza niveles de liquidez y zonas de liquidez basados en conceptos de ICT, además de Liquidity Voids para resaltar desplazamientos de precio unidireccionales. Se centra en dónde tienden a agruparse las órd
Smart Liquidity Zones (SLZ) - Su radar SMC/ICT todo en uno para MT4
¿Por qué SLZ? ¿Cansado de entrecerrar los ojos en los gráficos tratando de detectar agarrones de liquidez, velas de ruptura de estructura y Fair Value Gaps antes de que lo hagan los tiburones del dinero inteligente? SLZ convierte su gráfico en un mapa táctico, dibujando cada zona de alta probabilidad y gritando (educadamente) cuando el precio se sumerge. Core Edge Impulsado por un conjunto de reglas destiladas de Smart Mone
FREE

** Todos los símbolos x Todos los marcos de tiempo escanean con sólo pulsar el botón del escáner ** *** Contáctame para enviarte instrucciones y agregarte en "Harmonic Scanner group" para compartir o ver experiencias con otros usuarios. Introducción Los patrones armónicos son los más utilizados para predecir el punto de inflexión. Los patrones armónicos le dan una alta tasa de ganancias y altas oportunidades para el comercio en un día. Este indicador detecta los mejores y exitosos patrones basad

Special offer : ALL TOOLS , just $35 each! New tools will be $30 for the first week or the first 3 purchases ! Trading Tools Channel on MQL5 : Join my MQL5 channel to update the latest news from me SMC es un enfoque de trading que ayuda a los traders a identificar zonas de liquidez, posiciones de órdenes institucionales y puntos clave de giro del mercado. Al aprovechar los principios de SMC, los traders pueden navegar por el mercado de manera más efectiva, encontrando entradas y sa

Este indicador le permite gestionar su exposición y ver cómo cambia el lote. Puede elegir el valor de lote óptimo para su depósito sin abrir posiciones reales. Y también evaluar nuevos instrumentos de negociación. Si opera manualmente, la gestión del riesgo le ayudará a evitar pérdidas inesperadas. El indicador incluye la posibilidad de recibir una señal sonora cuando se alcanza un nivel determinado, así como de enviar notificaciones push y un mensaje al correo.
FREE
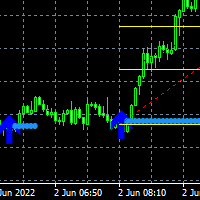
Aquí está el indicador Double Arrow ArrZZx2 que funciona mejor en el marco de tiempo de 5 minutos con Alertas. Bueno para pares como NAS100, US30, GER30 y XAUUSD Su entrada de compra o venta de entrada está en la segunda flecha del Arr zzz Puede confirmar su segunda flecha con los niveles de retroceso de Fibonacci, el nivel del 50% y el 61,8%, que es la zona dorada. El doble es bueno en mercados de tendencia fuerte, busque la ruptura en la segunda flecha. Mira las capturas de pantalla para

El Sistema de Nube EMA es un Sistema de Trading Inventado por Ripster donde las áreas son sombreadas entre dos EMAs deseadas. El concepto de que el área de la nube EMA sirve como soporte o resistencia para Intraday & Swing Trading. Puede ser utilizado con eficacia en 10 Min para el comercio del día y 1Hr / diario para Swings. Ripster utiliza varias combinaciones de 5-12 EMA nubes 34-50 EMA nubes entre otros. 8-9, 20-21 EMA nubes se pueden utilizar también. Ajuste lo que funcione para usted. Idea
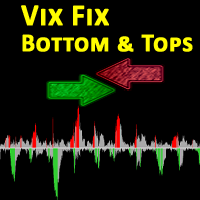
El VIX Fix es un indicador de volatilidad desarrollado por el reputado operador Larry Williams. Está diseñado para medir la volatilidad en activos que no tienen opciones o futuros, como las acciones individuales y los mercados de divisas. Esencialmente , actúa como un VIX sintético (Índice de Volatilidad) para cualquier activo , proporcionando un indicador de la incertidumbre del mercado. Esta versión modificada del indicador de William le ayuda a encontrar los mínimos y máximos del mercado. Vie

Esta herramienta de indicadores proporciona minigráficos, con símbolos/tf ajustables que pueden arrastrarse a su lugar. Se admite el funcionamiento ligero con múltiples minigráficos.
Características de los gráficos: símbolo y tf ajustables arrastrable múltiples minigráficos estilo de color y tamaño de fuente, colores de primer plano/fondo color de las velas estilos de velas; velas, barras, línea, canal alto-bajo
zoom in/out
FREE
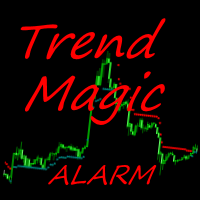
La alarma Trend Magic muestra la dirección de una tendencia e indica cuándo cambia con un sonido, una ventana emergente, un aviso push o por correo electrónico. Los puntos azules en el gráfico indican una tendencia alcista, los puntos rojos indican una tendencia bajista. Los niveles de máximos + mínimos anteriores dan orientación en un gráfico. Trend Magic Alarm puede dibujar estos niveles como líneas en el gráfico, ver entradas.
Parámetros de entrada Contador : número de barras utilizadas para

Simple GoldTrend Signal – ¡Desbloquea el Éxito en el Trading de Oro! ¡Transforma tu trading de oro con Simple GoldTrend Signal! Esta obra maestra de MT4 combina una lógica avanzada de MA Personalizada, HMA y Momentum en señales de estrellas doradas impresionantes, dándote el poder de detectar cambios de mercado sin adivinar. Ideal para todos los traders—principiantes o expertos—esta herramienta convierte tus gráficos de XAUUSD en una mina de oportunidades de oro. ¡No solo trades—triunfa! Por Qué
FREE

"The Squeeze indicator attempts to identify periods of consolidation in a market. In general the market is either in a period of quiet consolidation or vertical price discovery. By identifying these calm periods, we have a better opportunity of getting into trades with the potential for larger moves. Once a market enters into a "squeeze," we watch the overall market momentum to help forecast the market direction and await a release of market energy." El canal de compresión StdATR combina canales

Forex Meter Oscillator es un indicador que puede dar una visión completa del mercado de divisas desde un solo gráfico, midiendo las fortalezas de las divisas entre 28 pares de divisas (mayores y menores). La palabra "oscilador" es muy significativa: normaliza las fortalezas de las divisas para proporcionar valores en un rango predefinido (de -1 a 1).
¿Cuáles son las ventajas de la normalización? Es muy sencillo, los valores siempre estarán en un rango predefinido que refleja exactamente el valo
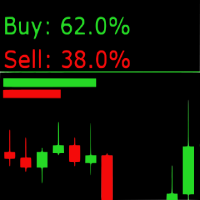
Indicador de Sentimiento del Mercado: Indicador de Sentimiento de Mercado en Tiempo Real El Indicador de Sentimiento de Mercado es una herramienta MQL4 en tiempo real que muestra el sentimiento actual de compra/venta directamente en su gráfico MetaTrader 4. Diseñado para apoyar su análisis técnico, proporciona una representación visual del posicionamiento del mercado para ayudar a informar su proceso de toma de decisiones. Características principales Visualización del sentimiento en tiempo real

Título del producto Smart ADX (MT4) – parte de la serie SmartView Indicators Descripción breve Indicador ADX con una experiencia de usuario única en la plataforma MetaTrader. Ofrece capacidades avanzadas no disponibles anteriormente, como abrir configuraciones con doble clic, ocultar y mostrar indicadores sin eliminarlos, y mostrar la ventana del indicador a tamaño completo del gráfico. Diseñado para funcionar perfectamente con el resto de la serie SmartView Indicators. Visión general La serie S
FREE
El Mercado MetaTrader es la única tienda donde se puede descargar la versión demo de un robot comercial y ponerla a prueba, e incluso optimizarla según los datos históricos.
Lea la descripción y los comentarios de los compradores sobre el producto que le interese, descárguelo directamente al terminal y compruebe cómo testar el robot comercial antes de la compra. Sólo con nosotros podrá hacerse una idea sobre el programa, sin pagar por ello.
Está perdiendo oportunidades comerciales:
- Aplicaciones de trading gratuitas
- 8 000+ señales para copiar
- Noticias económicas para analizar los mercados financieros
Registro
Entrada
Si no tiene cuenta de usuario, regístrese
Para iniciar sesión y usar el sitio web MQL5.com es necesario permitir el uso de Сookies.
Por favor, active este ajuste en su navegador, de lo contrario, no podrá iniciar sesión.