Indicadores técnicos para MetaTrader 4 - 23

Este es un indicador auto-explicativo - no hacer nada cuando el precio actual en el modo de "cerca" (plana). Definición de un mercado plano: Un precio de mercado que no es ni alcista ni bajista. El parámetro de entrada counted_bars determina en cuantas barras serán visibles las líneas del indicador comenzando desde la barra actual hacia atrás. El parámetro de entrada barsNum se utiliza como Periodo para el cálculo de aqua "valla".

El indicador de tendencia Calidad expresa la relación entre la fuerza de una tendencia o la velocidad de su crecimiento (caída) y el grado de su ruido o una cierta norma de amplitudes de fluctuaciones caóticas de un precio creciente (bajista). La posición de la línea del indicador por encima de cero muestra una tendencia creciente, por debajo de cero - una tendencia decreciente, la fluctuación de la línea del indicador cerca de cero muestra un plano. Si la línea del indicador comienza a fluctuar

Power Renko es un indicador que traza ladrillos Renko debajo del gráfico utilizando un histograma. Puede seleccionar el tamaño del ladrillo y el marco temporal de los ladrillos Renko, así como si desea o no utilizar el precio de cierre o el precio alto/bajo de las velas. Los ladrillos Renko se basan únicamente en el precio, no en el tiempo, por lo que los ladrillos Renko no estarán alineados con el tiempo del gráfico. Son extremadamente útiles para el comercio de tendencia y muchas estrategias d
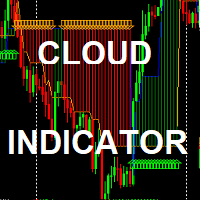
The Simple Cloud Indicator : (GRATIS por tiempo limitado para evaluación) Estrategia: La estrategia se basa en el indicador de medias móviles además del cruce de niveles de soporte / resistencia *Funciona en cualquier marco de tiempo *Funciona en cualquier símbolo *genera alertas *dibuja nubes de tendencia alcista/bajista y flechas de COMPRA/VENTA inputs : *punto de inicio dibujado (en barras): no afecta a la estrategia - sólo le da la profundidad de la historia del indicador *activar/desactivar

Basado en TheStrat por Rob Smith (@robintheblack) #thestrat , que es un método de negociación que Rob ha desarrollado a lo largo de una carrera de 30 años en el mercado. Se trata de TheStrat Timeframe Continuidad escáner que le permite escanear constantemente ya sea las acciones, pares de divisas, índices o materias primas que desea ver. Los marcos de tiempo que puede observar pueden ser (Año, Trimestre, Mes, Semana, Día, H4, H1, 15M y más pequeños si lo desea). Le dice lo que la vela actual est

Indicador de ayuda para mostrar sobre CCI Multi Timeframe. ( 1M , 5M , 15M , 30M , 1Hr, 4Hr, 1D)
Puede cambiar el periodo como desee.
Indicador CCI
El índice de canal de materias primas (CCI) es un indicador oscilador que ayuda a mostrar cuando un activo ha sido sobrecomprado o sobrevendido.Le ayuda a identificar picos o valles en el precio de un activo y puede indicar el debilitamiento o el final de una tendencia y un cambio en la dirección.Esto significa que usted puede, en teoría, entrar en
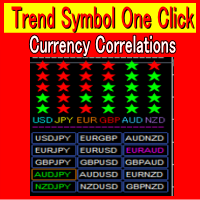
Medidor de la fortaleza de las divisas 1:Es fundamental identificar correctamente las tendencias en las inversiones en divisas. 2:TrendSymbolOneClick detecta y muestra rápidamente las tendencias que acaban de comenzar y las que ya han estado vigentes durante un largo periodo de tiempo. 3:También hay una función de fortaleza USD JPY EUR GBP AUD NZD. 4:La volatilidad le permite saber exactamente cuándo se produce un movimiento importante en el mercado. 5:Puede ahorrar tiempo en sus análisis de me
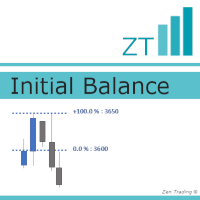
El Balance Inicial es un concepto para la primera hora de una sesión bursátil, desde el punto más bajo (inicial) hasta el más alto, que a menudo determina importantes soportes/resistencias para las horas siguientes. Se basa en los niveles de Fibonacci y ofrece niveles de reacción muy relevantes. Hoy en día, se utiliza principalmente para la primera hora ANTES de la apertura. --------------- La ventaja de este indicador radica aquí : - puedes definir por ti mismo el periodo para TU Balance Inicia

Un útil escáner/cuadro de mandos que muestra los valores RSI para múltiples símbolos y marcos temporales.
Se puede ocultar/mostrar fácilmente con un simple clic en el escáner situado en la parte superior izquierda del panel.
Puede introducir los valores RSI superior e inferior y los colores se pueden configurar para mostrar cuando por encima / debajo de estos valores. Los valores por defecto son 70 y 30. También hay colores de entrada para cuando el RSI está por encima o por debajo de 50 (per
Estrategia de scalping La detección de tendencias es uno de los retos básicos de todo operador. Encontrar la manera de saber cuándo entrar en una operación es muy importante, el timing es un factor de cambio, ni demasiado pronto ni demasiado tarde. A veces, por no conocer las condiciones del mercado, el trader cierra sus posiciones con un pequeño beneficio o deja que las pérdidas crezcan, estos son los errores que cometen los traders novatos. El indicador Trend Whipper es una estrategia de tradi

**Price Action Gold Trader** es un sofisticado indicador de análisis Price Action multi-marco de tiempo, diseñado específicamente para operar con **XAUUSD (Oro)** en MetaTrader 4. Esta herramienta de nivel profesional detecta automáticamente los patrones de Price Action, proporciona zonas de entrada estructuradas, niveles precisos de stop-loss, objetivos dinámicos de take-profit y diagnósticos completos del estado del mercado.
Construido pensando en el trading sistemático, este indicador trans
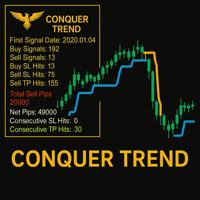
Conquer Trend - ¡Dominar la tendencia como nunca antes! Conquer Trend es la solución definitiva para dominar los mercados con precisión y sencillez. Diseñado para los operadores que quieren aprovechar las tendencias más fuertes en cualquier par y cualquier marco de tiempo, este potente indicador reúne la detección de tendencias, la confirmación de reevaluación y el seguimiento del rendimiento, todo en una herramienta optimizada.
Análisis de tendencias en múltiples marcos temporales Obtenga un

El indicador muestra Velas de plazos más altos para el análisis técnico de las TIC Los marcos temporales más altos reducen el "ruido" inherente a los marcos temporales más bajos, proporcionando una imagen más clara y precisa de los movimientos del mercado.
Al examinar marcos temporales más altos, puede identificar mejor las tendencias, los retrocesos y las áreas clave de soporte y resistencia.
El indicador Higher Time Frame Candles superpone datos de marcos temporales más altos directamente

Tick Speed Pro proporciona un registro gráfico de la velocidad de los ticks para permitirle ver el flujo y reflujo de la actividad del mercado. Observar los patrones en la velocidad de los ticks puede permitirle programar mejor las entradas para reducir el deslizamiento y las recotizaciones.
El gráfico de la velocidad de los ticks actualiza toda su posición para mostrarle sólo los últimos N segundos que usted elija, lo que resulta ideal para los enfoques de scalping y HFT. Se proporciona una ale

Oferta 249 bajar de 350 para las próximas 3 copias. luego de vuelta a 350 $
¿Está cansado de utilizar indicadores obsoletos que le dejan adivinando dónde fijar sus objetivos de beneficios? No busque más, el indicador AK CAP Opening Range Breakout. Esta poderosa herramienta está respaldada por una patente de EE.UU. y ya ha ayudado a un sinnúmero de comerciantes pasar financiado desafíos como FTMO. Lo usamos a diario en nuestros prop traders y fondos internos, y ahora está disponible para usted t

El MACD es probablemente uno de los indicadores técnicos más populares que existen. Cuando el mercado está en tendencia, en realidad hace un trabajo bastante bueno, pero cuando el mercado comienza a consolidarse y moverse hacia los lados, el MACD no funciona tan bien. SX Impulse MACD para MT5 está disponible aquí . Impulse MACD es una versión modificada de MACD que funciona muy bien para el comercio de Forex, acciones y criptomonedas. Tiene su propia característica única que filtra perfectament

Por qué el indicador de alerta RSI es esencial para sus herramientas de negociación
En el vertiginoso mundo del trading, la información oportuna y precisa es crucial. El Indicador de Alerta RSI es una potente herramienta diseñada para ayudarle a adelantarse al mercado mediante alertas en tiempo real cuando el Índice de Fuerza Relativa (RSI) alcanza niveles críticos. Tanto si es usted un operador principiante como un profesional experimentado, este indicador puede mejorar significativamente su

Gioteen Volatility Index (GVI) - su solución definitiva para superar la imprevisibilidad del mercado y maximizar las oportunidades comerciales. Este revolucionario indicador le ayuda a reducir las pérdidas debidas a movimientos bruscos del mercado. El GVI está diseñado para medir la volatilidad del mercado, proporcionándole información valiosa para identificar las perspectivas de negociación más favorables. Su intuitiva interfaz consiste en una línea roja dinámica que representa el índice de vol
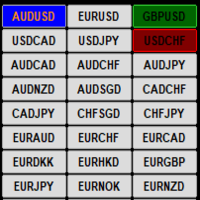
Este indicador muestra el estado actual de ganancias/pérdidas para cada par visualmente en un solo gráfico. Si se selecciona el par gráfico abierto actual y se abren operaciones para ese par, sólo se resalta el nombre del símbolo y el color del botón refleja el estado actual de las operaciones. Si el par gráfico seleccionado no tiene ninguna operación abierta, el color del botón es azul. Las opciones de entrada son:
1/ Seleccione los Pares automáticamente desde la Observación del Mercado
2/ Se

El indicador encuentra los extremos más prominentes (máximos y mínimos) en la historia y muestra sus niveles de precios para el rango de precios visible actualmente. Se muestran 8 niveles como máximo. Se trata de una herramienta para aquellos que acostumbran a buscar en el historial los niveles importantes formados por los puntos extremos de reversión. Si la escala de precios se cambia manualmente o se ajusta automáticamente por cambios en la escala de tiempo, el indicador visualiza todos los ni
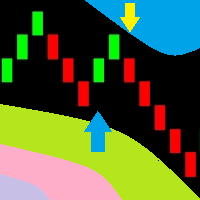
Ahora puede utilizar los gráficos de precios convencionales para mostrar barras Renko. Este indicador puede enviar cuadros de diálogo con alertas, notificaciones push a dispositivos móviles y correos electrónicos. Puede utilizar fácilmente este indicador para crear Asesores Expertos, ya que el indicador utiliza buffers.
Parámetros del indicador Tamaño Renko, puntos - tamaño de las barras Renko Distancia de las flechas, puntos - distancia de las flechas de señal Alertas - true/false - utilizar a

El indicador compara los indicadores Fractal y Zigzag para definir el Soporte y la Resistencia duros. La señal de la flecha aparece cuando surge un nuevo soporte o resistencia o cuando el precio rompe la zona de soporte y resistencia. Este indicador es eficaz en combinación con una estrategia de rebote y ruptura. Funciona bien en H4 y D1 para todos los pares.
Configuración BarCounts = 200; FastPeriod = 7 - periodo rápido SlowPeriod = 14 - periodo lento Show_SR = true - muestra soporte/resistenc

Instant Pitchfork está diseñado para los operadores que confían en estructuras de tendencia de horquilla rápidas y precisas para planificar entradas, paradas y objetivos. Haga clic en un ancla del gráfico e Instant Pitchfork dibujará automáticamente la horquilla de Andrews que mejor se ajuste a la estructura actual del mercado.
Vuelva a hacer clic en el ancla para cambiar instantáneamente entre los modos de horquilla de Andrews, Schiff y Schiff modificado y encontrar la mejor estructura en cues
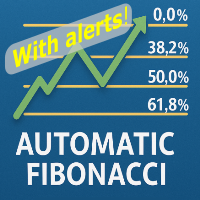
El fibonacci automático con alertas es un indicador que traza automáticamente un retroceso de fibonacci en función del número de barras que seleccione en la configuración BarsToScan del indicador. El fibonacci se actualiza automáticamente en tiempo real a medida que aparecen nuevos valores máximos y mínimos entre las barras seleccionadas. Puede seleccionar qué valores de nivel se mostrarán en la configuración del indicador. También puede seleccionar el color de los niveles, lo que permite al ope

El indicador visualiza el resultado del script CalculateScientificTradePeriod (que, por supuesto, también necesita ser descargado), que, en primer lugar , estima cuántas barras Mx del gráfico activo es más probable que continúe la tendencia futura y cuál es su calidad, y, en segundo lugar , calcula el período de promedio óptimo (que también es igual a Mx) del indicador ScientificTrade que proporciona el máximo beneficio según la estrategia extremadamente eficaz de ScientificTrade. Para que el in
Introducción
La Convergence Divergence Suite contiene 17 indicadores , indicadores técnicos MT4 incorporados y personalizados . La lista se incrementará en versiones posteriores según las peticiones de los usuarios. Cualquier indicador seleccionado se carga en su gráfico y luego se dibujan automáticamente las líneas de tendencia de Convergencia y Divergencia en el gráfico y en el indicador. Esta herramienta es importante si utiliza alguno de los indicadores de la lista o convergencia/divergenc

Bienvenido al mundo de SMC (Smart Money Concepts) Trading, donde dotamos a los operadores de las herramientas y conocimientos necesarios para tomar decisiones de trading más inteligentes. Nuestra última incorporación a nuestro conjunto de herramientas de trading es el indicador SMC Trading Pro, versión 1.0. Características principales: Identificación de Estructura de Mercado Mayor con ruptura de BODY. El Bloque de Orden debe estar en Swing Mayor ( no Swing Menor ). Bloqueo de Orden con Detecció

Indicador completo de pivotes y niveles Pivotes: Suelo (normal), Woody, Camarilla, Fibonacci Niveles: ATR, Volatilidad histórica con desviaciones estándar, Volatilidad del precio de cierre con desviaciones estándar
Características: 4 +/- niveles MTF, pivotes/niveles basados en Diario, Semanal, 4hr o incluso 15min Desplazamiento de hora y minuto
Textos con precios y distancias en pips al pivote/nivel central Entradas para niveles de Camarilla/Fibonacci/ATR/Volatilidad
Alertas, popup, push, email
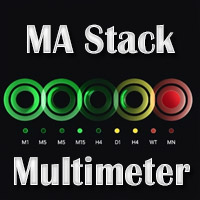
Indicador básico MA Stack: Este es un indicador de un solo marco de tiempo y una sola divisa. Observa las MAs y muestra 3 posibles estados en el gráfico: Cuando todas las MA se alinean hacia arriba: Stack Up Cuando todas las MA se alinean hacia abajo: Stack Down Si las MAs no están alineadas: Apilar Ninguna Disponible gratuitamente aquí: https://www.mql5.com/en/market/product/69539
Puede posicionar el bloque pequeño en su gráfico. Y obtener el estado actual del Stack. Es simplista y muy eash de
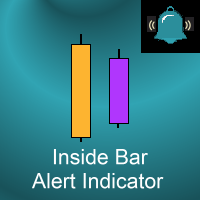
Este indicador marca Inside Bars (barras con un máximo más bajo y un mínimo más alto que la barra anterior) en su gráfico. También enviará alertas cuando se forme una, incluso por correo electrónico o notificación push a su teléfono . Es ideal para cuando quieres ser notificado de la formación de una inside bar pero no quieres tener que sentarte delante de tu gráfico todo el día. Puede configurar todos los ajustes, incluyendo: Qué símbolo (si lo hay) se traza para resaltar una barra interior Si
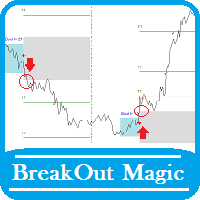
<< Ver cómo funciona en YouTube >> También puede descargar el script de este indicador de forma gratuita aquí: BreakOutMagic_EA.ex4 Luego cópielo en la siguiente dirección: ...\MetaTrader 4\MQL4\Expertos Tenga en cuenta que para que el script funcione, debe haber descargado y activado ya el indicador Break Out Magic del mercado. Posibilidades:
Señal de flecha para comprar, vender y alcanzar los objetivos Señal de alerta enviar correo Ejecutar archivo de audio personalizado El indicador Break Ou

El Indicador MT4 GGP Wave Trend Oscillator es una herramienta de volatilidad y momentum diseñada para ayudar a los operadores a optimizar su rendimiento en las operaciones y proporcionar a los operadores a encontrar las inversiones de mercado más precisas. Este indicador es la conversión MT4 del Indicador WaveTrend Oscillator [WT] por " LazyBear " en el sitio web de Trading View y se añaden algunos métodos de alerta para proporcionar alertas en tiempo real cuando se genera una señal de trading,

Este indicador muestra la tendencia principal, la zona de entrada y la zona de salida. Este es un indicador muti-marco de tiempo, por lo que siempre se repinta en el período actual del marco de tiempo superior.
Características Histograma de colores: indica la tendencia principal, el tomate significa que el mercado es bajista, y el azul cielo significa que el mercado es alcista. Bandas azules interiores : es la zona de entrada para el mercado de entrada, el mercado es relativamente seguro para

El indicador UT Bot Alert MT5 es una herramienta avanzada de análisis técnico diseñada para ayudar a los operadores a optimizar su rendimiento comercial. Este indicador es la conversión MT5 del indicador UT Bot alerts de "QuantNomad " en el sitio web Trading View y se añaden algunos métodos de alerta para proporcionar alertas en tiempo real cuando se genera una señal de trading, con el fin de permitir a los traders actuar de forma rápida y eficiente. Características principales: Tipos de alerta:

Super oscillator indicator es un oscilador diseñado para calcular puntos de inversión de tendencia. Un conjunto de cálculos de barras y un conjunto de algoritmos para calcular las inversiones de tendencia. Sistema de sondeo de niveles con tendencias de alta probabilidad. Todas estas características se combinan para facilitar a los inversores la búsqueda de tendencias.
Sugerencias y características Hay dos niveles en el indicador super oscilador. Están en los niveles de 0,5 y -0,5. La barra del

Escáner definitivo de seguimiento de tendencias ¿Está cansado de hojear manualmente docenas de gráficos, buscando desesperadamente la próxima gran tendencia? ¿Siente que se le escapan constantemente las mejores entradas o que entra en mercados agitados y laterales? La búsqueda de tendencias fuertes y fiables ha terminado. Presentamos el escáner de seguimiento de tendencias definitivo: su centro de mando todo en uno para dominar los mercados. Este potente panel de control para MT4 está meticulosa
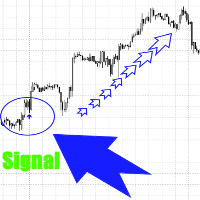
Este indicador no redibuja las señales y esto significa que donde dibuja una flecha permanecerá allí. Las señales se dibujan aquí y ahora, y no después de un tiempo, cuando el precio ha pasado lejos.
El indicador es perfecto para el mercado de tendencia.
El indicador es un asistente en el comercio, que da una señal para comprar o vender, y usted decide utilizar las recomendaciones del indicador o no.
El precio del indicador es mínimo y puede crecer en cualquier momento.
Funciona en cualquie

"La tendencia es tu amiga" es uno de los dichos más antiguos y conocidos de los mercados financieros. Sin embargo, este mensaje sólo representa la mitad del cuadro. El dicho correcto debería ser: "La tendencia es tu amiga sólo hasta que termina". El filtro de tendencia KT resuelve este problema indicando claramente el inicio de una tendencia alcista y de una tendencia bajista mediante una ecuación de promediación de las series de precios. Si la dirección de la tendencia no está clara, muestra la

Smooth Heikin Ashi proporciona una señal más suave de las tendencias alcistas o bajistas que las velas japonesas regulares, o incluso las velas Heikin Ashi estándar. Heikin Ashi es un patrón de velas alternativo que ha estado en uso desde su invención en Japón en el 1700. En las velas japonesas normales, hay mucho ruido con velas mixtas bajistas y alcistas una al lado de la otra, incluso durante las tendencias. Heikin Ashi reduce este ruido dejando una representación visual más fácil de las tend

KT Trend Magic muestra la tendencia en el gráfico utilizando la combinación del impulso del mercado y la volatilidad. Se puede utilizar para encontrar nuevas entradas o confirmar las operaciones producidas por otros EA/Indicadores.
Uso
Arrastre y suelte el escáner MTF que escanea las nuevas señales a través de múltiples marcos de tiempo. Encuentra nuevas entradas en la dirección de la tendencia. Mejora la precisión de otros indicadores cuando se utilizan conjuntamente. Puede ser usado como un n
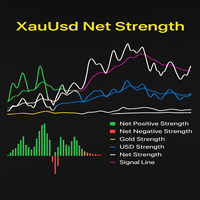
El indicador XauUsd Net Strength es una herramienta profesional de fortaleza del mercado diseñada para seguir y comparar el rendimiento relativo del oro (XAU) frente al dólar estadounidense (USD ) a través de una cesta diversificada de pares de divisas. En lugar de basarse en un único gráfico, agrega información de múltiples pares basados en el oro y el dólar, aplica factores de ponderación y traduce los resultados en una comparación de fuerza fácil de leer. El indicador traza seis componentes e
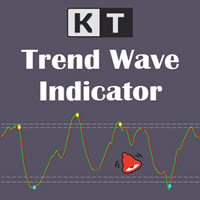
KT Trend Wave es un oscilador basado en la combinación de medias móviles de precio, exponencial y simple. Por lo general, funciona muy bien para captar las inversiones de precios a corto plazo durante el mercado de tendencia en curso. Los cruces alcistas y bajistas de las líneas principal y de señal pueden utilizarse como señales de compra/venta (punto azul y amarillo). También se puede utilizar para encontrar el mercado sobrecomprado y sobrevendido. Las señales de compra y venta que aparecen de

RSI Signals es un indicador simple de tipo tablero que muestra los valores del oscilador RSI (Indice de Fuerza Relativa) en distintos instrumentos y marcos de tiempo escogidos por el usuario. Además, puede ser configurado por el trader para que muestre señales cuando el RSI está en condición de sobrecompra/sobreventa, cuando cruza estos niveles o cuando cruza el nivel 50, que en algunas estrategias resulta de importancia. Es sencillo y fácil de configurar. Por si solo, no debe usarse como un si

Introducción Los patrones armónicos se utilizan para predecir posibles puntos de inflexión. Tradicionalmente, los patrones armónicos se identificaban manualmente conectando los puntos máximos y mínimos del gráfico. La detección manual de patrones armónicos es dolorosamente tediosa y no es adecuada para todo el mundo. A menudo se está expuesto a la identificación subjetiva de patrones con la detección manual de patrones. Para evitar estas limitaciones, Harmonic Pattern Plus ha sido diseñado para
El indicador Ichimoku es todo un sistema en sí mismo con una increíble tasa de ganancias. muchos comerciantes sienten que el gráfico se ve como un lío cuando añadimos el indicador para el gráfico esto se debe a que hay demasiados elementos presentes en el indicador ahora tenemos una solución para eso "TT Ichimoku on off button indicator" ACERCA DE ESTE INDICADOR Este es un indicador de Ichimoku que tiene la función de alternar por separado para cada elemento, es decir, botón de nube Kumo, botón

Muestra tu Hora Local en tus gráficos
Muestra tu hora local en lugar de (o junto con) la hora del servidor MT4.
Muestra una cruz que resalta la hora actual de la vela.
Se ajusta automáticamente en función del zoom del gráfico (acercar o alejar).
Se muestra en todos los marcos temporales (M1 - Mes), y se ajusta automáticamente al cambiar el marco temporal del gráfico.
Maneja zonas horarias especiales de ½ hora , como la India.
Renderizado rápido ( sin retardo) al desplazarse por los gráfico
Vea y compare los swaps de todos los símbolos del Market Watch en un solo panel. Una herramienta útil para los operadores a los que les gusta utilizar el swap en su beneficio, o simplemente evitar operar contra tipos de swap castigados. Elija si desea ver los swaps sin editar; ajustar los swaps para que se muestren como un porcentaje del Average True Range (ATR); o mostrar la cantidad de divisa que obtendrá cada día por operar con el símbolo utilizando un tamaño de lote determinado. Ordene los s
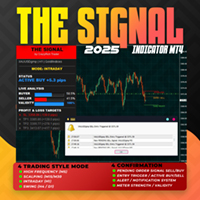
Visión general El Sistema Signal Premium para Todos los Pares es un asistente de trading inteligente diseñado para Forex, Oro (XAUUSD) e Índices.
Se adapta automáticamente a cualquier marco temporal y proporciona niveles claros de entrada, Stop Loss y Take Profit para apoyar un trading consistente y seguro. Este indicador ayuda a los operadores a identificar configuraciones de alta probabilidad a través de múltiples mercados y estilos de negociación - si usted prefiere scalping, intradía, o
FREE

¡Indicador de tendencia MT4 con una probabilidad de alcanzar un beneficio del 70-90%! Funciona sin redibujar y retrasos. Trend Master PRO muestra buenos resultados en todos los instrumentos de negociación: divisas, metales, índices, acciones, cryptocurrencies. Plazo recomendado: H1-H4.
Más información sobre el indicador está aquí: https://www.mql5.com/en/blogs/post/744748
Recomendaciones de uso
Utilizar la detección automática del período La principal característica del indicador es la funció
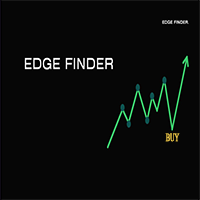
(Sorprendentemente simple, poderosamente rentable) Edge Finder es su asistente visual de trading todo en uno, diseñado para eliminar el ruido del mercado y destacar las oportunidades de trading de alta probabilidad de un vistazo. Cómo funciona (la idea central): En lugar de sobrecargar su gráfico con números complejos, Edge Finder utiliza un sistema único, codificado por colores para pintar el panorama del mercado con claridad. Visualización de Tendencia y Momento: El indicador analiza el mercad

Indicador de flujo institucional Una herramienta inteligente basada en el volumen que detecta las zonas de actividad institucional a través de patrones directos de flujo de órdenes.
Revela dónde operan las grandes instituciones. Un indicador de volumen avanzado que filtra el ruido para identificar probables patrones institucionales. Características principales Detección inteligente de grupos Identificación automática Clasificación de señales: Violeta / Amarillo - Zona institucional - Actividad i

El indicador Master Candle (MC) detecta automáticamente las "Velas Maestras", también conocidas como "Velas Madre", es decir, las velas que engullen a varias velas que les siguen. Ver capturas de pantalla. Puede elegir cuántas velas debe engullir la Vela Maestra. Por defecto está ajustada a 4. Siéntase libre de cambiar el color y el grosor de las líneas como más le convenga.
Encuentro este indicador muy útil para identificar congestiones y rupturas, especialmente en gráficos de 60 minutos. Norm
FREE

El indicador muestra el cruce de nivel cero del Oscilador Acelerador (AC) en forma de puntos en el gráfico. En los ajustes del indicador se puede especificar el número de barras en el historial para mostrar las señales, así como el desplazamiento de los puntos con respecto a una barra. Parámetros Barras - número de barras en el historial para mostrar las señales del indicador; Desplazamiento - desplazamiento de los puntos con respecto a las barras.
FREE
Indicador de Señales de Estrategias de Patrones Gráficos
Visión general El Indicador de Señales de Estrategias de Patrones Gráficos es un completo panel para MetaTrader 4 diseñado para ofrecer a los operadores una potente visión general de las posibles configuraciones de patrones gráficos en múltiples mercados. Supervisa una lista personalizable de instrumentos en tiempo real, mostrando información clara y procesable directamente en su gráfico. Esta herramienta está diseñada para ayudar a los o

¡Domine el mercado con CCI Crossover Master! ¡Deje de adivinar y empiece a operar con confianza ! El indicador CCI Crossover Master es su arma secreta para capturar movimientos de alta probabilidad basados en análisis probados de impulso y tendencia. Simplifica la compleja estrategia "CCI Crossover Master ", dándole señales claras de Compra y Venta directamente en su gráfico. Ventajas clave que impulsan su éxito: Señales de entrada de precisión: No vuelva a perderse una operación de alto potenc
FREE

Indicador de Ruptura de Fuerza de Divisas (Currency Strength Breakout Indicator)
Obtén una ventaja en tu trading con el Indicador de Ruptura de Fuerza de Divisas , una herramienta poderosa que analiza ocho divisas en múltiples marcos temporales (M1, M5, M15, M30 y H1), todo en una ventana fácil de leer. Identifica las divisas más fuertes y más débiles, y opera retrocesos con precisión utilizando alertas que te ayudarán a entrar en las tendencias en el momento adecuado. Características principal
FREE

Versión MT 5 MA Ribbon MT4 MA Ribbon es un indicador mejorado con 8 medias móviles de períodos crecientes. MA Ribbon es útil para reconocer la dirección de la tendencia, posibles reversiones y puntos de continuación en el mercado. También indica potenciales puntos de entrada, toma de ganancias parciales y puntos de salida. El precio entrando, saliendo o retesteando el Ribbon y un número definido de cruces de MA pueden indicar posibles puntos de entrada para posiciones largas y cortas. Ofr

Indicador que muestra la hora de los principales mercados comerciales del mundo. Asimismo, muestra la sesión actual. Es muy sencillo de utilizar. Apenas ocupa espacio en el gráfico. Se puede utilizar junto con asesores y otros paneles, tales como VirtualTradePad . Versión con representación analógica del reloj en el gráfico.
Otras características: En los parámetros de entrada de las opciones se dispone de: Mostrar/Ocultar pistas al poner encima el cursor, así como la lengua de las pistas Engl
FREE
Tablero de Señales de Estrategias Algorítmicas y Cuánticas para MT4
Lleve sus operaciones de divisas al siguiente nivel con el Tablero de Señales AQS, una herramienta completa y potente diseñada para operadores serios. Este indicador elimina la necesidad de cambiar constantemente entre los gráficos, proporcionando un tablero centralizado, todo-en-uno que supervisa todo el mercado de divisas para usted. Construido sobre una base de algoritmos probados y principios de comercio cuantitativo, el tab
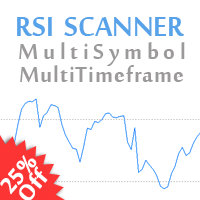
25% de descuento. Precio original: $40 RSI Scanner es un panel de control RSI multi-símbolo y multi-marco de tiempo que monitorea el indicador Relative Strength Index para ver si el precio entra y sale de sobrecompra y sobreventa en hasta 28 símbolos y 9 marcos de tiempo.
Descargar Demo aquí (Escanea sólo M1 y M5) Descripción de la configuración aquí Versión MT5 aquí
Características del RSI Scanner: Señala RSI entrando y saliendo de las zonas de sobrecompra y sobreventa. Monitorea 28 instrume

Pivot Classic, Woodie, Camarilla, Fibonacci and Demark
Floor/Classic Los puntos de pivote, o simplemente pivotes, son útiles para identificar posibles niveles de soporte/resistencia, rangos de negociación, reversiones de tendencia y sentimiento del mercado al examinar los valores máximo, mínimo y de cierre de un activo. Los puntos de pivote Floor/Classic se pueden calcular de la siguiente manera. Pivot Point (P) = (High + Low + Close)/3 S1 = P * 2 - High S2 = P - (High - Low) S3 = Low – 2*(High
FREE
Indicador Forex Target Zones - Domine los niveles clave de soporte y resistencia
Desbloquee el poder del trading preciso con el indicador Forex Target Zones, la herramienta definitiva para identificar zonas de compra y venta de alta probabilidad basadas en los máximos y mínimos semanales y diarios anteriores. Diseñado tanto para scalpers como para swing traders, este indicador destaca los niveles críticos en los que es probable que reaccione el precio, lo que le proporciona una ventaja competi
FREE
Deje de adivinar, empiece a operar: ¡Presentamos el Indicador Premium MA Signal! ¿Está cansado de gráficos confusos y señales contradictorias que le cuestan dinero? El Indicador Premium MA Signal es su solución. Está diseñado para cortar a través del ruido del mercado y ofrecer señales de trading claras y seguras directamente en su gráfico. No se trata sólo de una Media Móvil básica; es un sistema de análisis de tendencias completo y profesional diseñado para ayudarle a detectar operaciones de a
FREE
Indicador ADX utilizado en el método de las Agujas de Didi que te facilitará mantenerte en la operación, mientras esté azul no necesitarás mirar otras señales para salir de la operación y por el contrario mientras esté amarillo mantendrás la venta. Todo de forma rápida y visual. ¡¡¡¡El indicador ADX muestra si hay una tendencia en el mercado, este indicador usado junto con las agujas es la combinación perfecta para surfear fuertes movimientos de mercado!!!!
FREE

Este indicador traza otro símbolo en el gráfico actual. Se puede utilizar un marco temporal diferente para el símbolo, con la opción de mostrarlo en modo de marco temporal múltiple (1 vela superpuesta por varias velas del gráfico). Se proporcionan indicadores básicos. Para ajustar la escala de precios de diferentes símbolos, los precios superpuestos se escalan al espacio de precios del gráfico visible.
Características Introducción de símbolos y marcos temporales Visualización MTF opción de inve
FREE

Este indicador está diseñado sobre la base del indicador de origen móvil
Cuando el indicador de origen móvil rompe el precio, este indicador da una señal
Es útil para una mejor visualización de las señales y el análisis sobre ellas
Atributos: Puede utilizarse en todos los símbolos Puede utilizarse en todos los marcos temporales Muchas señales Ajustes sencillos y rápidos Manera fácil de trabajar
Ajustes: período: como la media móvil ajustes alarmShow: Si desea recibir una alerta en Metatrader d
FREE

Nuestro equipo ha logrado por fin el resultado esperado .
Hemos creado inteligencia artificial para el comercio de opciones binarias. ¿No se lo cree? Muchos usuarios ya lo han valorado positivamente. Los resultados le sorprenderán a usted también. Este indicador emite señales para una opción binaria a través de un canal de telegram. Todas las señales son fiables y de alta calidad.
Leer más ¡¡¡!!! ATENCIÓN !!!
No has soñado ¡¡¡!!! CÓMO GANAR AHORA MISMO? El canal de señales más exitoso
FREE

AVISO IMPORTANTE – SE REQUIERE LICENCIA Y ACTIVACIÓN
Instrucciones de activación:
Al completar su compra, por favor contáctenos inmediatamente para recibir su clave de licencia, contraseña o detalles de activación. Sin estos, el software no funcionará. Estamos aquí para garantizar un proceso de activación sin problemas y ayudarlo con cualquier pregunta.
Personalización multilingüe
Para mejorar su experiencia de trading, ofrecemos personalización completa del software en múltiples id

Notificador de Volatilidad de Alta Precisión V1.10 Desarrollado por: Grazia-system-com Título: Deje de perseguir la volatilidad: Obtenga una notificación solo cuando comience la verdadera ruptura. La herramienta profesional con filtro de ruido que transforma tu MT4/MT5 en un sistema de monitorización inteligente y proactivo. Nunca más se pierda un movimiento a nivel institucional. Por qué este detector es diferente (Inteligencia de doble capa con filtro de ruido) La mayoría de las herramien
FREE
TMA_KC PRT is non-redrawn channel indicator and can be used to identify trend and support and resistance levels.
Indicator settings allow you to assign a specific coefficient to each price channel, which makes it possible to narrow or expand each channel separately. The TMA_KC PRT indicator is a multicurrency instrument, so the choice of a timeframe depends solely on the trader’s preference. TMA_KC PRT indicator can be used on any time frame, so you can easily make the indicator an i
FREE
MetaTrader Market - robots comerciales e indicadores técnicos para los trádres, disponibles directamente en el terminal.
El sistema de pago MQL5.community ha sido desarrollado para los Servicios de la plataforma MetaTrader y está disponible automáticamente para todos los usuarios registrados en el sitio web MQL5.com. Puede depositar y retirar el dinero a través de WebMoney, PayPal y tarjetas bancarias.
Está perdiendo oportunidades comerciales:
- Aplicaciones de trading gratuitas
- 8 000+ señales para copiar
- Noticias económicas para analizar los mercados financieros
Registro
Entrada
Si no tiene cuenta de usuario, regístrese
Para iniciar sesión y usar el sitio web MQL5.com es necesario permitir el uso de Сookies.
Por favor, active este ajuste en su navegador, de lo contrario, no podrá iniciar sesión.