Indicadores técnicos para MetaTrader 4 - 83

El Imperio Garuda - Opciones Binarias Experimente el epítome de la síntesis comercial, donde la metodología Ichimoku de larga tradición se entrelaza a la perfección con los venerados indicadores occidentales. Es una mezcla armoniosa: Europa dándose la mano con Japón, un verdadero testimonio del poder de la colaboración financiera global. Tras años de observación y análisis, he llegado a una conclusión: La maestría se consigue a través de la especialización. Mi viaje con el EURJPY ha sido transfo
El indicador de COMPRA/VENTA más preciso de este mercado.
Funciona basado en el resultado de múltiples EMAs, con algunos promedios y algoritmos específicos . La salida de una EMA es la entrada para otra EMA.
Funciona en Forex, Materias Primas, Indices, Acciones, Cripto, ... en todos los marcos de tiempo (pero recomiendo 1H o 4H) y en cada brooker.
Si quieres este y todos mis otros productos GRATIS, crea una cuenta aquí y luego escríbeme y te enviaré todos mis productos actuales y futuros GRA
️Trader's & Inversores ️
¿Está usted realmente tenso cómo comprar / vender ? ¿Quieres pips mínimo diario para la liquidación de su objetivo deseado? ¿Quieres ganancias diarias? ¿Quieres batir al mercado?
️ Entonces "Flecha Asesina" te ayudará . ️ "Killer Arrow" capaz de darle ganancias diarias ️ Usted capaz de batir el mercado en cada día base
Sistema de uso
¡Siga nuestras reglas para utilizar este indicador! ️ Utilice sólo el par de divisas volátil
RSI multitimeframe es un indicador simple pero útil que le permite conocer el estado de RSI en todos los marcos de tiempo, de 5 minutos a mensual. En la entrada puede insertar su configuración preferida que se aplicará a todo el indicador. Se muestra un histograma verde si el valor es superior a 50. En cambio, aparece un histograma rojo si el valor es inferior a 50. Si hace clic en la etiqueta timeframe puede cambiar el timeframe en el gráfico seleccionado. Descubrirá lo importante que es compre
Stochastic multitimeframe es un indicador simple pero útil que le permite conocer el estado del estocástico en todos los marcos de tiempo, desde 5 minutos hasta mensual. En la entrada puede insertar su configuración preferida que se aplicará a todo el indicador. Se muestra un histograma verde, si el valor es superior a 50. En cambio, aparece un histograma rojo si el valor es inferior a 50. Si hace clic en la etiqueta timeframe puede cambiar el timeframe en el gráfico seleccionado. Descubrirá lo
Analyzer es un indicador multi timeframe que le permite conocer el estado del RSI , Estocástico y ADX en todos los marcos de tiempo, desde 5 minutos hasta mensual. En la entrada puede insertar su configuración preferida que se aplicará a todo el indicador. Operar con este indicador es muy sencillo. Usted puede seguir la tendencia o encontrar la mejor oportunidad para la inversión. Un histograma verde aparece cuando el indicador reporta una tendencia alcista. Un histograma rojo aparece si los ind
FFXMV Dashboard Plus
This is a custom indicator created to give Traders a full view of what is going on in the market. It uses a real time data to access the market and display every bit of information needed to make successful trading. The PLUS there to produce the kind of RESULTS as you see in the SCREENSHOTS, I added a MultipleOrder Utility EA with it with instructions on how to use it with FFXMV Dashboard.
INSTALLATION : Read the MANUALS that comes with the rest of the PACKAGE after you ha
El Indicador de Sesiones de Mercado para MT4 le ayuda a predecir los giros del mercado detectando las principales zonas de oferta y demanda. Estos puntos de pivote tienden a ocurrir después de que una nueva sesión ha comenzado y la anterior todavía está abierta. También se utiliza para medir cuántos puntos o pips se mueve el mercado de media durante una sesión. Esto nos ayuda a colocar mejor nuestros take profits y stop losses. El indicador funciona con todos los pares de divisas, oro, plata, ma
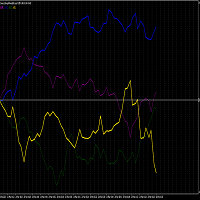
TENGA EN CUENTA QUE COMO MUCHOS INDICADORES DE ESTE TIPO EN ESTE MERCADO, ESTE INDICADOR NO FUNCIONARÁ COMO UNA DESCARGA DE DEMOSTRACIÓN PARA PROBADOR DE ESTRATEGIAS. Por lo tanto la opción de 1 mes al menor costo permitido de $10 está disponible para que usted lo pruebe. Una de las mejores maneras de operar es analizar instrumentos individuales en lugar de pares. Esto es imposible con los indicadores gráficos estándar en MT4. Este medidor de volatilidad y fuerza permite operar con el XAUUSD, X

El indicador emite una alerta cuando aparece en el gráfico un objeto del tipo especificado en los ajustes. También puede enviar mensajes de notificación por correo electrónico y push. Es una solución ideal cuando se desea realizar un seguimiento de la aparición de cualquier objeto gráfico creado por otros indicadores o EAs. Tiene dos modos de funcionamiento: Con indicadores que utilizan buffers para dibujar objetos. Con indicadores que no utilizan buffers. Puede determinar el tipo de indicador

Very Fast Arrows (VFA) es un indicador completo con visualización en flechas que tiene pocas señales falsas con un tiempo de retardo mínimo.
VFA es un indicador contra tendencia. Sin embargo, su algoritmo flexible se ajusta al comportamiento del mercado y se vuelve más sensible a los retrocesos en caso de tendencia.
El algoritmo del indicador se basa en el análisis de ondas y puede optimizarse para cualquier par de divisas y marco temporal con un número mínimo de entradas. La posibilidad de opti
el indicador fue desarrollado para el mercado de divisas, se tuvo en cuenta los momentos en que hay un plano (movimiento lateral) en el mercado y se leyó que hay devergencia y esto es un olin de fenómenos fuertes, al final resultó para hacer esta herramienta línea azul es una señal de compra línea gris es un movimiento lateral línea roja es una señal de venta cuando se ve una señal, abrir un comercio, si una señal sobre el movimiento lateral aparece después de la línea de señal, entonces usted d

Vol 2 DPOC volumen vol 2 DOC-indicador de volumen horizontal dinámico para cualquier periodo de tiempo
Principales ajustes del indicador: Volumen Fuente-selección de datos para volúmenes (tick o real) DPOCOn-activación/desactivación del indicador DPOCFrom-fecha de inicio del cálculo DPOCTo-fecha de finalización del cálculo El indicador permite seleccionar manualmente zonas del gráfico para analizar los cambios del volumen máximo a lo largo del tiempo.
Puede hacerlo utilizando líneas verticale

Contacte con nosotros para cualquier orden personalizada, CodeYourTrade.com . El indicador Channel Breakout muestra los canales basados en el número de barras. Se utiliza para negociar las rupturas o retrocesos. ¡¡¡Breakout es bastante eficiente, ya que trata de obtener beneficios cuando el mercado se desploma!!! También puede inventar su propia técnica a partir de él. Después de conectar el indicador a un gráfico mostrará la siguiente información en el gráfico: 1. Información del canal 1 y can

Contáctenos para cualquier orden personalizada, CodeYourTrade.com .
El indicador Candle Close Time se utiliza para realizar un seguimiento del tiempo restante o transcurrido en una vela actual en cualquier punto del tiempo. Para ser notificado establezca el tiempo en formato DD:HH:MM:SS. Por ejemplo : EnableNotify = true & (Día Restante : Hora Restante : Minuto Restante : Segundo Restante) = 00:02:20:20. Digamos que el tiempo restante para cerrar la vela es 00:03:23:21 (DD:HH:MM:SS). Ahora, cua

El indicador de barras continuas se utiliza para seguir las barras continuas cerradas en una dirección. Por ejemplo : Barras Continuas = 3 (estamos buscando 3 barras continuas) Ahora, si (Apertura > Cierre) o (Cierre > Apertura) para 3 barras continuas es notificado vía email o alerta. Puede ocultar toda la información mostrada en el gráfico configurando falso en Mostrar en Gráfico . Configuración del Indicador: Configuración Principal Barras : Número de barras continuas que estamos mirando Conf

Contáctenos para cualquier pedido personalizado, CodeYourTrade.com .
El indicador Currency Sessions Highlight se utiliza para resaltar las sesiones. El número máximo de sesiones visibles a la vez es 3. El usuario tiene que introducir la hora de inicio y fin de la sesión en el formato HH:MM. Puede ocultar toda la información mostrada en el gráfico estableciendo false en Mostrar en gráfico . Configuración del Indicador: Configuración principal Mostrar Sesión 1 : Dibuja o no la Sesión 1 en el gráf

Este indicador proporciona la visión técnica utilizando las siguientes herramientas: Puntos de giro Indicadores técnicos Medias móviles Los puntos pivote se calculan utilizando cinco métodos diferentes: Clásico Fibonacci Camarilla Woodie DeMark Con el indicador técnico , puede encontrar las señales de trading utilizando la combinación de diferentes indicadores. Soporta los siguientes indicadores técnicos: RSI Estocástico Estocástico RSI MACD ADX CCI ATR Oscilador último ROC Potencia alcista/baji

Póngase en contacto con nosotros para cualquier pedido personalizado, CodeYourTrade.com .
Los canales de Keltner son envolventes basados en la volatilidad. La media móvil dicta la dirección y el ATR establece la anchura del canal. Es un indicador de seguimiento de tendencia utilizado para identificar retrocesos. Los canales también se pueden utilizar para identificar los niveles de sobrecompra y sobreventa cuando la tendencia es plana. Estrategia de Trading Hemos creado 2 zonas ZONA DE VENTA y

Contacte con nosotros para cualquier pedido personalizado, CodeYourTrade.com .
El histograma MACD mide la distancia entre la línea MACD y la línea de señal MACD. Dos términos importantes se derivan del histograma MACD son: - Convergencia : El histograma MACD disminuye en altura. Esto ocurre porque hay un cambio de dirección o una desaceleración en la tendencia. Cuando esto ocurre, la línea MACD se acerca a la línea de señal MACD. - Divergencia : El histograma MACD está aumentando en altura (ya

Contáctenos para cualquier orden personalizada, CodeYourTrade.com .
El indicador de Media Móvil Múltiple (MA) se utiliza para encontrar la dirección de la tendencia utilizando múltiples indicadores de Media Móvil. Se calcula utilizando las siguientes reglas: - Venta < MA, es VENTA - Oferta > MA, es COMPRA - Ask > MA > Bid, es None (sin señal ) Después de conectar el indicador a un gráfico mostrará la siguiente información en el gráfico: Múltiples MAs ordenadas por su método Conteo de compra y v

Contacte con nosotros para cualquier pedido personalizado, CodeYourTrade.com .
Este indicador se utiliza para calcular los puntos pivote utilizando 5 métodos diferentes: Clásico Fibonacci Camarilla Woodie DeMark Después de adjuntar el indicador a un gráfico mostrará la siguiente información en el gráfico: Niveles de puntos pivote del gráfico actual utilizando diferentes métodos. Configuración del indicador Calculadora de Puntos Pivote Mostrar calculadora de puntos pivote: Mostrar todos los punt

Póngase en contacto con nosotros para cualquier pedido personalizado, CodeYourTrade.com .
El indicador estocástico RSI es esencialmente un indicador de un indicador. Se utiliza en el análisis técnico para proporcionar un cálculo estocástico al indicador RSI. Esto significa que es una medida del RSI relativa a su propio rango alto/bajo durante un período de tiempo definido por el usuario. Este indicador se utiliza principalmente para identificar condiciones de sobrecompra y sobreventa. Puede oc

El indicador Spread & Swap se utiliza para comprobar el spread y el swap del par actual. Puede ocultar toda la información que se muestra en el gráfico estableciendo false en Mostrar en gráfico . Configuración del indicador: Configuración principal Mostrar Spread : Muestra el spread del par actual. Mostrar Swap (por lote) : Muestra los gastos de swap por lote del par actual. Configuración de la pantalla Visualización : Muestra la información del indicador en el gráfico . Ubicación : Ubicación de

Con el indicador de Análisis Técnico, puede encontrar las señales de trading utilizando la combinación de diferentes indicadores técnicos. Soporta los siguientes indicadores técnicos: 1. RSI 2. Estocástico 3. Estocástico RSI 4. MACD 5. ADX 6. CCI 7. ATR 8. Oscilador Último 9. ROC 10. Fuerza del Toro/Oso Después de conectar el indicador a un gráfico mostrará la siguiente información en el gráfico: 1. Indicadores técnicos, sus valores y la señal generada a partir de ellos. 2. Conteo de compra y ve

Contacte con nosotros para cualquier orden personalizada, CodeYourTrade.com .
Con el Indicador Técnico Multi-Timeframe, puede identificar fácilmente los niveles de sobreventa/sobrecompra o los puntos de niveles de compra/venta en varios timeframes diferentes utilizando un solo gráfico. Puede confirmar operaciones a corto plazo mediante niveles de plazos superiores. Soporta 4 indicadores técnicos a partir de ahora Estocástico, RSI, SAR Parabólico y Heiken Ashi. Después de conectar el indicador a

Póngase en contacto con nosotros para cualquier orden personalizada, CodeYourTrade.com .
El indicador Trade Notifier se utiliza para notificar la apertura o cierre de las operaciones a través de correo electrónico o alerta. También puede enviar actualizaciones regulares de las operaciones por correo electrónico. Después de adjuntar el indicador a un gráfico, mostrará la siguiente información en el gráfico: 1. Información de alerta 2. Información del correo electrónico 3. Detalles a incluir en e

Contáctenos para cualquier orden personalizada, CodeYourTrade.com .
El indicador de Dirección de Tendencia encuentra la dirección de la tendencia usando 2 indicadores ADX y SAR Parabólico. Cambie el color de la fuerza de Venta y Compra desde la pestaña Colores en la configuración del indicador. Después de conectar el indicador a un gráfico mostrará la siguiente información en el gráfico: 1. SAR Parabólico: Valores de entrada del indicador SAR Parabólico . 2. ADX: Valores de entrada del indicado
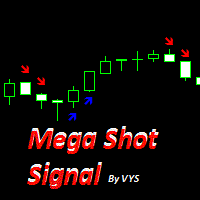
Esta herramienta está diseñada para las opciones binarias. La precisión de esta herramienta es más del 75%. Las operaciones de apertura vale 1 vela. Para aumentar la rentabilidad, puede utilizar la gestión de martingala de 4 rodillas. vale la pena abrir una operación de compra cuando aparece una señal en forma de flecha azul vale la pena abrir una operación de compra cuando aparece una flecha roja Se recomienda operar en marcos temporales de m1 a m15 mayor precisión en los marcos de tiempo m1 y
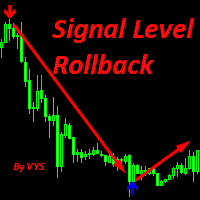
Señal Nivel Rollback la herramienta está diseñada para determinar los mínimos y máximos para determinar el pivote del mercado se recomienda su uso con niveles de soporte de resistencia señal de compra flecha azul señal de venta flecha roja Se recomienda su uso en un marco temporal a partir de M15 ya que hay grandes movimientos y menos ruido de mercado Stoploss se establece para el mínimo o máximo más cercano o a una distancia de 10-30 puntos.....
Algoritmo único de comercio de tendencia con filtrado avanzado y muchas características que deben convertirse en una parte de su arsenal de comercio. Este indicador puede darle también asesores de comercio (con objetivo de toma de beneficios), escáner de tasa de éxito y mucho más. TrendMagiX PRO viene con escáner multi-par y multi-marco de tiempo incorporado que es totalmente ajustable. El usuario puede seleccionar sus propios símbolos y marcos de tiempo para monitorear. + TODAS las característi
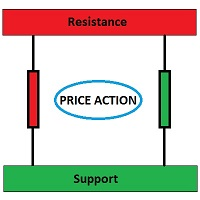
Este es un indicador de nivel de resistencia de soporte de acción de precio para MT4, simplemente trabajando en todos los marcos de tiempo y todos los tipos de gráficos. Crea el mayor soporte/resistencia en el marco de tiempo especificado. También puede añadir un nivel de soporte/resistencia manualmente. Para hacer esto, primero añada una línea horizontal al gráfico y renómbrela a 'Línea'.
Variables de entrada: timeFrame: Puede seleccionar uno de estos valores (M1, M5, M15, M30, H1, H4, D1, W1
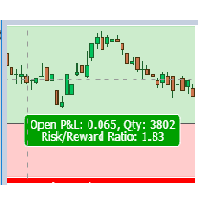
Panel Riesgo-Recompensa Esta es una herramienta útil para planificar un riesgo de comercio para recompensar visualmente. El indicador es muy simple de usar con ajustes mínimos. Largo o Corto Puede utilizar el indicador tanto para posiciones largas como cortas.
Calculadora de tamaño de lote También puede utilizar este indicador como una calculadora de tamaño de lote. Si establece la cantidad de riesgo el indicador calculará el tamaño del lote para usted basado en la línea de stop loss. No necesi
Actualización de ECHO INDICATOR V2.2
Un indicador de alta calidad trabaja con la tendencia y el patrón. La herramienta es un buen asistente para los comerciantes utilizan varios niveles en el comercio.
Cuando el precio se acerca a un nivel, el indicador produce una alerta de sonido y (o) notifica en un mensaje emergente, oa través de notificaciones push. Una gran herramienta de toma de decisiones para la apertura de órdenes. Se puede utilizar cualquier marco de tiempo y se puede personalizar.

Se trata de un canal de precios que muestra cinco niveles de precios importantes en el gráfico. Esos niveles son: 1. 1. El máximo más alto (HH) de las x barras anteriores.
2. El mínimo más alto (HL) de las x barras anteriores.
3. La línea central.
4. El máximo más bajo (LH) de las x barras anteriores.
5. El mínimo más bajo (LL) de las x barras anteriores. Cómo Capta Bermaui Channels el área de Sobrecompra
Piense en la distancia entre los niveles HH y HL como un área de sobrecompra.
Cuando las ve

Indicador de Fibonacci basado en fractal.Este software puede dibujar automáticamente la línea proporcional de la sección áurea de dos líneas de tendencia, y marcar todos los precios altos y bajos recientes.Y el valor porcentual de volatilidad es un indicador de oscilación multiciclo y multidivisa.Es muy eficaz para que los operadores encuentren líneas de soporte y resistencia y encuentren puntos de entrada y salida cerca de ellas.

Keris Keramat es un indicador que le da señales de cuándo comprar o vender. Es un indicador que no repinta. Se puede utilizar en casi todos los instrumentos. El marco de tiempo a utilizar es M15. Sólo para MT4 de escritorio. Es bueno para Intraday o Swing Traders. Muy fácil de usar incluso para un trader novato. No es necesario cambiar ningún parámetro. Sólo plug & play. El indicador sólo pintará flechas, ya sea hacia arriba (para comprar) o hacia abajo (para vender). Todas las flechas pintadas
Cuadro de Mando de Señales Multidivisa y MultiTiempo Indicador Tablero de Señales Multi-Tiempo Multi-Moneda (MT4) Unifique su visión del mercado: ¡Señales Dinámicas y Análisis Avanzado entre Divisas y Plazos en MT4! El Tablero de Señales Multi-Tiempo Multi-Moneda es un tablero avanzado y altamente personalizable diseñado específicamente para MetaTrader 4 . Esta poderosa herramienta revoluciona su análisis de mercado mediante la consolidación de los conocimientos de numerosos símbolos y plazos
Fractal Reverse MTF - Indicador para determinar la señal fractal para cambiar la dirección de la tendencia para МetaТrader 4.
La señal se determina según las reglas descritas en el tercer libro de B. Williams:
- Para convertirse en una señal de COMPRA, el fractal debe TRABAJAR POR ENCIMA de la línea roja
- Para convertirse en una señal de VENTA, el fractal debe TRABAJAR POR DEBAJO de la línea roja
- Las señales no se redibujan/no se repintan .
La idea principal del indicador:
- Determinar
Indicador Trendlines Chart Patterns (MT4) Patrones gráficos automatizados y señales de ruptura para MT4: ¡Opere con Precisión! El "Trendlines Chart Patterns Indicator" es una herramienta avanzada de trading para MetaTrader 4 (MT4 ), meticulosamente diseñada para identificar señales de compra y venta de alta probabilidad basadas en la formación dinámica de líneas de tendencia robustas y patrones gráficos populares. Este potente indicador de divisas automatiza el complejo proceso de identificación
Multi Tendencia Compra Venta Señal (MT4 Indicador) Señales de Precisión para MT4: Confirmación Multi-Timeframe & ¡Entradas Tendenciales Fuertes! El "Multi Trend Buy Sell Signal" es un indicador de trading avanzado para MetaTrader 4 (MT4 ), meticulosamente diseñado para proporcionar señales de entrada altamente confirmadas con potentes alertas . Esta herramienta inteligente de Forex aprovecha una sofisticada combinación de condiciones Multi Time Frame (MTF ), integrando un conjunto de Medias Móv

Skalpex es un indicador de sistema para el análisis de diagnóstico de ondas de las primeras fases de una condición de mercado. El indicador se retrasa exactamente 1 barra. Muestra los retrocesos exactos de los precios, no redibuja sus valores, pero se retrasa 1 barra. Esto se debe al hecho de que la última (barra cero) aún no se ha formado antes del cierre, lo que significa que nadie sabe nunca dónde irá exactamente y dónde se cerrará. Podemos suponerlo. Para no intentar jugar a la adivinación,

Medidor de divisas Cuando operamos en Forex, operamos con un par de divisas a la vez. Por ejemplo EUR/USD. Si estamos largos en el EUR/USD significa que esperamos que el EUR gane fuerza en relación al USD. Si estamos cortos en el EUR/USD significa que esperamos que el EUR se debilite en relación al USD. Debería estar familiarizado con este concepto. Sin embargo, la clave de los pares es que sólo indican la fuerza de una divisa en relación con otra. Si vemos que el EUR/USD sube, ¿es porque el EUR

Divine indicator is based on the random forest machine learning algorithm. This is my first standalone product. In this indicator, all calculations of price patterns and the formation of indicator trading signals is performed through 43x Trees. I chose this amount to keep the indicator deep in training and reduce the size of the indicator. DIVINE indicator - universal indicator, can work with the following: EURUSD, USDCHF, GBPUSD, USDJPY . In the future I will conduct experiments to fin

O V E R B O U G H T - O V E R S O L D W A T C H E R Un detector de agotamiento de precios de mercado muy potente. Da la situación actual del sentimiento técnico del mercado.
Esta es una de las mejores herramientas si usted está scalping contra-tendencia.
V E R Y I M P O R T A N T E La herramienta no es un indicador de tendencia. Es un indicador de tendencia agotada que puede dar una posible señal de rebote del precio. Puede utilizar esta herramienta junto con su propia estr
Basado en los registros del curso de Yuri Antonov (academyfx.ru)
Canal de YouTube: https://www.youtube.com/playlist? list=PLj3wALUOwoZ9kdacS09K9bjD1zulR _ HJh
El indicador está destinado a personas que conocen la estrategia, pero les resulta difícil marcar el gráfico. Se acerca al nuevo sistema intensivo de MD.
Los parámetros por defecto se establecen a partir de mediados de 2019. ¡Para una cuenta EURUSD de 5 dígitos!
Usted puede trabajar en la de 4 caracteres después de que los parámetros
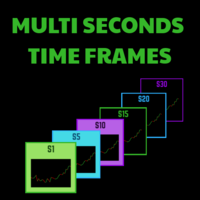
Generador de plazos de segundos para MT4 (S1, S5, S10, S15, S20, S30).
Características
1. El indicador genera timeframes en tiempo real, con cada nuevo tick al momento.
2. 2. El indicador también mide la distancia entre los puntos de extremo a extremo cuando se cierne "Esto, además, nos muestra cómo los movimientos son fuertes".
Ventajas
1. Fácil de detectar los mejores puntos de entrada y salida.
2. 2. Usted puede negociar fácilmente los comunicados de prensa cuando el mercado es muy

VR System no es sólo un indicador, es un sistema de negociación completo y bien equilibrado para operar en los mercados financieros. El sistema se basa en reglas comerciales clásicas y una combinación de indicadores Promedio móvil y canal Donchian . El Sistema VR tiene en cuenta las reglas para ingresar al mercado, mantener una posición en el mercado y las reglas para salir de una posición. Las reglas comerciales simples, los riesgos mínimos y las instrucciones claras hacen del sistema VR una es
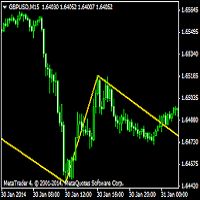
Zigzag x2 El indicador Zig Zag traza puntos en el gráfico cada vez que los precios se invierten en un porcentaje superior a una variable elegida previamente. A continuación, se trazan líneas rectas que conectan estos puntos. El indicador se utiliza para ayudar a identificar las tendencias de los precios. Elimina las fluctuaciones aleatorias de los precios e intenta mostrar los cambios de tendencia . El indicador reduce el impacto de las fluctuaciones aleatorias de los precios, resaltando el pode

Contacte con nosotros para cualquier pedido personalizado, CodeYourTrade.com .
El indicador Brent Wti spread muestra la diferencia del valor Brent y Wti. Estrategia de Trading: Identificar el rango de movimiento del spread. Para comprar la diferencia ejecute estas 2 operaciones "Comprar BRENT y Vender WTI". Para vender la diferencia ejecute estas 2 operaciones "Vender WTI y Comprar BRENT". Configuración del indicador: Configuración principal Máximo Indicador : Nivel máximo a mostrar en el indic

Indicador dualista con panel multifuncional El uso de indicadores de negociación forma parte de la estrategia de cualquier operador técnico. Combinado con las herramientas adecuadas, puede ayudarle a conocer mejor las tendencias de los precios. El indicador Veil combina los puntos de precio de un instrumento financiero en un marco temporal determinado y realiza cálculos resumidos. En pocas palabras, identifica las tendencias del mercado, mostrando los niveles actuales de soporte y resistencia, y
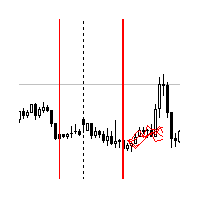
El indicador muestra el historial de precios. El historial se lee para las líneas verticales y se emite para la línea principal. Esas líneas son los cursores temporales. Puede utilizar el indicador para analizar el ciclo de precios a lo largo del tiempo y predecir así su movimiento. La duración de la predicción y el número de cursores temporales pueden fijarse en los parámetros del indicador. Además, puede vincular la línea principal a una nueva barra. Las líneas pueden desplazarse manualmente.
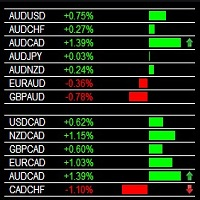
Multi Dashboard Scalper (Indicador MT4) Dominar Scalping: ¡Fuerza del Mercado Global y Análisis de Divisas Cruzadas en MT4! El Multi Dashboard Scalper es un innovador indicador de trading para MetaTrader 4 (MT4 ), diseñado para proporcionar señales de scalping altamente eficaces mediante el análisis de la verdadera fuerza de los pares de divisas cruzadas y varios mercados. Esta poderosa herramienta de forex cuenta con un tablero de indicadores único que calcula la fuerza propia de todos los pri

El indicador de superposición de gráficos muestra la acción del precio de diferentes productos en el mismo gráfico, lo que le permite evaluar cómo los diferentes símbolos fluctúan entre sí. Puede utilizarlo para tomar decisiones comerciales basadas en la convergencia / divergencia de los productos mostrados, por ejemplo, USDCAD - XTIUSD, EURUSD - USDCHF, etc. Utilización Encuentra productos sobrecomprados o sobrevendidos Se adapta al tamaño del gráfico, al zoom y al marco temporal Cálculo automá

Tres Bollinger superpuestos. Este indicador está listo para usar con tres bandas de Bollinger superpuestas. Ideal para operadores que aman las bandas de Bollinger que de esta manera pueden ver directamente desde un gráfico cómo se mueven las bandas de Bollinger en un marco de tiempo más alto sin tener que cambiar el gráfico y el marco de tiempo. Este indicador identifica los apretones reales que comienzan en tres marcos de tiempo diferentes. La señal se vuelve más válida y segura.
Este escáner monitoriza todo el mercado en busca de oportunidades de negociación para todos los símbolos y para todos los plazos. Usted no tiene que mirar todos los gráficos, para todos los símbolos y para todos los marcos de tiempo. Este escáner le avisará en su ordenador, o en su móvil, cuando se haya encontrado una oportunidad de comercio. Usted nunca tiene que perder una oportunidad de comercio! Este indicador está diseñado para escanear todos los pares y símbolos, para todos los marcos de t
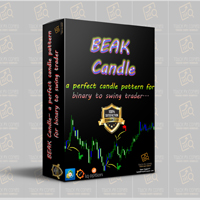
¿No encuentra la tendencia principal?
¿Desea entrar en contacto con la tendencia principal? Then BEAK Candle Is The Perfect Choice For You
¿Cómo Utilizar Este Patrón De Vela? ¡Tan simple como usted quiera! =>aquí puede seguir la VELA AZUL para entrar en cualquier comercio =>Vela azul debe venir después de la vela anterior CUERPO CERRADO =>Si la vela azul cubre y cierra con el cuerpo de la vela anterior

Este indicador SuperZig es un diseño especial para algunos comerciantes con el comercio ZigZag y Fibonacci . ( !!! NUEVO !!! +++ Soporte y Resistencia +++ ) Se dibujará al menos dos Fibonacci automáticamente en su período gráfico. Alertas cuando se crea / tocó el soporte / resistencia de la caja, se enviará push teléfono / notificación por correo electrónico a usted al mismo tiempo.
¡¡¡ZigZag + Fibo + BreakOutLine + SoporteResistencia = SuperZig !!!
Parámetro de entrada:
" Mostrar ZigZag " ::

¿Quiere operar de forma rápida, sencilla y obtener beneficios diarios? ¡Entonces nuestro nuevo indicador fue creado justo para usted! TURN es una estrategia multidivisa de autor que determina simultáneamente el final de una tendencia, los puntos de entrada y los niveles de beneficio estimados para cada operación. El indicador puede determinar los puntos de entrada en cualquier período de negociación, a partir del gráfico M5 a W1. Al mismo tiempo, para la comodidad del usuario, el punto de entra

Indicador muy preciso de la tendencia del mercado Ventajas
fácil, agradable visual y eficaz de detección de tendencias dado Siempre oportunidades funciona en todos los pares de divisas, cripto, materias primas, acciones, índices funciona en todos los marcos de tiempo, pero mayor TF 1-4Hr es más eficaz !!!! WARNING !!!! This is trend indicator, it searching for trends in the market! You need patience and you may see loosing trades in a row but that is normal! Do not panick! Once you detect the
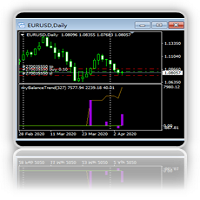
Indicador de la línea de tendencia de los ingresos del fondo de cuenta 1. Este indicador se utiliza para dibujar automáticamente una curva y un histograma de la cantidad de beneficios de la orden de negociación que se ha cerrado en la cuenta corriente y el saldo de la cuenta después de la posición,y los tres datos del volumen de transacciones, que es aplicable a todos los ciclos del gráfico.2. Los tres datos se pueden exportar a archivos CSV por fecha, que es conveniente para el análisis de dat

Un indicador de la familia del zigzag con niveles. En primer lugar, señalaré los argumentos a favor de la conveniencia de utilizar un indicador de niveles. Proporcionan al trader las siguientes ventajas:
Puntos de vista alternativos - el indicador de nivel ayuda a mirar los niveles desde el lado, compararlos con varios sistemas automáticos, identificar errores;
Ahorro de tiempo - reducción del coste del esfuerzo para la autoconstrucción de líneas;
Cálculo matemático exacto - es posible el cá

SignalRB - el indicador de flecha muestra los posibles puntos de entrada en el mercado en forma de flechas del color correspondiente: las flechas hacia arriba (azules) ofrecen abrir una compra, las flechas hacia abajo (rojas) - vender. La aparición de las flechas puede ir acompañada de señales sonoras si la opción de sonido está activada. Se supone que se entra en la siguiente barra después del puntero, pero puede haber recomendaciones no estándar para cada estrategia.
SignalRB "descarga" visu
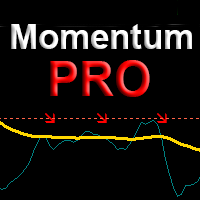
Versión profesional del indicador Momentum. Funciona muy bien en pares de divisas con tendencia, y también muestra con precisión dónde recargar posiciones por tendencia. Muestra la dirección de entrada en el gráfico con flechas y avisa cuando aparece un punto de entrada. Con una interfaz mínima tiene una alta funcionalidad. Características No tiene lag y ofrece una ventaja notable sobre el indicador Momentum estándar Interfaz gráfica sencilla e intuitiva, ajustes mínimos. Ajustes de cada movimie

Trend Giver es un indicador fácil de usar.
Bueno para Scalping y Trend Following.
si necesita ayuda sobre cómo utilizar este indicador,
estoy aquí para usted.
Trend Giver: es para cada clase de comerciantes, y se puede utilizar para el comercio de divisas, opciones binarias, y Cryptocurrencies. Ya se trate de divisas, materias primas, acciones o criptomonedas.
No repinta y viene con todo tipo de Alertas.
Trend Giver : Puede ser ejecutado en todo tipo de instrumento {Forex, Commodity, Stock, o

El indicador Median Cross es una herramienta potente para Forex y otros mercados financieros. A diferencia de las medias móviles tradicionales, dibuja dos líneas medianas y genera flechas y alertas cuando se cruzan, ayudando a los traders a detectar cambios de tendencia y puntos de entrada más rápido y con mayor fiabilidad. El precio mediano representa el valor central del rango, siendo menos sensible a picos, valores extremos o ruido que una media móvil. Esto proporciona señales más suaves y un
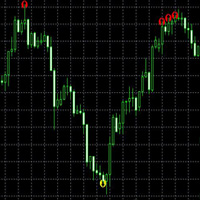
El indicador de máximos y mínimos encuentra zonas de soporte y resistencia basándose en la actividad de tendencias pasadas. Utiliza un algoritmo para comparar saltos en los periodos de máximos más altos y mínimos más bajos. Compara el período actual con el anterior para ver si hay un salto significativo en los períodos en los que ha sido el máximo más alto o el mínimo más bajo. Por ejemplo, si el periodo actual ha sido el máximo más alto durante 100 días, mientras que el periodo anterior fue el
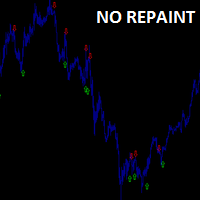
Indicador de flecha de tendencia multitiempo. No redibuja las señales después del cierre de la vela.
Ventajas
El indicador nunca redibuja, recalcula o completa las señales. Funciona en todos los símbolos y marcos temporales.
Trading Salga de una operación de compra cuando aparezca una nueva señal de venta. Salga de una operación de venta cuando aparezca una nueva señal de compra.

Indicador simple - muestra los posibles puntos de entrada en forma de cambios en el color de las líneas del color correspondiente. Se espera que la entrada a la siguiente barra después de los cambios de color, pero puede haber recomendaciones individuales. Pero no hay que olvidar que el enfoque debe ser integral, las señales del indicador requieren información adicional para entrar en el mercado. Prácticamente no llega tarde, se comporta correctamente en los periodos de especulación.
Este es u
PRECIO ESPECIAL Grandes ofertas en todos los productos. Grandes oportunidades. Indicador Sistema BB Es un indicador basado en las Bandas de Bollinger y la intersección de señales derivadas de tres WPR. Las Bandas de Bollinger es uno de los mejores indicadores que junto con tres WPR entrecruzados, proporciona señales válidas de alto porcentaje. Para nosotros los traders apasionados de las bandas de bollinger, que conocemos su validez, este indicador es sin duda adecuado. Si os interesa pronto po
MetaTrader Market ofrece a todos los desarrollador de programas de trading una sencilla y cómoda plataforma para ponerlos a la venta.
Le ayudaremos con la presentación y explicaremos cómo preparar la descripción de su producto para el Market. Todos los programas que se venden a través del Market están protegidos por una codificación adicional y pueden ser iniciados sólo en el ordenador del comprador. La copia ilegal es imposible.
Está perdiendo oportunidades comerciales:
- Aplicaciones de trading gratuitas
- 8 000+ señales para copiar
- Noticias económicas para analizar los mercados financieros
Registro
Entrada
Si no tiene cuenta de usuario, regístrese
Para iniciar sesión y usar el sitio web MQL5.com es necesario permitir el uso de Сookies.
Por favor, active este ajuste en su navegador, de lo contrario, no podrá iniciar sesión.