Indicadores técnicos para MetaTrader 4 - 80

Auto redibujado Pivot líneas horizontales de soporte resistencia con señal de posibilidades de Compra/Venta con nivel SL y también con líneas de resistencia de soporte de tendencia se utiliza para todos los símbolos y marcos de tiempo puede ajustar los parámetros de entrada (sólo 2) y probarlo en varios símbolos y marcos de tiempo introduzca el número de barras para el cálculo y la media móvil para la precisión de la señal ejemplo: utilícelo en el marco de tiempo M30 con la entrada 200 para el r

Indicador inteligente y simple basado en el patrón de inversión de ondas de lobos también cerca de la caída y el aumento de la cuña y los patrones de mariposa con Stoploss y señal de entrada marco de tiempo preferido M30 : con los parametros conteo de barras utilizado para el calculo = 200 y media movil para la precision = 100; puede probarlo para otros parámetros más altos o más bajos y probar su propio conjunto de entradas marco de tiempo más alto = entrada más baja !!! nota importante ::: El

El indicador técnico Smart Awesome Volume está diseñado para medir el impulso del mercado combinando datos de volumen de velas y filtrándolos con un promedio para proporcionar señales precisas. Se centra en el concepto de "el volumen confirma el precio", lo que permite a los operadores identificar fácilmente el impulso del mercado y la batalla entre compradores y vendedores dentro de cada vela. Con su rápido sistema de alerta, los comerciantes pueden estar al tanto de los eventos comerciales

Este indicador proporciona señales de compra/venta basadas en cálculos sobre el marco superior (tendencia) y el marco inferior (señales de entrada). * Usted debe seleccionar el marco superior e inferior para los cálculos del indicador. * Puede seleccionar los colores de la línea de tendencia como prefiera. * Active o desactive las alertas. Las líneas de tendencia ARRIBA/ABAJO se dibujan cuando se detecta una tendencia Espere a que las flechas pequeñas para la entrada : *Normalmente una flecha ha

Trend Sniper Super Indicador es uno de los mejores indicadores que le puede proporcionar señales perfectas para corto plazo y largo plazo las operaciones. Este indicador es adecuado tanto para scalping y swing trading estrategias. El indicador es más 85% de precisión. Utiliza alertas de mensajes de terminal, correos electrónicos y notificaciones Push a su dispositivo móvil para informarle sobre las nuevas oportunidades de comercio y se calculará la toma de beneficios y stop loss nivel para usted
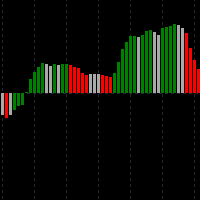
Hybrid MacdAO es un indicador basado en dos indicadores populares: MACD + AO. Ha absorbido sus mejores cualidades, pero al mismo tiempo carece de desventajas. Está destinado a la negociación manual de tendencias. Muestra perfectamente el fortalecimiento y la desaceleración del movimiento del precio actual. También será un buen asistente para los que operan con divergencias (muestra el punto correcto de entrada en una posición con bastante precisión cambiando el color del histograma). Hay un sist

¡El indicador universal Diamond Grail que recibió tal nombre no es tan simple!
¡El indicador ha sido probado durante más de un año por nuestros expertos!
Uno de los mejores indicadores de flecha que es perfecto para las opciones binarias y el comercio de divisas,
Si el comercio de opciones binarias, el mejor ragtime para ello es de 3 minutos a un máximo de 5 minutos
Una flecha aparece en la vela anterior.
Si opera en forex, entonces el tiempo de apertura de vela a vela
Forex resultado ¡De
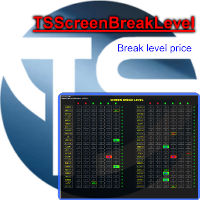
Indicador que dibuja los soportes y resistencias que se han roto. Algoritmo inteligente para scalpers y traders intradía. Panel con múltiples marcos temporales y divisas. Las ventajas que obtiene Nunca rediseña, no retrocede, nunca recalcula. Funciona en forex y CFD, marco de tiempo de M5 a diario. Alertas emergentes, push y sonoras integradas. Fácil de usar. Parámetros input int Número_Instrumento = 10; Número de cruces presentes en su panel SENSIBILITY = 1; indica la importancia de los niveles

Este indicador es un indicador profesional para el comercio Forex. Muestra los puntos para entrar en el mercado, los puntos de inversión potencial del mercado. Utiliza un parámetro para la configuración. Listo sistema de comercio. El indicador combina varios algoritmos progresivos. Los sistemas combinados para analizar los datos históricos se proyectan en líneas en forma de líneas rectas que conectan los extremos. Ese es el punto de pivote del mercado. ¡Estos extremos o puntos de giro del mercad
Introducción
Este es un indicador de tipo mapa de calor basado en el volumen. El indicador no se repinta . Ofrece una visión colectiva de las actividades de compra y venta de volumen a corto, medio y largo plazo (desde la parte inferior hasta la parte superior del mapa). Este indicador debería ser muy beneficioso para todos aquellos que creen en el poder de los volúmenes. Como es habitual para cualquier indicador basado en el volumen, se recomienda un corredor ECN. el indicador puede ser útil
RSI Crossover Alert es un poderoso sistema de notificación diseñado específicamente para operadores que utilizan el índice de fuerza relativa (RSI) en sus estrategias comerciales. Este indicador se enfoca en identificar cruces de RSI, que ocurren cuando la línea RSI rápida cruza por encima o por debajo de la línea RSI lenta. Al combinar estos cruces, el indicador filtra efectivamente las señales falsas, lo que permite a los operadores tomar decisiones comerciales más precisas. El RSI Cros

Swing Trading Forex es un nuevo indicador que muestra al operador los movimientos impulsivos del precio, así como el uso de la flecha predice el movimiento futuro a corto plazo. El uso de este indicador, usted puede operar utilizando el sistema de scalping, donde los comerciantes tratan de obtener un beneficio por períodos cortos de tiempo. Para obtener buenos resultados comerciales, es necesario poner el indicador Swing Trading Forex en el gráfico de cualquier par de divisas y añadir cualquier
La divergencia es una de las señales clave que indica una posible reversión del precio en el mercado. KT Stoch Divergence muestra las divergencias regulares y ocultas que se forman entre el precio y el oscilador estocástico.
Limitaciones de KT Stoch Divergence
Usar divergencias estocásticas como única señal de entrada puede ser arriesgado. No todas las divergencias indican una reversión fuerte. Para obtener mejores resultados, es recomendable combinarlas con acción del precio y dirección de la
Marte 14 es un indicador de ruptura es un poderoso indicador de comercio Patrón para cualquier par y cualquier marco de tiempo. El indicador da señales claras sobre la apertura y cierre de operaciones. Este indicador es una herramienta única, de alta calidad y asequible. Puede ser utilizado en combinación con otros indicadores. Perfecto para nuevos operadores y operadores expertos Entradas de bajo riesgo. Nunca repinta la señal. Nunca repinta la señal. Nunca recalcula la señal. Sólo para MT4 Id

Trend Actual Indicador de la dirección de la tendencia actual. La dirección está determinada por la posición de la línea indicadora en relación con el nivel cero, si la línea está por encima del nivel cero, la dirección de la tendencia es hacia arriba y se asumen compras, si la línea del indicador está por debajo del nivel cero, la dirección de la tendencia es a la baja y se asumen ventas. Cuando la línea del indicador cruza el nivel cero, la tendencia cambia a la opuesta. Descripción de la co
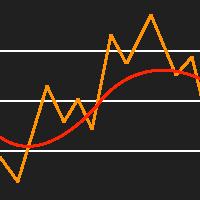
Este indicador coloca una media móvil del tipo especificado sobre el indicador RSI estándar. Se trata de una herramienta extremadamente útil para detectar puntos de inversión y divergencias del RSI. Este indicador proporciona topes, lo que le permite utilizarlo en su asesor experto. Me gusta hacer que el período de RSI sea el mismo que el período de la media móvil, pero depende de usted configurarlo como quiera.
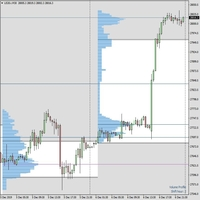
Hola queridos comerciantes. He estado operando desde hace 10 años y, en mi opinión, el perfil del mercado es el camino para el comercio exitoso a largo plazo sin dolor de cabeza. Este es el sistema que más se parece a la forma en que las grandes instituciones comercian a largo plazo. Lo uso ampliamente para crear posiciones acumulativas para índices como S&P, NASDAQ, DAX, etc. Pero también es muy bueno para las especialidades y materias primas de FOREX. El perfil del mercado fue presentado por p
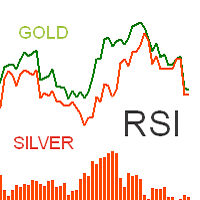
El indicador muestra dos RSI líneas de Símbolos diferentes y un histograma del módulo de diferencia entre ellos. Los nombres de los Símbolos puede Usted asignar en la configuración: First Symbol Second Symbol Para la línea RSI del segundo Símbolo el indicador capacita hacer el reflejo. El reflejo de la línea RSI del segundo Símbolo lo necesitamos para controlar la divergencia de las líneas RSI para los Símbolos con correlación inversa. Por ejemplo, cuando esta comparando Usted los datos de RSI d

Un indicador de tendencia, y no la primera vista, es un indicador regular, pero se puede utilizar con un coeficiente de riesgo óptimo. El principio de trabajo es simple - el indicador muestra los momentos para entrar en el mercado con flechas, que es muy fácil de percibir visualmente.
Se recomienda utilizar un oscilador con un indicador adicional, por ejemplo, RSI estándar. Debe responder al nivel 50. O utilizar algún otro sistema de confirmación.
El indicador se puede utilizar tanto para la
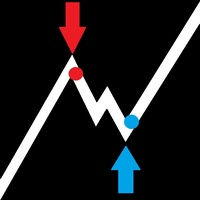
EnE EntryDotPro es un desarrollo único para los traders que no tienen confianza en sus operaciones y no encuentran una estrategia que funcione. El indicador es adecuado para todos los instrumentos y para todos los marcos de tiempo. El indicador funciona en todas las situaciones de mercado en tendencia y plano. Además, el indicador es muy simple en la configuración y en el uso para no distraer a los operadores de la negociación. El indicador muestra la señal en el lugar donde aparece el punto, t

Candle Inside indicator - dibuja velas japonesas de un marco temporal superior en el gráfico. Ahora, después de cargar el indicador, es posible ver lo que está sucediendo dentro de cada vela. Además de los botones estándar para seleccionar el marco de tiempo en el terminal MT-4, se añaden botones adicionales, cuando se hace clic, se selecciona un período más antiguo para mostrar velas japonesas o zonas. Por ejemplo, si selecciona el periodo estándar M1 y el periodo del indicador M5, entonces el

Niveles Mercado es una de las herramientas más simples, pero no menos eficaces de este. A partir de estos niveles se pueden construir puntos pivote, los niveles se construyen como significación estadística en un momento dado. Operar por niveles es un clásico en el trabajo de un trader. Puede utilizarlos como una estrategia de trading ya hecha o como un filtro adicional en su sistema de trading. En los ajustes puede especificar el desplazamiento para la construcción de niveles.
Interpretación d
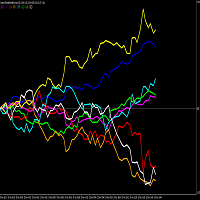
TENGA EN CUENTA QUE COMO MUCHOS INDICADORES DE ESTE TIPO EN ESTE MERCADO, ESTE INDICADOR NO FUNCIONARÁ COMO UNA DESCARGA DE DEMOSTRACIÓN PARA PROBADOR DE ESTRATEGIAS. Por lo tanto, la opción de 1 mes al menor coste permitido de 10$ está disponible para que lo pruebe. Una de las mejores maneras de operar es analizar divisas individuales en lugar de pares de divisas. Esto es imposible con los indicadores gráficos estándar en MT4. Este medidor de fuerza de divisas permite operar con la divisa más
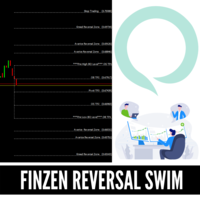
NIVELES DE INVERSIÓN FINZEN Más que un indicador regular es un sistema completo con los niveles de entrada, Stoploss, y TakeProfits niveles. Este indicador del sistema se basa en nuestra estrategia privada que ha estado utilizando durante un tiempo con nuestros fondos privados, este indicador se puede utilizar en acciones, FOREX CFD, pero sobre todo el uso con resultados sorprendentes en los mercados FOREX.
Este indicador detectará en algunos niveles específicos cuando la inversión del mercado
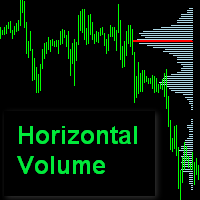
El indicador Horizontal Volume Profile muestra la distribución del volumen para un intervalo determinado. La longitud de las líneas es proporcional al volumen negociado por este precio. Parámetros de entrada : Intervalo= 0-el indicador se recalcula diariamente a las 00: 00, Intervalo= 1..5 - el indicador se recalcula en un día determinado de la semana (Lun..Vie.) Count Of Days= 1..30 - días de análisis. PipStep= 10 - paso de rango de análisis. Cuanto mayor sea, más rápido y más grueso será el re
El indicador de triple oscilador "ThreeAngleR " es un indicador común para tres calculadoras de la desviación angular del gráfico de precios de un instrumento de negociación.
PARÁMETRO DE ENTRADA: Input1= "AnglerSPeriod "; - DRAWs1=128 - Número de barras para mostrar el indicador en el historial del gráfico; - PeriodIND=14 - periodo de cálculo del indicador en número de barras; Input2= "JAngleR "; - DRAWs2=128 - Número de barras para mostrar el indicador en el historial del gráfico; - Period_I
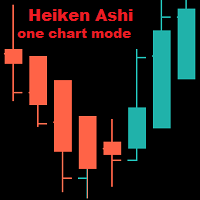
Heiken Ashi En Un Modo De Gráfico MT4 El indicador se muestra sólo en uno de los modos de gráfico: Barras, Velas, Línea. Por defecto es Barras. Al cambiar el modo de gráfico, el indicador se muestra o desaparece dependiendo del modo de gráfico. Parámetros de entrada: iChartMode: en qué modo de gráfico debe mostrarse el indicador. mBars mCandles mLine Colores: LightSeaGreen: vela alcista Tomato: vela oso

Tendencia Nuevo indicador de tendencia, muestra las señales de entrada. Muestra tanto los puntos de entrada como la propia tendencia. Muestra con flechas los momentos calculados estadísticamente para entrar en el mercado. Al utilizar el indicador, es posible distribuir de forma óptima el factor de riesgo.
Ajustes :
Utiliza un único parámetro para los ajustes. Seleccionando un parámetro, es necesario asemejarlo visualmente para que el gráfico apropiado tenga una proyección de extremos.
Opcion

El indicador muestra la dirección de la tendencia, señalándola mediante puntos pivote. Puede utilizarse con una relación de riesgo óptima. Las flechas indican momentos y direcciones favorables para entrar en el mercado. Utiliza un parámetro para ajustar (ajuste de 1 a 3). Funciona en todos los pares de divisas y en todos los marcos temporales.
El indicador se puede utilizar tanto para piping para periodos pequeños como para trading a largo plazo. Funciona en todos los pares de divisas y en tod
ZoneFinder es un panel de indicadores que presenta una visualización interactiva y multitemporal de la dirección y la fuerza de la tendencia. La fuerza y la dirección de la tendencia se miden mediante un indicador ADX modificado basado en valores DI+ y DI- suavizados. Las zonas de alta probabilidad de negociación se identifican mediante retrocesos de Fibonacci. Cuando se encuentran estas zonas, se marcan en el gráfico junto con un objetivo de extensión de Fibonacci propuesto.

Los gráficos Renko con filtro Heiken Ashi ahora tienen las alertas y el Win-rate . Ahora puedes saber qué señal te dará esa ventaja que tu trading necesita. Ajustes de Riesgo a Recompensa Conteo de Ganancias versus Pérdidas Hay cuatro tipos de alertas a elegir para notificación en pantalla, correo electrónico o notificación telefónica. Los tipos de alerta también tienen topes para su uso con la automatización. Este indicador puede ser incorporado con cualquier sistema que requiera gráficos renko
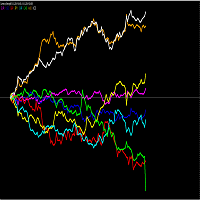
TENGA EN CUENTA QUE COMO MUCHOS INDICADORES DE ESTE TIPO EN ESTE MERCADO, ESTE INDICADOR NO FUNCIONARÁ COMO UNA DESCARGA DE DEMOSTRACIÓN PARA PROBADOR DE ESTRATEGIAS. Por lo tanto, la opción de 1 mes al menor coste permitido de 10$ está disponible para que lo pruebe. Una de las mejores maneras de operar es analizar divisas individuales en lugar de pares de divisas. Esto es imposible con los indicadores gráficos estándar en MT4. Este medidor de fuerza de divisas permite operar con la divisa más

La Línea Inversa señala un cambio en el ángulo de la media móvil, el parámetro LevelZero establece el círculo del punto cero, hay límites desde -LevelZero hasta LevelZero incluyendo los que se considerará un punto cero, esto se puede indicar en rojo en los histogramas. Opciones: NivelCero - punto cero [-NivelCero, NivelCero]; Longitud - longitud de la media móvil; Start - punto inicial para calcular el ángulo; End - punto final del cálculo del ángulo; MetodMA - método de cálculo de la media; Ap
Puede operar con cualquier activo subyacente, pero los especialistas en pruebas prefieren el par de divisas USD / JPY, EUR / USD. El momento más favorable para el trabajo se considera la sesión europea, americana. de operaciones correctas Cuando aparece la flecha azul debajo de la vela, se adquiere la opción ARRIBA. Cuando aparece la flecha roja, se adquiere la opción ABAJO. Cabe señalar una peculiaridad del indicador: se forma una señal cuando se abre una vela, la apertura de una operación vale

Con el indicador Market View , puede supervisar en un panel específico tantos productos como desee. Sólo tiene que añadir el indicador al gráfico, introducir los productos que desea ver y el período de cambio a seguir y eso es todo. Se abrirá un panel en la parte inferior del gráfico que le mostrará por producto el cambio en pips, la desviación estándar, la rentabilidad, etc. Personalmente, lo uso para seguir múltiples productos con los que tengo posiciones sin tener múltiples gráficos abiertos,
El indicador ZigZag se basa en el indicador RSI. Esto permite identificar extremos significativos.
Se proporcionan diferentes opciones de cálculo:
- Indicador RSI en precios Close o Hi-Low (1 y 2 buffers respectivamente en modo OnClose - el primer buffer, en modo Hi-Low el primer buffer en precio High, el segundo buffer en Low);
- Indicador ZigZag por periodo (estándar) o desviación mínima. (Los valores del indicador ZigZag siempre están en buffer cero).
Si utiliza un marco de tiempo superi
Este indicador calcula el Chaikin Money Flow (CMF), que es muy útil para identificar la tendencia de los precios. El indicador proporciona alertas cuando los niveles superiores o inferiores (especificados por el usuario) son cruzados por CMF. Puede decidir recibir una alerta estándar en MT4 y/o una notificación push en su aplicación Metatrader. Puede configurar el indicador especificando también: - Periodos CMF - Niveles en los que se proporciona la alerta
Enlace al canal de Telegram para la c

ForexGumpOopster - este indicador fue desarrollado para determinar la dirección de la tendencia y los puntos de pivote del precio en los marcos de tiempo H1, H4, D1. La configuración predeterminada es para el par de divisas GBPUSD. Para el par de divisas EURUSD, el marco de tiempo H1, H4, D1 se recomienda en la configuración del indicador para cambiar el parámetro "suave = 5". Este indicador es muy adecuado para los comerciantes que operan en el sistema de scalping. Las flechas en la pantalla i
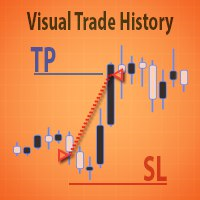
Historial Visual de Operaciones El gráfico muestra los niveles de SL, TP, puntos de entrada y salida del mercado.
Características :
Es posible mostrar sólo las órdenes con un beneficio superior a un número determinado. Existe la posibilidad de mostrar sólo las órdenes ejecutadas o no ejecutadas, o todas. Para mayor comodidad, el análisis para cada tipo de orden, puede configurar su propio color.

Indicador de Onda de Elliott
Perfecto para el comercio de acciones, futuros, divisas y Crypto El Indicador de Onda de Elliott está diseñado en torno a una simple pero eficaz estrategia de Swing Trading. El conjunto de indicadores es ideal para el comercio de acciones, futuros y divisas en múltiples marcos de tiempo.
Al suscribirse a este indicador, obtendrá: Recuento automático de ondas de Elliott Aislamiento de ondas de Elliott Zonas de retroceso de alta probabilidad Oscilador especial 5-35
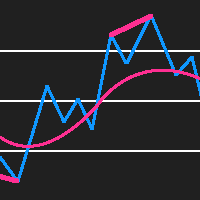
RSI Divergence Detector es un indicador RSI que también detecta divergencias y traza flechas y líneas de tendencia en el gráfico donde debe comprar y vender. Tenga en cuenta que este indicador proporciona 5 buffers y no repinta por lo que es un indicador excepcional para los Asesores Expertos. El indicador también proporciona alertas. Buffer 0 = RSI Buffer 1 = Compra Buffer 2 = Venta Buffer 3 = RSIGradient Buffer 4 = PrecioGradiente
NO REPITIENDO
DETECCIÓN DE DIVERGENCIAS

La Estrategia BeST_123 se basa claramente en el Patrón 123, que es un Patrón Gráfico de Reversión frecuente con un Ratio de Éxito muy alto , que se produce al final de las tendencias y oscilaciones y es una indicación seria de una alta probabilidad de cambio de tendencia. Teóricamente, un patrón 123 es válido cuando el precio cierra por encima del nivel del #2 local superior/inferior, momento en el que el indicador dibuja una Flecha de Entrada, emite una Alerta y se puede abrir la Posición corr

Breakeven calcualtor es un indicador de Metatrader 4 que calcula y muestra el valor de equilibrio para el P&L abierto. El valor se actualiza dinámicamente en función de los movimientos y cambios del mercado. Si el P&L global es negativo, el punto de equilibrio se mostrará como un valor rojo, de lo contrario verde. Además del punto de equilibrio, también se muestran los siguientes valores: Suma de puntos Cambio de pérdidas y ganancias por minuto Variación de puntos por minuto Total P&L Total de s

El indicador de tendencia periódico calcula y muestra los cambios en: Tendencia Pips Desviación estándar Rendimiento (%) en los siguientes periodos - M1, M5, M15, M30, H1, H4, W1, MN1, MN3, MN6, Y1 y Year to Date. Por defecto, se utiliza el producto actual, pero puede cualquier producto cuando se adjunta el indicador al gráfico.
He utilizado ampliamente para supervisar los cambios de producto a través de múltiples gráficos sin tener la necesidad de abrirlos en paralelo. 2019 Roy Meshulam

Future Price Markets es un indicador que a traves del analisis dinamico del precio y el tiempo, proyecta a futuro los precios de toma de beneficios. Para mostrar las proyecciones a futuro del precio utiliza determinadas lineas horizontales, de distinto color y estilo, sea para señal indicar señal de compra o señal de venta o señal futura de toma de beneficios de compra o venta.
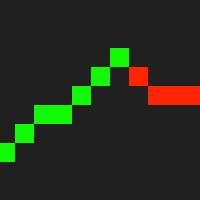
Overlay Renko es un indicador que traza ladrillos Renko encima del gráfico. Puede seleccionar el tamaño del ladrillo, así como si desea o no utilizar el precio de cierre o el precio alto/bajo de las velas. Típicamente los ladrillos Renko se basan sólo en el precio, no en el tiempo, sin embargo, a diferencia de los ladrillos Renko normales, la única diferencia es que este indicador le permite ver la acción del precio dentro de cada ladrillo mediante la superposición de los ladrillos en la parte s

Líneas de tendencia móviles simples con niveles móviles de soporte y resistencia se utilizan en cualquier marco temporal y con cualquier símbolo entrada: # de barras para las líneas de tendencia (10-20- 50-100-200----) según su marco de tiempo y su estrategia y periodo de movimiento ( 10-20 -50-100-200----) según su marco temporal y su estrategia Flechas de dirección : ARRIBA y ABAJO se dibujan cuando se rompen las líneas de tendencia Alertas disponibles en Arrows appearance...
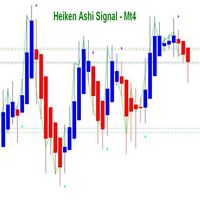
El indicador Heiken Ashi Signal está diseñado para el terminal de trading MT4. Se basa en el indicador estándar Heiken Ashi, que está disponible en el terminal Mt4. El indicador puede ser utilizado como manual, así como en autotrading por los Asesores Expertos del autor. Para utilizar el indicador Heiken Ashi Signal en los EAs de trading, existen topes de señal para la entrada en el mercado y la apertura de posiciones de compra y venta.
Lea más al respecto a continuación.
Funciones y caracter

Todo operador sabe que nunca debe arriesgar más del 2% (o 5%) por operación. Esta es una ley de Money Management y un LotSize utilizable debe ser calculado cada vez porque un trader debe usar un valor diferente de StopLoss para diferentes niveles de Soporte y Resistencia. Este indicador calculará un LotSize apropiado para el momento en que lo ponga en el gráfico y cada vez que arrastre la "Línea Stop Loss" en cualquier dirección.
Entradas: Order_Type - Compra o Venta TakeProfitPoints - a cuant
Intraday Signals es un sistema de trading semiautomático, visual y efectivo, que: genera posibles puntos de entrada para abrir operaciones de COMPRA y VENTA; muestra los Take Profit y Stop Loss recomendados; muestra el beneficio actual de la operación abierta; muestra el spread actual. La rentabilidad del indicador se muestra en la captura de pantalla en el ejemplo del par GBPUSD No redibuja y funciona en la barra de apertura. Marcos de tiempo - M1-H1. TimeFrame recomendado-M5-M15. Las señales s

5 señal en 1 Producto TimeFrame Recomendar 1m-5m
Bancos Pro Opción Binaria es Indicador para la opción binaria Puede utilizar Manaul Comercio o Robot en la Plataforma Mt2Trading https://www.mt2trading.com/?ref=104 Time Trading buen trabajo EU US session Recomendar Curency EUR GBP USD cuidado AUD JPY Recomendar Martingala 2-5 Paso
Recomendar establecer beneficio 1%-5%/Día Fijar Freno Evento de Noticias Alta volatilidad recomendar 15-30 min
Tiene Problema Contrato Telegrama @BinaryBanks Correo
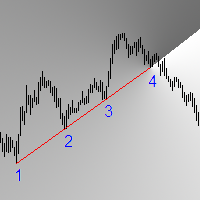
Se trata de un completo sistema de negociación Price Action basado en la búsqueda de puntos de entrada en el momento en que el precio rompe las líneas de tendencia. El indicador encuentra y dibuja las líneas de soporte, resistencia y niveles horizontales. Cuando el precio cruza estas líneas, el indicador da señal de Alerta y envía una notificación Push. Usted también puede dibujar sus propias líneas, y el indicador también trabajará con ellas y dará señal de Alerta y notificaciones Push sobre e
Indicador de tendencia con una señal de confirmación. Se traza un histograma en la parte inferior del gráfico con una intensidad de señal de 1 a 2 para una señal de compra y de -1 a -2 para una señal de venta. El indicador se aplica a todos los períodos del gráfico y a todos los pares de divisas.
En el gráfico principal, se dibujan flechas que indican la entrada en la transacción. El panel de información con al precio de entrada en la transacción precio actual ganancia en puntos información so

El indicador está diseñado para el comercio de opciones binarias en pequeños marcos de tiempo de hasta m 30 Señales La flecha azul hacia arriba es una señal de compra. La flecha roja dn es una señal de venta. La señal aparecerá junto con el advenimiento de una nueva vela y durante la formación Señales en la vela actual Tiempo de expiración una vela del marco temporal en el que está operando Puede utilizar la media móvil para filtrar señales falsas. O niveles de soporte de escolta. Esta herramien

Este indicador está diseñado para escanear todos los pares y símbolos, para todos los marcos de tiempo seleccionados, para encontrar un cruce de medias móviles. La estrategia de las 4 medias móviles
El escáner tiene 4 medias móviles: - 2 medias móviles para definir la tendencia - 2 medias móviles se utilizan para encontrar el momento adecuado para enviar una alerta
Si la MA de tendencia rápida está por encima de la MA de tendencia lenta, entonces se considera un mercado alcista y sólo proporcio

Filtro de tendencia digital de tres niveles. No es necesario configurar el indicador. ¡Sólo tiene que instalar y trabajar! Pre-seleccione el marco de tiempo de trabajo necesario y el instrumento de comercio, visualmente adecuado para el comercio. ¡La señal no se vuelve a dibujar en una vela formada!
No se olvide de revisar mis otros productos - https://www.mql5.com/ru/users/altiveus/seller. Al comprar mis productos, usted apoya el desarrollo de nuevo software. También comprando cualquiera de mis

Ultimate Scalper Pro comprueba Entradas tempranas El algoritmo utilizado se basa en CCI, RSI, MA, ATR.
Este indicador es una tendencia de gran alcance, que muestra el mercado con claridad , NO Ruido , NO repinta . puedes usarlo con tu propia estrategia o indicador, personalmente lo uso con CCI, MFI, mis propias bandas TMA no repaint e indicador CSS , da entrada con el Drawdown más bajo Especialmente cuando se usa con indicadores de sobreventa y sobrecompra e indicador de fuerza de la divisa.

Un oscilador de cruce de dos líneas para la entrada y salida del mercado. Utilícelo en M15 y superiores para una mayor precisión. Coloque el indicador en un segundo gráfico con el mismo par de divisas y amplíelo para obtener una mejor visión. El indicador da una buena idea de la volatilidad, el volumen y la tendencia. Funciona en cualquier par de divisas, pero extremadamente bien en pares de divisas con buena volatilidad PIP diaria como GBPJPY, GBPNZD y pares de divisas exóticas. Utilícelo duran
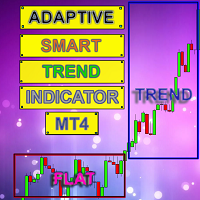
Indicador Inteligente Adaptativo Smart Trend Indicator determina los sectores de la Tendencia y el Plano y también en forma de histograma muestra los puntos de ruptura de los niveles (1 - 5).
El indicador realiza muchos cálculos matemáticos para mostrar movimientos de Tendencia más óptimos en el gráfico.
El programa contiene dos indicadores en uno: 1 - dibuja los sectores Trend y Flat, 2 - el indicador histograma muestra las mejores señales para abrir una orden. El indicador calcula de forma

La subida de Sky walker es un indicador de tendencia es un indicador de gran alcance para cualquier par y cualquier marco de tiempo. No requiere ningún indicador adicional para la configuración de comercio.el indicador da señales claras acerca de la apertura y cierre de operaciones.este indicador es un único, de alta calidad y asequible herramienta de comercio. se puede utilizar en combinación con otros indicadores Perfecto para nuevos operadores y operadores expertos Entradas de bajo riesgo. N

Este indicador busca modelos de mercado tales como: cabeza y hombros, triángulos, dobles máximos y mínimos, banderas, cuñas y tres toques.
Opciones:
barsToProcess - el número inicial de barras a calcular;
ArrowSize - tamaño de la flecha;
AllowablePatternLength - longitud mínima del patrón (en barras);
AllowablePatternPriceDiv - la altura mínima del patrón, aplicable a todos excepto a los patrones 'head and shoulders', 'double top' (para estos últimos hay otro parámetro);
AllowablePriceAberratio

Indicador simple para BUY / Sell Zones zonas de compra y venta en movimiento : La zona más cercana es amplia y clara : Rojo para zona de venta , Verde para zona de compra >>> las zonas lejanas están en negrita :::Zonas de COMPRA (VERDE) aparecen sólo en tendencia alcista y desaparecen en tendencia bajista :::Zonas de VENTA (ROJAS) aparecen sólo en la tendencia BAJA y desaparecen en la tendencia ALTA parámetros de entrada ::: barras índice : rango de barras para el cálculo de zonas niveles : núme
Diverence Dash es un tablero de MACD, RSI, OBV, Momentum, Estocástico o Divergencia de Desviación Estándar. Explorará todos los símbolos y plazos que desee. Además, Divergence Dash puede abrir gráficos con la divergencia encontrada utilizando la plantilla de su elección. Las divergencias se utilizan a menudo como un indicador adelantado y, mediante el uso de Divergence Dash, son fáciles de detectar. La relación riesgo / recompensa en el comercio de divergencia es muy baja. ¿Qué puede Divergence
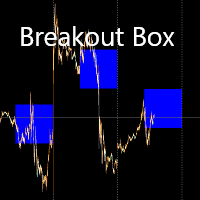
Un cuadro de ruptura que puede establecerse para el inicio de cualquiera de las principales sesiones bursátiles - Hong Kong, Londres, Londres-Nueva York se superponen. Establezca el ancho del cuadro de ruptura en puntos (10 puntos=1 PIP) Utilícelo para medir si el par de divisas en el que está operando está en un canal o no. Opere una vez que el precio rompa la caja. Utilícelo con un indicador de volumen e impulso para obtener mejores resultados. Puede cambiar el color del recuadro para adaptarl

Niveles RES/SUP móviles Crazy Dancing Redibujado automático de los niveles de soportes y resistencias móviles para indicar la ruptura de soportes (señal de VENTA) o ruptura de niveles de resistencia (señal de COMPRA) ¡¡¡¡Indicador de apariencia muy simple pero muy inteligente !!!! Entradas principales: # de barras para los niveles de soporte y resistencia + el desplazamiento inicial desde el inicio + media móvil para el filtro de señalización Valores más pequeños para las entradas de barras / de

versión mql5: https: //www.mql5.com/en/market/product/44815 Sencillo indicador para calcular el beneficio en los niveles de retroceso de fibonacci con tamaño de lote fijo, o calcular el tamaño de lote en los niveles de fibonacci con beneficio fijo. Añadir al gráfico y mover la línea de tendencia para establecer los niveles de retroceso de fibonacci. Funciona de forma similar al estudio de la línea de retroceso de fibonacci por defecto en Metatrader. Entradas Fijo - seleccione que valor será fijo
Una verdadera rareza para los revendedores.
¿Está buscando TFs inferiores a M1?
¿Quieres ver la dinámica del precio dentro de la vela?
Esta es una herramienta para usted.
Visual Ticks es un indicador que muestra el gráfico de ticks en una ventana separada.
Lo hace en tiempo real esperando a que cambien los ticks.
Gracias a Visual Ticks, podemos mirar dentro de la vela tradicional y ver la dinámica del precio en movimiento.
Configurando "period_of_model" podemos dar forma a un gráfico hecho de ve
Esta herramienta ha demostrado su eficacia cuando se ha probado en el mercado Forex en el par de divisas EUR/USD. También probamos esta herramienta para Opciones Binarias y fue capaz de mostrar señales de buena calidad en el cambio de divisas EUR/USD. SEÑALES NO RENDERY MOVER LA FLECHA POR 1 VELA COMO MÁXIMO ESTO ES EXTREMADAMENTE RARO ENCONTRAR
Las señales de este instrumento se forman durante la vela. Vale la pena entrar en el comercio después de cerrar la vela en la que se generó la señal. L
Indicador de diferencial de pares con recuperación de barras perdidas. Este indicador restablecerá automáticamente las barras perdidas en el historial a los precios medios de las barras vecinas. Un gráfico de histograma muestra la diferencia de precios entre los dos instrumentos en una ventana separada. Ideal para instrumentos relacionados, por ejemplo: BRN - WTI, ORO - 50 * Plata, DJ - 14 * S & P500, etc ; Método de cálculo: la diferencia de precios de cierre (apertura / máximo / mínimo) entre

KT Power Pennant detecta y marca el famoso patrón de banderín en el gráfico. Un banderín es un patrón de continuación de tendencia que comienza con un fuerte movimiento de precio en una dirección, seguido por un periodo de consolidación con líneas de tendencia convergentes.
Una vez que se forma el patrón de banderín, se genera una señal de compra o venta tras la ruptura alcista o bajista del patrón.
Características
Los patrones de banderín ofrecen una entrada de bajo riesgo tras una fase de c
¿Sabe usted por qué MetaTrader Market es el mejor lugar para vender estrategias comerciales e indicadores técnicos? Con nosotros, el desarrollador no tiene que perder tiempo y fuerzas en publicidad, protección del programa y ajustes de cuentas con los compradores. Todo eso ya está hecho.
Está perdiendo oportunidades comerciales:
- Aplicaciones de trading gratuitas
- 8 000+ señales para copiar
- Noticias económicas para analizar los mercados financieros
Registro
Entrada
Si no tiene cuenta de usuario, regístrese
Para iniciar sesión y usar el sitio web MQL5.com es necesario permitir el uso de Сookies.
Por favor, active este ajuste en su navegador, de lo contrario, no podrá iniciar sesión.