Indicadores técnicos para MetaTrader 4 - 5

RABBY: El Indicador "Momentum Dislocation" para XAUUSD (También adecuado para Índices como Nas100)
Gold M1 (XAUUSD)
Deje de quedar atrapado por el ruido del M1. Empiece a Operar la Dislocación.
El primer indicador que visualiza el "Desprendimiento del Precio" para entradas de alta precisión.
No necesitas otra flecha. Necesitas ver la Estructura del movimiento.
Si opera con Oro (XAUUSD) en el 1-minuto, conoce la sensación: Un indicador imprime una señal de "Compra". Usted entra. Dos minutos

"Ppr PA" is a unique technical indicator created to identify "PPR" patterns on the currency charts of the MT4 trading platform. These patterns can indicate possible reversals or continuation of the trend, providing traders with valuable signals to enter the market.
Features: Automatic PPR Detection: The indicator automatically identifies and marks PPR patterns with arrows on the chart. Visual Signals: Green and red arrows indicate the optimal points for buying and selling, respectively. Ar
FREE
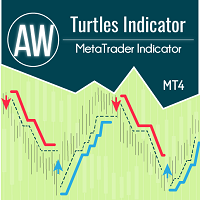
El indicador funciona según el sistema Turtle y clásicamente asume un intervalo de tiempo de 20 y 55 velas. Se monitorea una tendencia durante un intervalo de tiempo determinado. La entrada se realiza en el momento de la ruptura del nivel de soporte o resistencia. La señal de salida es una ruptura del precio en la dirección opuesta a la tendencia del mismo intervalo de tiempo. Ventajas:
Instrumentos: pares de divisas, acciones, materias primas, índices, criptomonedas Plazo: Clásicamente D1, ta
FREE

Antes: $299 Ahora: $99 Oferta Demanda utiliza la acción previa del precio para identificar desequilibrios potenciales entre compradores y vendedores. La clave está en identificar las zonas con mejores probabilidades, no sólo las que no se han tocado. El indicador Blahtech Supply Demand ofrece una funcionalidad que antes no estaba disponible en ninguna plataforma de negociación. Este indicador 4 en 1 no sólo destaca las zonas de mayor probabilidad utilizando un motor de fuerza multicriterio, sino

El Forex Master Pattern es una forma alternativa de análisis técnico que proporciona un marco que le ayudará a encontrar y seguir el patrón de precios oculto que revela las verdaderas intenciones de los mercados financieros. Este algoritmo aquí hace un buen trabajo detectando la Fase 1 del ciclo del Forex Master Pattern, que es el punto de contracción (o Valor).
En la Fase 2 obtenemos una activación del marco temporal superior (también llamada Expansión), que es donde el precio oscila por enci

Este indicador es TAN SIMPLE... cuando la flecha verde Rise Coming aparece, ¡una caída de precios puede estar en camino! ¡Ganancias simples y fáciles! Si recibe más de una señal de texto de "Subida inminente" en una tendencia bajista, significa que el impulso está aumentando para una carrera alcista. CÓMO USARLO 1. Cuando el texto verde "Rise Coming" aparece, ¡un salto de precio puede estar en camino! 2. ¡Este indicador nunca se repite! Para obtener la mejor configuración es cuestión de ajustar
¡COMPRE EL INDICADOR Y OBTENGA UN NUEVO EA EXCLUSIVO GRATIS COMO BONO! INDICADOR FLECHAS ITALO es el mejor indicador de reversión jamás creado, ¿y por qué? El uso de zonas extremas de inversión en el mercado para mostrar las flechas y los números de Fibonacci para la toma de beneficios, también con un panel que muestra toda la información acerca de las señales en el gráfico, el indicador funciona en todos los plazos y los activos, indicador construido después de 8 años de experiencia en forex y
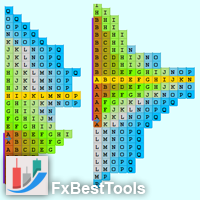
Definición : Un perfil de mercado es una técnica de gráficos intradiarios (precio vertical, tiempo/actividad horizontal). El Perfil de Mercado se entiende mejor como una forma de ver el orden en los mercados. El perfil de mercado era una forma de que los operadores comprendieran mejor lo que estaba ocurriendo, sin tener que estar en el parqué. El indicador actual se ha desarrollado basándose en una arquitectura fácil de usar que incluye una amplia gama de ajustes visuales.
Principales caracter

Detector de Zonas Clave (Key Zone Detector)
Detector de Niveles de Oferta y Demanda (Key Level Supply & Demand Zone Detector) Resumen (Overview)
Un indicador sofisticado de detección de zonas de oferta y demanda que identifica y califica niveles de precios clave donde ocurre actividad significativa en el mercado. El indicador utiliza análisis fractal y múltiples métodos de validación para detectar y clasificar zonas de trading. Características Clave (Key Features) Detección de Zonas (Zone Dete

" La tendencia es tu amiga" es uno de los refranes más conocidos en inversión, porque captar los grandes movimientos tendenciales de los precios puede ser extremadamente rentable. Sin embargo, operar con la tendencia es a menudo más fácil de decir que de hacer, porque muchos indicadores se basan en los retrocesos de los precios, no en las tendencias. No son muy eficaces para identificar los periodos de tendencia ni para predecir si ésta continuará. Hemos desarrollado el Trendiness Index para ayu
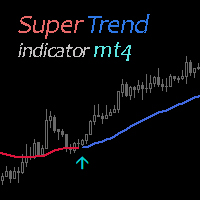
El indicador Super Trend utiliza dos medias móviles para calcular la dirección de la tendencia. La combinación con otras señales y análisis de mercado es necesaria y proporciona resultados más estables. Indicador puede ser fácilmente personalizado por el usuario, incluyendo el cambio de colores, con y tamaños de flecha.
GRATIS Super Trend Expert Advisor > https://www.mql5.com/en/market/product/81160?source=Site+Profile+Seller
FREE
Advanced UT BOT ALERTS for MT4 Sistema profesional de detección de tendencias con múltiples filtros | Motor UT BOT mejorado Solo ofrecemos indicadores de alta calidad. Advanced UT BOT está diseñado para uso profesional, con una lógica de señales estable y un cálculo seguro que evita retrasos o actualizaciones erróneas.
No redibuja, elimina ni modifica las señales pasadas.
Todas las señales BUY y SELL se generan solo después del cierre de la vela , garantizando estabilidad y precisión.
En el trad

Ventajas de este indicador: Esta herramienta está diseñada para el trading de Smart Money Concepts (SMC) , enfocándose en identificar consolidaciones (Rangos/Laterales) y rupturas (Breakouts), junto con un análisis profundo del volumen. Detección Automática de Rangos: Sin dibujar manualmente: El indicador traza canales (Cajas) automáticamente cuando el mercado entra en fase lateral. Zonas Clave: Identifica claramente zonas de Acumulación y Distribución. Desglose de Volumen (Volume Breakdown): An

Indicador Market Structure ICT 1. Estructura de Mercado Automatizada La mayor ventaja es reducir los errores de la interpretación subjetiva. Identificación precisa de tendencias: Identifica automáticamente BOS (Ruptura de Estructura) para la continuación de la tendencia y CHoCH (Cambio de Carácter) para reversiones. Clasificación de Swings: El usuario puede elegir el tipo de estructura (corto, medio o largo plazo), ideal tanto para Scalpers como para Swing Traders. 2. Panel de Control Profesiona

Modificación multidivisa y multitemporal del indicador Commodity Channel Index (CCI). Puede especificar las monedas y plazos que desee en los parámetros. Además, el panel puede enviar notificaciones cuando se cruzan niveles de sobrecompra y sobreventa. Al hacer clic en una celda con un punto, se abrirá este símbolo y punto. Este es el escáner MTF.
La clave para ocultar el panel del gráfico es "D" de forma predeterminada.
Parámetros CCI Period — período promedio. CCI Applied price — tipo de
El indicador Trend Line PRO es una estrategia comercial independiente. Muestra el cambio de tendencia, el punto de entrada a la transacción, así como calcula automáticamente tres niveles de Take Profit y la protección contra la pérdida de Stop Loss Trend Line PRO es perfecto para todos los símbolos de Meta Trader: monedas, metales, criptomonedas, acciones e índices. El indicador se utiliza en el comercio con cuentas reales, lo que confirma la fiabilidad de la estrategia. Los robots que ut
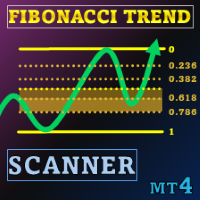
Oferta especial : ALL TOOLS , ¡solo $35 cada uno! New tools will be $30 for the first week or the first 3 purchases ! Trading Tools Channel on MQL5 : Join my MQL5 channel to update the latest news from me En un entorno de trading volátil, una herramienta de análisis potente e intuitiva puede ayudarte a aprovechar las oportunidades rápidamente. Fibonacci Trend Scanner no solo integra las funciones tradicionales del indicador de Fibonacci y SuperTrend, sino que también amplía la func
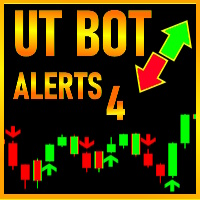
El viejo UT BOT convertido del script TradingView por 'QuantNomad ', inicialmente por 'Yo_adriiiiaan '. y 'HPotter ' - así que usted puede apostar que esta es una herramienta poderosa. Si usted sabe, usted sabe. Esta es la parte superior de la línea, mientras que mantenerlo muy simple.
Función principal: identificación de tendencia con puntos de cambio de tendencia , creados por EMA(fuente) y ATR -La fuente es el PRECIO DE CIERRE con la opción de utilizar el gráfico HEIKEN ASHI en su lugar, pa
FREE

Indicador RSI con líneas de señal, en cuya intersección se emitirá la notificación correspondiente, que puede ser en forma de alerta normal o en forma de archivo de sonido para el usuario.
El indicador también tiene la función de enviar notificaciones push y notificaciones por correo electrónico en la intersección de estos niveles.
Los valores de los niveles pueden fijarse independientemente en los ajustes del indicador y, si se desea, pueden modificarse y configurarse directamente en la vent

El estrategia de trading Moving Average Convergence Divergence (MACD) es una herramienta popular de análisis técnico que se utiliza para identificar cambios en el impulso y la dirección de la tendencia. El MACD se calcula restando la media móvil exponencial (EMA) de 26 períodos de la EMA de 12 períodos. Luego se traza una EMA de 9 períodos, llamada "línea de señal", sobre el MACD para actuar como un disparador de señales de compra y venta. El MACD se considera en territorio alcista cuando la lín
FREE

1. en que el número de herramientas disponibles y la demanda de herramientas por parte de los compradores determinan el precio. Identifica en el gráfico las áreas donde la demanda abruma a la oferta (áreas de demanda), las áreas que impulsan el aumento de los precios o las áreas donde la oferta abruma a la demanda (áreas de oferta), impulsando la caída de los precios. La mayoría de los comerciantes de oferta y demanda esperan que los precios entren en estas áreas donde se ha producido la princi
FREE

Marcamos la brecha de valor justo (FVG) y esperamos a que el precio alcance esa zona, pero a veces se invierte antes de llegar a ella. Esto puede ocurrir porque no nos fijamos en el Rango de Precios Equilibrado (RPE). Mis herramientas mejorarán su análisis mostrando todo en el gráfico, ayudándole a identificar posibles zonas de reversión del precio para que pueda tomar decisiones informadas sobre cuándo entrar en el mercado. MT5 - https://www.mql5.com/en/market/product/119228/ Entonces, ¿qué es

DETECTOR DE CHOQUES DE LIQUIDEZ (EDICIÓN XAUUSD de 1 minuto) ====================================================
BREVE DESCRIPCIÓN: ----------------------------------- Detecta zonas de liquidez institucional creadas por movimientos repentinos de precios y proporciona análisis de tendencias en múltiples marcos temporales.
DESCRIPCIÓN COMPLETA: -----------------
El Detector de Choques de Liquidez identifica movimientos significativos de precios que suelen indicar actividad institucional. Cuan
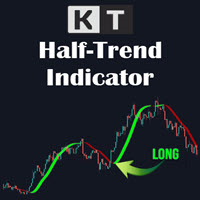
KT HalfTrend es un indicador de tendencia basado en medias móviles que dibuja zonas en el gráfico. Detecta un cambio de tendencia marcando zonas de invalidación alcista y bajista. También muestra la fuerza de compra y venta mediante flechas en el gráfico principal. Cuando no hay una tendencia clara, el indicador se muestra plano, lo cual puede indicar acumulación, distribución o consolidación temporal. Si existe una tendencia, el indicador tendrá una pendiente en esa dirección. Cuanto más inclin

TREND FLOW PRO TREND FLOW PRO es un indicador sin repintado que muestra la dirección del mercado. Identifica cambios de tendencia, así como las entradas iniciales y repetidas de los principales participantes del mercado. Las marcas BOS en el gráfico representan cambios reales de tendencia y niveles clave de marcos temporales superiores. Los datos no se repintan y permanecen en el gráfico después del cierre de cada vela. Solicita y recibe una guía en PDF detallada con ejemplos de estrategias a tr
RSI Multicurrency Scanner Dashboard MT4 es una herramienta de trading poderosa diseñada para monitorear múltiples pares de divisas y marcos temporales utilizando el Índice de Fuerza Relativa (RSI). Organiza las señales en un formato de cuadrícula, mostrando el estado de cada símbolo en marcos temporales desde M1 hasta MN1. Los traders pueden habilitar o deshabilitar marcos temporales específicos para adaptarse a sus estrategias, garantizando un análisis de mercado preciso y eficiente. La herram
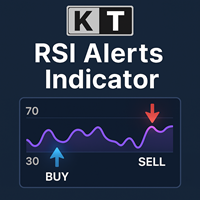
KT RSI Alerts es una implementación personalizada del oscilador RSI (Índice de Fuerza Relativa) que proporciona señales y alertas en base a cuatro eventos personalizados: Cuando el RSI entra en una zona de sobrecompra. Cuando el RSI sale de una zona de sobrecompra. Cuando el RSI entra en una zona de sobreventa. Cuando el RSI sale de una zona de sobreventa.
Características Una opción ideal para los traders que analizan el comportamiento del RSI dentro de zonas de sobrecompra y sobreventa. Indica
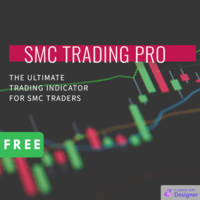
Bienvenido al mundo de SMC (Smart Money Concepts) Trading, donde dotamos a los operadores de las herramientas y conocimientos necesarios para tomar decisiones de trading más inteligentes. Nuestra última incorporación a nuestro conjunto de herramientas de trading es el indicador SMC Trading Pro, versión 1.0. Características principales: Identificación de Estructura de Mercado Mayor con ruptura de BODY. El Bloque de Orden debe estar en Swing Mayor ( no Swing Menor ). Bloque de Orden con Detección
FREE

Wave Reversal Indicator - determina la dirección y las inversiones de precio alrededor de la línea de equilibrio.
El indicador muestra movimientos ondulatorios y aumentos repentinos de tendencias. Da recomendaciones sobre dónde seguir al comerciante y le ayuda a seguir la estrategia comercial.
Es una adición a una estrategia intradiaria o de mediano plazo.
Casi todos los parámetros se seleccionan para cada período de tiempo y cambian automáticamente; el único parámetro para el ajuste manual es
FREE

Póngase en contacto conmigo después del pago para enviarle el archivo PDF del manual del usuario.
Patrón Triangular
A veces el precio no puede hacer máximos más altos o mínimos más bajos y se mueve en un rango de precios convergentes y las ondas son más cortas que antes hasta que el movimiento crea una forma geométrica de un triángulo simétrico, lo que indica que es tal vez el final de la tendencia. El patrón de triángulo es muy conocido en forex y el plan de trading y la estrategia de muchos

Este indicador dibuja automáticamente los Canales de Tendencia por usted una vez que lo ha colocado en un gráfico. Reduce la molestia de dibujar y volver a dibujar estos niveles cada vez que se analizan los precios en un gráfico. Con él, todo lo que tiene que hacer es soltarlo en un gráfico, ajustar la configuración a su gusto y dejar que el indicador haga el resto. Obtenga una versión alternativa de este indicador aquí: https: //youtu.be/lt7Wn_bfjPE Para más material gratuito visite: https: //a
FREE

Introducción a Fractal Pattern Scanner El indicador fractal se refiere al indicador técnico que hace uso de la geometría fractal que se encuentra en el mercado financiero. Fractal Pattern Scanner es un indicador fractal avanzado que incorpora la última tecnología de negociación tras un exhaustivo trabajo de investigación y desarrollo de la geometría fractal en el mercado financiero. La característica más importante de Fractal Pattern Scanner es la capacidad de medir la probabilidad de punto de

SMC Larry Williams Structure es un indicador para analizar estructuras de gráficos de precios que construye y conecta los puntos de oscilación más importantes utilizando el método del famoso trader Larry Williams de su bestseller “Long-Term Secrets of Short-Term Trading”, creando una base sólida para adaptar la estructura del mercado y analizar las áreas de interés de los grandes participantes utilizando el concepto Smart Money. La base para construir las oscilaciones es una lógica simple y clar

Pips Chaser es un indicador que ha sido desarrollado para complementar su trading manual. Este indicador puede utilizarse tanto para el scalping como para el swing trading // Versión MT5
Características No repinta
Este indicador no cambia sus valores cuando llegan nuevos datos Pares de negociación
Cualquier par de divisas Periodo de tiempo
Es preferible H1, pero se puede adaptar a cualquier marco temporal Tiempo de negociación
Las 24 horas del día Buffers Buy Buffer: 0 / Sell Buffer: 1
FREE

El indicador identifica automáticamente el patrón 1-2-3 en el gráfico. El indicador es capaz de supervisar la formación del patrón en tiempo real. Informa al operador cuando el patrón está completamente formado (cuando el precio rompe la línea en el punto 2) y muestra los patrones completados en el historial. Los patrones nunca se vuelven a dibujar. El indicador puede identificar patrones en cualquier instrumento (pares de divisas, bolsa, oro, etc.) sin necesidad de ajustarse a cada instrumento.
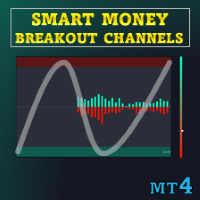
Oferta especial : ALL TOOLS , ¡solo $35 cada uno! Nuevas herramientas costarán $30 durante la primera semana o para las primeras 3 compras ! Canal de Trading Tools en MQL5 : únete a mi canal de MQL5 para recibir mis últimas novedades Este indicador traza zonas de detección de ruptura, denominadas “Smart Breakout Channels”, basadas en el movimiento de precios normalizado por volatilidad. Estas zonas se muestran como cajas dinámicas con superposiciones de volumen. La herramienta dete

El indicador de divergencia RSI encuentra divergencias entre el gráfico de precios y el indicador RSI y le informa con alertas (popup, notificación móvil o correo electrónico). Su uso principal es encontrar cambios de tendencia en el gráfico. Utilice siempre los indicadores de divergencia con otros activos técnicos como zonas de resistencia de soporte, patrones de velas y la acción del precio para tener una mayor posibilidad de encontrar cambios de tendencia. Tres tipos de confirmación para las
FREE

Trend Trading es un indicador diseñado para sacar el máximo provecho posible de las tendencias que tienen lugar en el mercado, mediante el cronometraje de retrocesos y rupturas. Encuentra oportunidades comerciales al analizar qué está haciendo el precio durante las tendencias establecidas. [ Guía de instalación | Guía de actualización | Solución de problemas | FAQ | Todos los productos ]
Opere en los mercados financieros con confianza y eficiencia Aproveche las tendencias establecidas sin ser

El algoritmo encuentra zonas de baja volatilidad basadas en el indicador UPD1 Trend Direction y construye el volumen horizontal máximo basado en el indicador UPD1 Volume Box . Como regla general, un fuerte movimiento de tendencia se produce al salir de la acumulación. Si el precio ha dejado la acumulación, entonces puede probar su volumen horizontal máximo (POC). Alertas inteligentes están disponibles en la configuración.
Parámetros de entrada
Ajustes básicos Bars Count – número de barras de
FREE
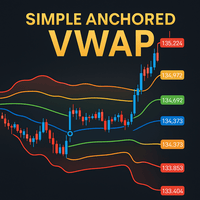
Simple Anchored VWAP es una herramienta ligera pero potente diseñada para los operadores que desean niveles precisos ponderados por volumen sin complejidad.
Este indicador le permite anclar el VWAP desde cualquier punto del gráfico y ver instantáneamente cómo reacciona el precio alrededor de las zonas de volumen institucionales. Versión MT5 - https://www.mql5.com/en/market/product/155321/
Únase para aprender Profundidad de Mercado - https://www.mql5.com/en/channels/suvashishfx Mediante el uso d
FREE
** Todos los Símbolos x Todos los Plazos escanean con sólo pulsar el botón del escáner **. *** Contáctame para enviarte instrucciones y agregarte en "Market Structure group" para compartir o ver experiencias con otros usuarios. Introducción: La estructura del mercado es importante tanto para los traders nuevos como para los profesionales ya que puede influir en la liquidez y en la acción del precio de un mercado (Breakout y Retest). También es una de las técnicas más utilizadas para comprender t

Oferta especial : ALL TOOLS , ¡solo $35 cada uno! Nuevas herramientas costarán $30 durante la primera semana o las primeras 3 compras ! Trading Tools Channel on MQL5 : únete para recibir las últimas novedades RSI Shift Zone Scanner identifica los momentos en que el sentimiento del mercado puede cambiar, vinculando las señales del RSI con la acción del precio. Siempre que el RSI supera o cae por debajo de los niveles preestablecidos (70 por defecto para sobrecompra, 30 para sobreven
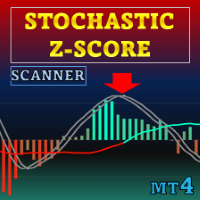
Oferta especial : TODAS LAS HERRAMIENTAS , ¡solo $35 cada una! Nuevas herramientas costarán $30 durante la primera semana o para las primeras 3 compras ! Canal Trading Tools en MQL5 : únete a mi canal de MQL5 para conocer mis últimas novedades Stochastic Z-Score es un oscilador de momento que normaliza el precio mediante un Z-Score, lo acota con lógica estocástica y lo suaviza con HMA, con ALMA como contexto a largo plazo. Los elementos opcionales incluyen histograma, bandas dinámi

Presentamos el indicador Volume Order Blocks , una herramienta revolucionaria diseñada para los operadores que exigen precisión y claridad en sus análisis de mercado. Este avanzado indicador no sólo identifica los bloques de órdenes, sino que también integra datos volumétricos cruciales, lo que le permite calibrar la fuerza de estos bloques con una precisión sin precedentes. Versión MT5 - https://www.mql5.com/en/market/product/121238/ C aracterísticas principales de los Bloques de Órdenes de

O (TDO), que es un índice que mide la tasa de cambio de precios utilizando el principio de " Pure Momentum ".
Cuando el precio de un valor aumenta de 10 a 15, la tasa de cambio del precio es del 150%, pero cuando baja de 15 a 10, la tasa de cambio del precio es solo del 33,3%. Es por eso que los indicadores de análisis técnico como "Tasa de cambio de precio" (ROC) o "Momentum" dan lecturas más altas para los movimientos de precios ascendentes que las dadas para los descendentes. TDO soluciona es

Currency Strength Meter is the easiest way to identify strong and weak currencies. This indicator shows the relative strength of 8 major currencies + Gold: AUD, CAD, CHF, EUR, GBP, JPY, NZD, USD, XAU. Gold symbol can be changed to other symbols like XAG, XAU etc.
By default the strength value is normalised to the range from 0 to 100 for RSI algorithm: The value above 60 means strong currency; The value below 40 means weak currency;
This indicator needs the data of all 28 major currency pairs a

El indicador MACD en MetaTrader 4/5 se diferencia de los semejantes indicadores en otros programas. Eso se debe al hecho de que en la versión MetaTrader 4/5 la línea MACD se muestra en forma del histograma, mientras que habitualmente se muestra en forma de la línea. Además, en la versión MetaTrader 4/5 la línea de señal se construye con el uso de SMA, mientras que por definición tiene que construirse usando EMA. En la versión MetaTrader 4/5 también se diferencia el histograma (la diferencia entr
FREE

** Todos los símbolos x Todos los plazos escanean con sólo pulsar el botón del escáner ** - Descuento : no son 50$, son sólo 39$. *** Contacta conmigo para enviarte instrucciones y añadirte en "Head & Shoulders Scanner group" para compartir o ver experiencias con otros usuarios. Introducción: Head and Shoulders Pattern es un tipo común muy repetitivo de patrones de reversión de precios. El patrón aparece en todos los marcos de tiempo y puede ser utilizado por todo tipo de traders e inversores .

Histograma de Oferta y Demanda Multitemporal
Descripción:
El Histograma de Oferta y Demanda Multitemporal es un indicador potente y limpio que muestra la fuerza de la oferta y demanda del mercado a través de múltiples marcos temporales, específicamente H4 y D1. Muestra histogramas que destacan cuándo los compradores o vendedores dominan, permitiendo a los traders identificar rápidamente las áreas clave de presión del mercado. Características principales: Histogramas H4 y D1: Visualización clar
FREE

Auto Fibo es un indicador desarrollado para mejorar sus operaciones manuales. Dibujará la proporción áurea de forma automática, ahorrando tiempo y facilitando su operativa. Adjunta el indicador a el gráfico y automáticamente se dibujará la proporción áurea exacta, ahorrándose el trabajo de tener que encontrar el punto crítico. La interfaz se ajusta según su ordenador a los puntos altos y bajos aproximados de la banda Este indicador corregirá la mayoría de los errores de selección de los puntos
FREE

Introduciendo el Gráficos Quantum Heiken Ashi PRO Diseñadas para brindar información clara sobre las tendencias del mercado, las velas Heiken Ashi son reconocidas por su capacidad para filtrar el ruido y eliminar las señales falsas. Diga adiós a las confusas fluctuaciones de precios y dé la bienvenida a una representación gráfica más fluida y confiable. Lo que hace que Quantum Heiken Ashi PRO sea realmente único es su fórmula innovadora, que transforma los datos de velas tradicionales en

El indicador analiza la escala de volúmenes y la divide en dos componentes: volúmenes vendedores y volúmenes compradores, y también calcula el delta y el delta acumulativo. El indicador no parpadea ni se redibuja, su cálculo y trazado se realizan con bastante rapidez, al tiempo que utiliza los datos de los períodos más pequeños (en relación con el actual). Los modos de funcionamiento del indicador se pueden cambiar utilizando la variable de entrada Modo : Compra - muestra sólo los volúmenes comp
FREE
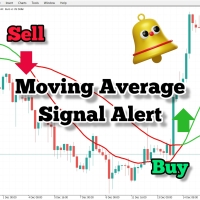
Si utiliza medias móviles en su estrategia de trading, entonces este indicador puede ser muy útil para usted. Proporciona alertas cuando hay un cruce de dos medias móviles, envía alertas audibles, muestra notificaciones en su plataforma de trading y también envía un correo electrónico sobre el evento. Viene con ajustes fácilmente personalizables para adaptarse a su propio estilo y estrategia de trading. Parámetros ajustables: MA rápida MA lenta Enviar correo electrónico Alertas audibles Notific
FREE
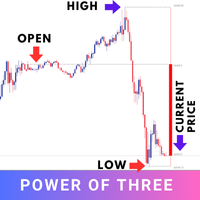
El "Poder de Tres" (PO3) es un concepto desarrollado por el Inner Circle Trader (ICT) para ilustrar un enfoque de tres etapas utilizado por el dinero inteligente en los mercados: Acumulación, Manipulación y Distribución . Los operadores del ICT lo consideran un patrón fundacional que puede explicar la formación de cualquier vela en un gráfico de precios. En términos simples, este concepto es eficaz para cualquier marco de tiempo, siempre y cuando haya un inicio definido, un punto más alto, un pu
FREE
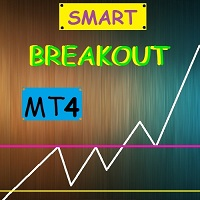
Smart Breakout Indicator determina los niveles de soporte y resistencia y también muestra los puntos de ruptura de los niveles en forma de histograma.
El programa contiene dos indicadores en uno: 1-líneas de soporte y resistencia, 2-indicador de histograma basado en las altas fluctuaciones de precios. El indicador calcula autónomamente los mejores niveles de soporte y resistencia y también en forma de histograma muestra los mejores momentos de la ruptura de las líneas.
El indicador de histog

Auto Optimized RSI: Adaptación Profesional al Mercado La mayoría de los traders fracasan porque utilizan herramientas estáticas en un mercado dinámico. Usar niveles fijos de RSI como 70/30 en todos los gráficos es un error matemático. Si busca una "flecha mágica" sin lógica detrás, este indicador no es para usted. Esta herramienta está diseñada para quienes entienden que la Optimización es la única clave para sobrevivir en el trading. Los indicadores tradicionales no tienen en cuenta el símbolo

Media Móvil Adaptativa AMD (AAMA)
AAMA es un indicador de media móvil adaptativa para MetaTrader 4 que ajusta automáticamente su capacidad de respuesta según las condiciones del mercado. Características principales: Media móvil adaptativa basada en el Ratio de Eficiencia de Kaufman – reacciona rápidamente en tendencias y filtra el ruido en mercados laterales Detección automática de las 4 fases del mercado AMD: Acumulación, Markup (subida), Distribución, Markdown (bajada) Adaptación a la volatil

Dual Timeframe Indicador VWAP para MT4
Descripción Indicador profesional VWAP que muestra tanto **Daily** como **Weekly** VWAP simultáneamente en su gráfico.
Características : - Líneas VWAP duales: Azul para Diario, Rojo para Semanal - Bandas configurables: Dos bandas de desviación para cada marco temporal - Control de sesión: Horas de negociación personalizables para el VWAP diario - Visualización clara: Líneas continuas para el VWAP principal, discontinuas para las bandas - Optimizable: Los

True Super Arrows es un indicador potente y versátil que puede ayudarle a identificar y negociar tendencias rentables. El indicador utiliza una combinación de indicadores técnicos para generar flechas que señalan la dirección de la tendencia. Características: Múltiples métodos de identificación de tendencias : El indicador utiliza una combinación de medias móviles, líneas de tendencia y otros indicadores para identificar tendencias. Dirección precisa de la tendencia : El indicador utiliza divers

AHORA PUEDE DESCARGAR VERSIONES GRATUITAS DE NUESTROS INDICADORES DE PAGO . ES NUESTRA FORMA DE RETRIBUIR A LA COMUNIDAD. >>> IR AQUÍ PARA DESCARGAR
El Ratio de Volatilidad fue desarrollado por Jack D. Schwager para identificar el rango de negociación y señalar posibles rupturas. El ratio de volatilidad se define como el rango real del día actual dividido por el rango real durante un cierto número de días N (es decir, N periodos). Para calcular el ratio de volatilidad se utiliza la siguiente f
FREE

Current event: https://c.mql5.com/1/326/A2SR2025_NoMusic.gif
A. ¿Qué es A2SR ? * Es un indicador técnico líder (sin repintado, sin retraso).
-- Guía : -- en https://www.mql5.com/en/blogs/post/734748/page4#comment_16532516 -- y https://www.mql5.com/en/users/yohana/blog A2SR tiene una técnica especial para determinar los niveles de Soporte (demanda) y Resistencia (oferta). A diferencia de la forma ordinaria que vimos en la red, A2SR tiene un concepto original para determinar los niveles real

¿Está cansado de ser perseguido por picos y látigos?
No sea víctima de los movimientos erráticos del mercado. ¡Haga algo al respecto!
Tome decisiones más inteligentes al instante con el equilibrio preciso de filtros y estadísticas exactas de Impulse Pro.
El momento oportuno lo es todo en el trading
Para obtener más información, visite www.mql5.com/en/blogs/post/718212 ¡Anticipe el próximo gran movimiento antes de que se desarrolle en 3 sencillos pasos!
Ventajas que obtiene
Algoritmo de det

Indicador Algo Trading
Con este indicador, usted tendrá zonas y tendencias que la probabilidad de hight el precio se invertirá de ella. por lo que le da toda la ayuda que usted necesita
¿Por qué debería unirse a nosotros? 1-Este indicador es lógico, ya que está trabajando en el movimiento de días anteriores, para predecir los movimientos futuros.
2-Algo indicador de comercio le ayudará a dibujar las tendencias que es especial y son demasiado fuertes que la tendencia de los fundamentos, las t
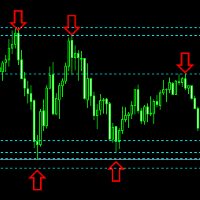
.....................................hi....................... ................para mostrar máximos y mínimos y soportes y resistencias .....................tenemos muchas maneras............................... puede ser útil para encontrar tendencias, máximos más altos, mínimos más altos, máximos más bajos, mínimos más bajos
.......................hoy escribo sobre ellos.......................... ........................puedes introducir el número del último soporte y resistencia .............
FREE

El panel está diseñado para la búsqueda visual rápida y la visualización de pin bars para todos los periodos y en cualquier par de divisas seleccionado simultáneamente. El color de los botones de señal indica la dirección de la barra. Al hacer clic en un botón de señal, se abre el gráfico con este patrón. Puede desactivar los periodos no utilizados haciendo clic en su título. Existe una búsqueda en el historial (por barras anteriores). El desplazamiento (scrolling) del panel se realiza mediante
SR PrevPeriods MT4 Descripción general
SR PrevPeriods traza en tiempo real los máximos y mínimos del día anterior, de la semana anterior y del mes anterior directamente en el gráfico de MetaTrader 4. Es un indicador ligero, diseñado para resaltar zonas históricas de soporte y resistencia que a menudo coinciden con áreas de reacción del precio, rupturas y zonas de reequilibrio. Qué hace
Dibuja líneas horizontales en los niveles clave anteriores y, si lo deseas, etiquetas de texto con el valor e
FREE

Póngase en contacto conmigo después del pago para enviarle el archivo PDF del manual del usuario. Trading Armónico El secreto es el Fibonacci. Se ha demostrado en los mercados que el precio siempre reacciona a los niveles de Fibonacci. Los niveles de Fibonacci son uno de los indicadores más importantes de los cambios de precios. A veces la secuencia de reacciones a estos niveles en el gráfico forman formas geométricas, que se llaman patrones armónicos. El precio crea patrones armónicos con su f

Detector de zonas de sombra Shadow Zone Detector es un indicador MT4/MT5 profesional y avanzado diseñado para identificar y visualizar zonas óptimas de prima y descuento basadas en sombras de velas de plazos superiores (HTF). Inspirado en las técnicas ICT (Inner Circle Trader), esta herramienta permite a los operadores detectar rápidamente las zonas de alta probabilidad para las entradas y salidas con una representación clara y visual. Características principales: Zonas de Prima y Descuento: Det
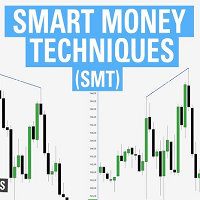
La divergencia TIC SMT representa una situación en el mercado en la que dos activos correlacionados, que se observan dentro del mismo marco temporal, muestran una estructura opuesta. Esto se puede ver en dos activos correlacionados positivamente, como un activo que forma un mínimo más alto, mientras que el otro forma un mínimo más bajo en lugar de un mínimo más alto. Versión 1.03: Añade soporte a plazos superiores Una divergencia TIC SMT sirve como señal primaria de reversión para activos correl

El mejor compañero de trading: Smart Trend Tracer ¿Cansado de perderse en el ruido del mercado? ¿Está preparado para encontrar las tendencias más claras con una precisión milimétrica? Le presentamos Smart Trend Tra cer, la herramienta definitiva diseñada para abrirse paso entre la confusión y revelar las oscilaciones más rentables del mercado. No se trata de un indicador más, sino de su guía personal para detectar las tendencias en el momento en que se forman, dándole la confianza necesaria para
FREE
El Mercado MetaTrader es la única tienda donde se puede descargar la versión demo de un robot comercial y ponerla a prueba, e incluso optimizarla según los datos históricos.
Lea la descripción y los comentarios de los compradores sobre el producto que le interese, descárguelo directamente al terminal y compruebe cómo testar el robot comercial antes de la compra. Sólo con nosotros podrá hacerse una idea sobre el programa, sin pagar por ello.
Está perdiendo oportunidades comerciales:
- Aplicaciones de trading gratuitas
- 8 000+ señales para copiar
- Noticias económicas para analizar los mercados financieros
Registro
Entrada
Si no tiene cuenta de usuario, regístrese
Para iniciar sesión y usar el sitio web MQL5.com es necesario permitir el uso de Сookies.
Por favor, active este ajuste en su navegador, de lo contrario, no podrá iniciar sesión.