Indicadores técnicos para MetaTrader 4 - 39
La desviación estándar de los rendimientos es una forma popular de ver cómo el rendimiento de una barra se relaciona con la historia. La señal se calcula tomando las rentabilidades de los periodos anteriores, ajustándolas a la volatilidad de las rentabilidades de los últimos veinte periodos y dividiéndolas por la desviación típica. Se muestra en un panel separado en forma de histograma.
FREE
Acerca del indicador ChangePP
El indicador ChangePP muestra la variación porcentual del precio para el periodo seleccionado según los parámetros seleccionados y construye las barras correspondientes en la subventana del indicador.
Al hacer clic en una barra o en el nombre de un par, se abre el gráfico correspondiente con el periodo especificado en los parámetros de entrada.
Sin duda, el indicador de negociación ChangePP será útil para los operadores que utilicen la correlación de pares de di
FREE

Este clásico "vieja escuela" MAGIC MACD indicador le da la cruz de los parámetros que establezca. La configuración estándar es (12,26,9) . Las flechas le dan un posible cambio de tendencia. Tenga cuidado y no utilice este indicador como fuente única de señales.
Versión GRATUITA Por favor, siéntase libre de revisar nuestra otra serie de indicadores REX. Tenemos otros indicadores gratuitos.
"OLD BUT GOLD"
FREE

Pips actuales y ganancias monetarias Este indicador muestra los resultados de la posición actualmente abierta en el gráfico. Resultado en pips y en la divisa de factura. Gracias a esto, se puede ampliar el gráfico a toda la pantalla y tener control sobre el resultado de las operaciones sin abrir una ventana de terminal que ocupa un espacio de una pantalla. Las posiciones de visualización de estos datos se pueden ajustar a discreción del usuario y también los colores.
FREE
Versión mejorada del indicador simple de tendencia y oscilador rojo, amarillo y verde. Los colores rojo, amarillo y verde se utilizan para indicar tendencias alcistas, osciladores y tendencias bajistas. El rojo indica una tendencia corta (bajista). El verde indica una tendencia larga (alcista). El amarillo indica un oscilador. Un cambio de amarillo a rojo puede hacer que el mercado pase de ser un oscilador a una tendencia bajista. Un color rojo continuo indica una fuerte tendencia bajista. Un ca
FREE
La utilidad está diseñada para simplificar el análisis gráfico.Después de haber ajustado una vez, puede guardar en una plantilla, se guardarán todos los ajustes.En la configuración se pueden cambiar los niveles de Fibonacci, colores, estilos y grosor de las líneas y etiquetas de texto en los botones.Existe la posibilidad de ampliar la funcionalidad, añadir zonas de tiempo de Fibonacci, arcos de Fibo, líneas angulares, la extensión de las zonas rectangulares al precio actual.Enviar recomendacione
FREE

El indicador traza líneas de máximos y mínimos. La ruptura de los máximos o mínimos suele indicar un cambio (o continuación) de tendencia. Una vez que el precio se mueve a través de una línea, y la vela se cierra, el indicador dibuja una flecha apropiada (también, puede activar alertas). Se debe operar en la dirección de ruptura inmediatamente o después de un ligero retroceso. Es mejor operar siguiendo la tendencia en un marco temporal más amplio. Este indicador es fácil de usar, pero sin embarg
FREE
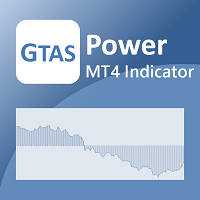
GTAS Power es un indicador de impulso que ayuda a determinar tendencias profundas mediante la combinación de medias móviles. Este indicador fue creado por Bernard Prats Desclaux, proprietary trader y ex gestor de fondos de cobertura, fundador de E-Winvest.
Descripción El indicador se representa como un histograma verde o rojo alrededor de una línea de equilibrio 0.
Modo de empleo Cuando GTAS Power es verde, la tendencia profunda es alcista. Cuando es rojo, la tendencia profunda es bajista. Est
FREE

El indicador le permite operar con opciones binarias. El marco de tiempo recomendado es М1 y el tiempo de caducidad es de 1 minuto. El indicador adecuado para el comercio automático y manual. Una posible señal se especifica como una flecha por encima / debajo de una vela. ¡Usted debe esperar hasta que la vela se cierra! Las flechas no se repintan Sesiones de negociación: Sección de Londres y Nueva York Pares de divisas: AUD/CAD Marco temporal de trabajo: M1 Tiempo de expiración: 1 minuto El indi
FREE

Escáner RSI, Múltiples Símbolos y Plazos, Interfaz Gráfica de Usuario Un indicador que escanea múltiples símbolos añadidos desde la vigilancia del mercado y marcos temporales y muestra el resultado en un panel gráfico. Características: Multi símbolo Múltiples marcos temporales Alertas y Notificaciones Monitoreo en vivo Modos de clasificación Cambio de símbolo y plazo con un solo clic Entradas para RSI y configuración del escáner
FREE

Las Medias Móviles tradicionales (SMA, EMA, SMMA, LWMA...) son muy útiles para identificar tendencias, pero qué hará cuando quiera operar en un marco de tiempo más bajo, y necesite identificar la tendencia más grande por un marco de tiempo más alto; Por supuesto, puede hacerlo dividiendo su gráfico en ventanas separadas, pero su análisis no será claro e intuitivo... Es por eso que construimos el indicador Multi Timeframe Moving Average.
Con Multi Timeframe Moving Average (MTF_Moving Average ),
FREE
¡Siga sus operaciones en general! Monitor New Fox es un excelente indicador, que muestra sus ganancias actuales, siendo estas mensuales, semanales y diarias, es decir, todas las ganancias obtenidas desde que abrió el mt4. Nuestro nuevo indicador Monitor New Fox es capaz de desbloquear todas las funciones avanzadas de MetaTrader 4. Este indicador puede graficar con datos simples los datos clave de la cuenta de meta trader (Balance, Equidad, Margen Libre, Ganancia/Pérdida actual, Ganancia/Pérdida
FREE

The TMA Centered Bands indicator for MT4 draws bands on the chart and reports the overall price trend, as well as gives arrows signals to buy and sell when the bar closes outside the channel.
Unlike many TMAs, our version uses the calculation part of the algorithm without redrawing, and also adds the ability to select a symbol. The bands are made up of moving averages, and each of them has an MA period. The name TMA comes from triangular moving averages, as the indicator draws triangular bands
FREE
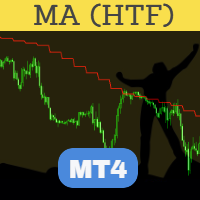
Perfected MA (Moving Average) HTF (Higher Time Frame) es quizás el indicador HTF más avanzado y confiable. Altamente optimizado en términos de ejecución, el indicador viene con la configuración estándar del indicador MA que se suministra con la plataforma MT4. Coloque el indicador en el gráfico, en cualquier período de tiempo. Puede seleccionar un marco de tiempo más alto en las entradas del indicador. El mismo indicador se puede usar en un gráfico varias veces para dibujar MA de múltiples marco
FREE
Asistente de Opciones Binarias (BOA) BURN Indicador de señales proporciona señales basadas en la estrategia de opciones binarias Ana Trader. Indicadores: MACD & Estocástico
¡Deje de perder operaciones, deje de saltar de gráfico en gráfico buscando configuraciones comerciales y obtenga todas las señales en 1 gráfico! Utilice cualquiera de los indicadores de señales BOA con el Asistente de Opciones Binarias (BOA) .
Todos los ajustes del Indicador de Señales BOA son ajustables para ofrecerle má
FREE

Basado en una combinación de indicadores, PS Acid Fulx es un excelente indicador para saber cuándo comprar o vender en cualquier activo y temporalidad. El indicador yo mismo lo he utilizado como una herramienta para mis análisis al operar Forex.
Es un indicador tendencial útil y fácil de comprender.
Si lo combinas con tus análisis propios seguramente obtendrás un buen resultado en tu operativa.
FREE

Presentamos MACD Jurik, un indicador avanzado diseñado para mejorar su estrategia de negociación de divisas mediante la integración de medias móviles personalizadas basadas en la Media Móvil de Convergencia Divergencia (MACD) con el indicador de MetaTrader 4, MACD.
Las medias móviles Jurik son conocidas por su precisión y fiabilidad en el análisis de los movimientos de precios en el mercado de divisas. Ofrecen a los operadores representaciones más suaves de la acción del precio, reduciendo el
FREE

Indicador "Zona de tendencia" Asistente para el comerciante, muestra la tendencia actual en el gráfico. Es de esperar que se convierta en un indicador indispensable en sus operaciones. El indicador no se redibuja y no cambia sus valores al cambiar de periodo de tiempo. El indicador "Zona de tendencia" es un asistente del trader, muestra la tendencia actual en el gráfico. Espero que se convierta en un indicador indispensable en sus operaciones. El indicador no se redibuja y no cambia sus valores
FREE

Analizador de Desviación Estándar de Sesión y Rango de Fechas: Evalúe la desviación estándar del precio de cada barra (alta, baja, cierre, apertura, ponderada, mediana y típica) dentro de sesiones de negociación y rangos de fechas definidos, proporcionando información detallada sobre la volatilidad de los precios y el comportamiento del mercado. **Nota:** Cuando la plataforma de negociación está cerrada, es posible que el indicador no se cargue correctamente. Para asegurarse de que funciona, es
FREE

El indicador de rango se refiere al movimiento medio diario del precio. Para mayor comodidad, se muestra visualmente en los gráficos, pero con el marco temporal H4 e inferior. El indicador se redibuja diariamente y los gaps se incluyen en el cálculo. Una línea de puntos adicional significa que ha pasado el 80% del movimiento diario. Una herramienta importante en el arsenal de un trader profesional o de alguien que quiera llegar a serlo. PrimeTools es una serie de productos diseñados para un tra
FREE

El indicador ALERT TIME LINE avisa de que el precio ha alcanzado un nivel de tiempo especificado.
Arrastre el indicador al gráfico, pulse el botón FIJAR LÍNEA HORARIA, mueva la línea que aparece hasta la hora deseada, cuando el gráfico alcance la hora especificada, se activará una alerta.
Este indicador se utiliza como herramienta auxiliar cuando se opera con zonas horarias, utilizando el sistema gratuito TIME LINE Forex System , vea los resultados y capturas de pantalla a continuación.
Uste
FREE
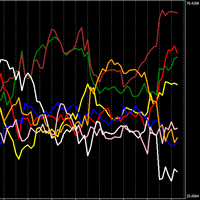
Potente indicador que muestra la fortaleza de la moneda individual.
Cuanto más alto es, más fuerte es la moneda, y viceversa, cuanto más bajo es, más débil es.
Estrategia comercial N1: Abrir posición en los cruces de líneas, si una cruza hacia arriba y la otra hacia abajo, abrir posición en la moneda que está subiendo.
Estrategia comercial N2: posición abierta comprando la moneda más fuerte y vendiendo la moneda más débil.
En la configuración puedes cambiar el marco de tiempo, yo uso el pre
FREE

El indicador R Silver Trend es un indicador comercial de seguimiento de tendencias que muestra la tendencia actual directamente en el gráfico de actividad de Metatrader 4.
Dibuja dos tipos de velas: El azul es para la acción del precio alcista. Rojo para movimiento de precio bajista.
Operar con el indicador R Silver Trend es bastante fácil incluso para los principiantes absolutos y se puede utilizar para el scalping (M1, M5), el comercio diario (M5, M15, M30) y el comercio oscilante (H1, H4,
FREE

El Escáner de Tablero CCI para MT4 te ayuda a rastrear los niveles del Índice de Canal de Materias Primas (CCI) en diferentes marcos de tiempo e instrumentos, y proporciona alertas en tiempo real cuando se detecta una nueva señal. Es fácil de usar y ligero en cuanto a recursos computacionales, garantizando un rendimiento fluido en cualquier computadora. Características Clave: Agrupación Automática de Instrumentos: El escáner recopila todos los instrumentos de tu lista de Vigilancia del Mercado
FREE
SignalFusion 5 Visión total del mercado en un solo gráfico. Monitoriza múltiples pares en tiempo real, convierte los datos en decisiones claras y detecta oportunidades para scalping, day trading y swing. Funciona con pares principales como EUR/USD y GBP/USD y también con exóticos. Añade valor inmediato al conjunto de herramientas de cualquier trader. 5 indicadores integrados. Combina cinco señales en una única lista optimizada y funciona por defecto con 9 pares . El cambio de símbolos es d
FREE

Dibuja los pivotes diarios, semanales y mensuales y los respectivos niveles de soporte y resistencia (S1, S2, S3, R1, R2, R3). Ideal para colocar stop losses y/o utilizar como estrategia de ruptura. Características A diferencia de otros indicadores de pivote en el mercado se obtienen gráficos muy limpios. Los niveles de pivote se trazan independientemente del marco temporal en el que opere, es decir, M1, M5, M15, M30, H1,H4 o marcos temporales diarios. Los niveles de pivote no cambian al cambia
FREE

El Oscilador Precio-Volumen-Tendencia (PVTO) es una potente herramienta de análisis técnico diseñada para proporcionar información sobre la relación entre los movimientos de los precios y los volúmenes de negociación. Este indicador ofrece una perspectiva única de las tendencias del mercado, ayudando a los operadores a identificar posibles oportunidades de compra y venta. Parámetros: Periodo Corto EMA: Define el periodo corto de la EMA para calcular el PVTO. Por defecto 3 Periodo largo EMA: Defi
FREE

este indicador de construcción en los ángulos de Gann y, es muy eficaz. se puede utilizar como (soporte y resistencia)
que, es muy exitoso y fácil de use.if vela Cruz a través de nivel que significa que el precio va ti siguiente nivel
pero con una condición. El precio viene de un nivel anterior
Hay una variable de ángulos para marcos el mejor es 1h marco y stander variable.........
FREE
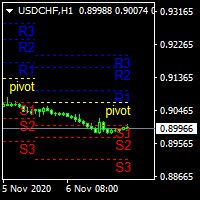
.................................si necesitas niveles de punto pivote............................... ............................este es un creador de niveles de puntos pivote semanales........................... ...es para pivotes semanales y muestra niveles en periodos d1 , H4 , H1 , M30 ............... .................................tambien muestra niveles para 3 ultimas semanas.............................. ................puede utilizarlo con otros indicadores y ver los niveles importante
FREE

Este indicador es una versión independiente de MP Pivot Levels (All in one) que contiene Woodie Pivots. Los puntos pivote de Woodie se componen de múltiples niveles clave, calculados a partir de puntos de precios pasados, con el fin de enmarcar las operaciones de una manera simplista. Los niveles clave incluyen el propio "pivote" y múltiples niveles de soporte y resistencia (normalmente hasta tres cada uno). Los operadores utilizan estos niveles como guía para futuros movimientos de precios a la
FREE
Además de la MA del periodo establecido, en el gráfico se muestran simultáneamente (aunque de forma simulada) las MA de los dos plazos superiores con el mismo periodo. Independientemente del marco temporal al que cambie, se mostrará la MA de ese marco temporal, así como las MA de los dos marcos temporales superiores. Además, también mostrará la MA de 200.
Para mostrar la MA de los plazos superiores en el gráfico actual, debe establecer la MA calculada mediante el indicador de Media Móvil. Si in
FREE

El indicador calcula el total móvil de los rendimientos ponderados lineales. Transforma los tipos en series temporales estacionarias integradas y diferenciales con zonas de compra y venta diferenciadas. Las zonas de compra se muestran en azul y las de venta en rojo. Parámetros: period - número de barras a utilizar para el cálculo ponderado lineal; valor por defecto - 96; smoothing - periodo para EMA; valor por defecto - 5; mode - un valor entero para elegir el modo de cálculo: 0 - negociación a
FREE

El indicador técnico de aceleración/desaceleración (AC) mide la aceleración y desaceleración de la fuerza impulsora actual. Este indicador cambiará de dirección antes de que se produzcan cambios en la fuerza impulsora, la cual, a su vez, cambiará de dirección antes que el precio. Si se da cuenta de que la Aceleración/Desaceleración es una señal de alerta anticipada, le proporciona ventajas evidentes. Pero, un indicador AC clásico no incluye ningún parámetro de entrada. En el archivo fuente podem
FREE

Indicador de tendencia con oscilador. Muestra la zona de precios entre dos medias móviles y un oscilador. Una tendencia alcista se indica en rojo, una tendencia bajista en azul. Ajustes: Slow MA Period - Periodo MA lento Periodo MA rápido - Periodo MA rápido Datos suavizados - Datos suavizados Mostrar Área MA - Mostrar áreas de precios MA Mostrar Oscilación - Muestra la oscilación de la MA Mover Oscilación a MA Lenta - Mostrar un oscilador en una MA lenta Color Up - Color de la tendencia alcist
FREE

Investment Castle Indicator tiene las siguientes características: 1. Dicta la dirección de la tendencia en diferentes Timeframes . 2. Muestra la tasa de aciertos y la tasa de ganancias en el gráfico. 3. Este indicador no repinta el gráfico. 4. 4. Este indicador está incorporado en el Soporte y Resistencia basado en el Castillo de Inversión EA que trabaja con Niveles Clave Psicológicos "Soporte y Resistencia" Indicador.
FREE

El indicador calcula el ángulo entre los máximos, mínimos y cierres de barras vecinas. El ángulo puede medirse en grados o radianes. En una subventana se dibuja un gráfico lineal o un histograma. Puede establecer la escala para el cálculo - flotante o fija. Para utilizarlo en el EA, debe especificar una escala fija.
Parámetros Medida angular - grados o radianes. Modo de escala para el cálculo - modo de escala. Escala libre - transformación libre, el indicador calculará los valores cada vez que
FREE

Se trata de una implementación del indicador de ciclo de mercado descrito por Raghee Horner en el libro "Forex Trading for Maximum Profit" . El estado actual del mercado puede determinarse analizando el ángulo de inclinación de la media móvil exponencial (EMA) que se ejecuta en un periodo de 34 barras. Si la inclinación de la EMA se define como la dirección de la aguja horaria del dial de 12 a 2 horas, se considera que existe una tendencia alcista; de 2 a 4 horas, el mercado se consolida; de 4 a
FREE

APriceChannel es una modificación del indicador estándar Price_Channel. El EA dibuja 2 niveles - el nivel superior muestra el precio Alto para el período de tiempo especificado, el nivel inferior muestra el precio Bajo para el mismo período. Además del período, puede establecer el desplazamiento vertical en puntos para ampliar el canal hacia arriba y hacia abajo. Esto evita falsas rupturas de los niveles actuales de soporte/resistencia.
Entradas Periodo - periodo de tiempo en barras - el número
FREE

El indicador muestra la situación actual de 16 indicadores y 10 estrategias.
Sus valores se forman a partir de la evaluación de los criterios especificados para cada estrategia por separado.
Como resultado, podemos observar en el gráfico la fuerza de todos los indicadores incluidos en él, así como la lógica adicional. Ventajas: Las señales no redibujan sus valores. La flecha se dibuja después de la confirmación. Todo tipo de alertas. Muestra las zonas débiles en función de los resultados de l
FREE

Necesario para los operadores: herramientas e indicadores Ondas calcular automáticamente los indicadores, el comercio de tendencia del canal Perfecta tendencia de onda de cálculo automático de cálculo de canales , MT4 Perfecta tendencia de onda de cálculo automático de cálculo de canales , MT5 Copia local de trading Copia fácil y rápida , MT4 Copia fácil y rápida , MT5 Copia Local Trading Para DEMO Copia fácil y rápida , MT4 DEMO Copia Fácil y Rápida , MT5 DEMO
Recomiendo encarecidamente indic
FREE

En una desviación del enfoque convencional, los operadores pueden aprovechar el patrón de velas envolventes bajistas como una señal de compra para las operaciones de reversión a la media a corto plazo. Así es como se desarrolla esta estrategia alternativa: La vela envolvente bajista (que suele indicar una reversión del impulso alcista) se interpreta de forma diferente en este contexto. En lugar de verlo como un precursor de un nuevo movimiento bajista, lo percibimos como una indicación de un pos
FREE

Indicadores Uso de indicadores de tendencia Medias móviles. Alertas de máxima calidad que no necesitan presentación. Es completamente fiel al algoritmo original y utiliza otras características útiles.
Fácil de operar Realiza todo tipo de notificaciones No es una nueva pintura y no es una pintura de nuevo. Indicador de ajuste WMA50 en Time frame H1 para cualquier par de divisas y Oro Spot. EMA200 en Time frame H1 para cualquier par de divisas y más de EMA250 para Gold spot. Utilizarlo para obte
FREE

Envía alertas de precios cómodamente a tu dispositivo Android/IOS. Asegúrese de que las notificaciones push están habilitadas en la configuración de Metatrader y que el PC/VPS está online 24/7. Los niveles de precios se actualizan automáticamente, pero puede modificarlos en las variables globales, si es necesario. Adecuado para cualquier instrumento de mercado, pero si las notificaciones son demasiado frecuentes, aumente el valor de puntos del parámetro del indicador.
FREE
Presentamos Austin RSI-un indicador innovador diseñado para elevar su estrategia de comercio de divisas mediante la aplicación de medias móviles al indicador de MetaTrader 4, RSI.
El Índice de Fuerza Relativa (RSI) es un oscilador de impulso popular que mide la velocidad y el cambio de los movimientos de precios. Oscila entre 0 y 100 y se utiliza para identificar las condiciones de sobrecompra y sobreventa en el mercado. Los operadores suelen utilizar el RSI para calibrar la fuerza de los movi
FREE
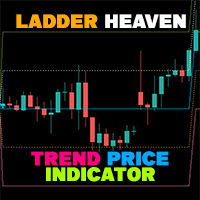
Si tiene dificultades para determinar la tendencia, así como los puntos de entrada, los puntos de stop loss y los puntos de take profit, "Ladder Heaven" le ayudará con ello. El algoritmo "Ladder Heaven" opera sobre el precio en función de los parámetros que introduzca y le proporcionará señales, tendencias, puntos de entrada, puntos de stop loss, puntos de toma de beneficios, soportes y resistencias en la tendencia Esa dirección.
¡Le ayuda a identificar fácilmente tendencias, stop losses y ta
FREE
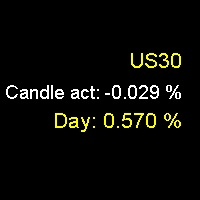
Porcentaje Diario y Vela Actual ¿Te gustaría saber cuánto ha subido o bajado un activo en un día o en la última vela? ¿Deseas una referencia numérica para la fuerza y dirección del movimiento de precios? Entonces, el indicador Porcentaje Diario y Vela Actual es la herramienta que necesitas. El indicador Porcentaje Diario y Vela Actual muestra el porcentaje de aumento o disminución de un activo en el día actual o en la última vela, según el marco de tiempo que elijas. El indicador te permite ver
FREE

Indicador "Trade Zones: Supply and Demand Opportunities" para MetaTrader: Eleva tu Trading con Precisión Estratégica El indicador "Trade Zones: Supply and Demand Opportunities" es una herramienta revolucionaria diseñada para potenciar la toma de decisiones de los traders al identificar claramente las zonas de oportunidad basadas en los principios fundamentales de oferta y demanda. Este indicador, compatible con MetaTrader, proporciona una visión intuitiva de las áreas críticas del mercado donde
FREE
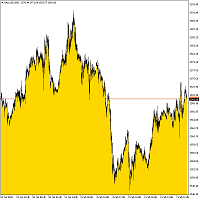
Bottom Background 4 El indicador establece el fondo inferior de un determinado color al precio actual, según la configuración. Descripción de la configuración del indicador: MODO: tres opciones de visualización para el indicador: Bajo: visualización del precio mínimo, Apertura / Cierre: visualización del precio de apertura o cierre, el que sea más bajo, MA: visualización del promedio móvil. PeriodMA - período de promedio móvil.
FREE

Bienvenido al proyecto gratuito Bull Vs Bear Professional Combiner Binary Options and Forex Indicator. Se trata de una IA gratuita, la más potente de su categoría para MT4, con 43 estrategias, 30 filtros, soporte para 10 indicadores externos y 10 bots externos, desarrollada para operar en los mercados de Forex y Opciones Binarias.
↓ Bull vs Bear API Indicator. ↓ Telegram4Mql.dll ↓ Toro vs Oso EA Forex
Descargar:
@bullvsbearcombine
Sitio:
bullvsbearcombiner
FREE

El indicador detecta las eficiencias e ineficiencias del mercado estudiando los movimientos de los precios y marca las velas en las que se produjeron las mejores eficiencias. Las velas más "eficientes" se indican con un histograma de barras verticales. Las barras más altas representan estas velas. Los máximos y mínimos de estas velas son zonas de oferta y demanda, niveles importantes que se volverán a probar en el futuro. Se puede utilizar en todos los marcos temporales con la misma configuraci
FREE

T3 MA rápido Indicador de tendencia derivado de las medias móviles T3. Este indicador forma parte del indicador T3 Cloud MA y se publica aquí por sí solo. Oportunidades de compra/venta por encima/por debajo de la línea. La línea MA también puede utilizarse como soporte/resistencia dinámica para entradas más agresivas. Utilice los valores por defecto para los mejores ajustes. El número de barras de retrospectiva es definido por el usuario. Este indicador se puede utilizar en combinación con otras
FREE

La principal comodidad del indicador inferior es que no es molesto como la mayoría, muestra el precio medio en el gráfico actual. el indicador informa sobre el número de posiciones abiertas para el instrumento actual, así como para todos los instrumentos abiertos incluidos. al calcular el precio medio, tiene en cuenta la comisión y los swaps, muestra el precio neto. Se muestra en el gráfico en la parte inferior de la pantalla, es posible cambiar el color y el tamaño de la fuente.
FREE
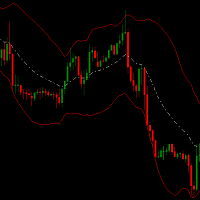
El indicador Channel Hero es un canal especial que le ayuda a detectar zonas de sobreventa/sobrecompra. Puede ser un indicador complementario para su estrategia.
Se puede combinar con las bandas de Bollinger. Cuando el precio rompe por encima de las bandas de Bollinger y la banda superior del canal héroe está por encima de la banda de Bollinger y también
la línea blanca (línea de héroe de canal medio) está por encima de BB medio entonces este punto tiene gran posibilidad de subir. Un buen pun
FREE

HJZHI88888888888888888888888888888888888888888888888888888888888888888888888888888888888888888888888888888888888888888888888888888888888888888888888888888888888888888888888888888888888888888888888888888888888888888888888888888888888888888888888888888888888888888888888888888888888888888888888888888888888888888888888888888888888888888888888888888888888888888888888888888888888888888888888888888888888888888888888888888888888888888888888888888888888888888888888888888888888888888888888888888888888888
FREE

Este indicador le permite superponer simultáneamente tres medias móviles diferentes en el gráfico. Cada una de estas medias móviles tiene ajustes adicionales como: -Tiempo
-Desplazamiento
-Método MA
-Precio aplicado
Con este indicador, puede configurar fácilmente tres medias móviles y encontrar la que más le convenga. También puede utilizar este indicador para determinar la tendencia cuando las medias móviles se cruzan.
FREE

Su motivo principal es superponer líneas horizontales espaciadas según múltiplos del Average True Range (ATR), centradas en un precio de referencia de periodos definidos, como sesiones de negociación, recuentos de velas o intervalos de 12 horas. Esto facilita la identificación de posibles niveles de soporte y resistencia o rangos de precios esperados. Además, marca las principales sesiones de negociación de divisas (Sydney, Tokio, Londres y Nueva York) con flechas para proporcionar un conocimie
FREE
Cambiar de símbolo y de marco temporal mediante los botones de flecha 1. Puede cambiar varios símbolos de uno o todos los gráficos. 2. Puede establecer la lista de símbolos para cambiar entre ellos u obtenerlos de Market Watch. 3. 3. Puede cambiar el marco temporal de uno o todos los gráficos. Lista de plazos aquí [M1, M5, M15, M30, H1, H4, D1, W1, MN1]. Cambiar el símbolo de todos los gráficos: el indicador comprueba el símbolo actual del gráfico para obtener su índice en la lista y cambiarlo p
FREE

Los niveles de volumen son un indicador muy importante para operar en bolsa. La mayoría de las operaciones se realizaron en esos niveles. Este indicador muestra el nivel de precios que tuvo el mayor volumen de operaciones durante un determinado período de tiempo. A menudo, el precio rebota desde esos niveles en el futuro, y puede ser utilizado con éxito en el comercio. Esta es una versión demo que sólo funciona en el par de divisas USD/JPY. Para trabajar con todos los pares de divisas, instale l
FREE

Características principales de RaysFX StepMA+Stoch Adaptabilidad: Nuestro indicador RaysFX StepMA+Stoch está diseñado para adaptarse a las condiciones cambiantes del mercado. Utiliza el Average True Range (ATR) para medir la volatilidad del mercado y ajustar sus estrategias de negociación en consecuencia. Precisión: El indicador genera señales de negociación cuando la línea mínima cruza la línea media. Estas señales se representan como flechas en el gráfico, proporcionando puntos de entrada y sa
FREE

Supertendencia Media Móvil Una combinación de Supertendencia y Media Móvil para crear una configuración comercial convergente Parámetros de entrada: signal mode: ajústelo a true si desea conectarlo a STAT (Signal Tester y Trader) desplazamiento de la flecha: distancia entre la línea rápida de la EMA y la flecha del gráfico Activar el filtro de línea de precio activar la señal de media móvil para la configuración convergente período k período d período s método de promediación Período de media mó
FREE

ÍNDICE EUR
El proyecto del índice de divisas es UNA parte de un estudio exhaustivo de Forex. Mucha gente desconoce la base teórica que impulsa a los tipos de cambio a moverse en el mercado. Con este conjunto de herramientas podrá tener una visión más completa de todo el mercado analizando no sólo la única divisa de un intercambio, ¡sino todos los tipos de cambio que componen esa divisa mirando una única ventana!
El indicador representa fielmente el índice real de una única divisa presente en u
FREE
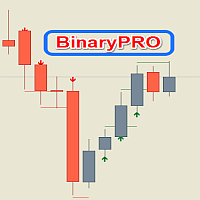
BinaryPRO- es un indicador de señales multidivisa y multihorario, creado según el algoritmo del autor. Produce señales comerciales de alta calidad y oportunas en forma de flechas en cualquier activo financiero negociado en Meta Trader 4. Es una buena alternativa a los servicios de señales de pago. El indicador se puede utilizar con cualquier broker (con cotizaciones de 4/5 dígitos). Las señales comerciales recibidas pueden y deben ser utilizados cuando el comercio de opciones binarias y criptomo

Para todos aquellos traders interesados o que actualmente operan con Ichimoku, no querrán perderse este artículo. Aunque me voy en unas horas con mi novia a Harbin Hot Springs, quería escribir una breve introducción a la Teoría de Números I chimoku ya que ha habido muchas preguntas (y confusión) sobre la configuración de Ichimoku, marcos de tiempo, etc. La base de Ichimoku como es conocido por la mayoría son las 5 líneas; Línea Tenkan Línea Kijun Senkou Span A (parte del Kumo) Senkou Span B (ot
FREE

Necesario para los operadores: herramientas e indicadores Ondas calcular automáticamente los indicadores, el comercio de tendencia del canal Perfecta tendencia de onda de cálculo automático de cálculo de canales , MT4 Perfecta tendencia de onda de cálculo automático de cálculo de canales , MT5 Copia local de trading Copia fácil y rápida , MT4 Copia fácil y rápida , MT5 Copia Local Trading Para DEMO Copia fácil y rápida , MT4 DEMO Copia Fácil y Rápida , MT5 DEMO
Puede establecer el ciclo para o
FREE

Muchos operadores utilizan el indicador Bull-Bear, decidí combinar los dos en uno solo, por lo que la visualización es mejor, y lo estoy compartiendo con ustedes. las reglas de negociación siguen siendo los mismos, se puede ajustar el período de acuerdo a su preferencia.
El Indicador Bull-Bear es un indicador gratuito con varias versiones ampliamente publicadas en internet, esta es solo una versión que yo junté, espero que les guste. Si quieres conocer los indicadores de mi autoría, visita mi
FREE

Presentamos Austin Bands, un innovador indicador diseñado para mejorar su estrategia de negociación de divisas mediante la aplicación de medias móviles al indicador de MetaTrader 4, las Bandas de Bollinger.
Las Bandas de Bollinger son una popular herramienta de análisis técnico que consiste en una banda media (normalmente una media móvil simple), una banda superior (calculada añadiendo un número determinado de desviaciones estándar a la banda media), y una banda inferior (calculada restando un
FREE

El propósito de esta nueva versión del indicador estándar de MT4 proporcionado en su plataforma es mostrar en una sub-ventana múltiples marcos temporales del mismo indicador. Vea el ejemplo que se muestra en la imagen de abajo. Pero la visualización no es como un simple indicador MTF. Esta es la visualización real del indicador en su marco de tiempo. Aquí están las opciones disponibles en el indicador FFx: Seleccione los marcos de tiempo a mostrar (M1 a Mensual) Definir el ancho (número de barra
FREE

El indicador Puntos de Partida para MetaTrader 4 es una herramienta de análisis técnico que muestra los puntos de partida mensuales, semanales y diarios, así como los niveles de 1000 y 500 puntos, en el mercado de divisas. El indicador se muestra como una serie de líneas horizontales que representan los puntos de partida y los niveles. Ventajas de utilizar el indicador de puntos de partida Identificar posibles cambios de tendencia: El indicador Puntos de Partida puede ayudar a los operadores a i
FREE

El indicador está diseñado para determinar el nivel de pivote de un grupo de velas y la dirección de la tendencia. no se repinta el cálculo se realiza en una vela activa si las velas están por encima de la línea principal, la tendencia es alcista si las velas están por debajo de la línea principal, la tendencia es bajista la ruptura de la línea principal señala un cambio de tendencia o un rebote del precio dos modos de visualización, normal y con aceleración (ModeLite) una línea auxiliar muestra
FREE

¿CANSADO DE TENER QUE CALCULAR EL TAMAÑO DEL LOTE CADA VEZ?
¡¡¡Este indicador lo hará por ti, sea cual sea el activo que elijas en 10 segundos !!!
INSTRUCCIONES
Lo que hay que hacer para activar este indicador te llevará unos 10 segundos una vez que entiendas como utilizar este indicador correctamente.
Estos son los pasos a seguir:
Coloque el indicador en el gráfico del activo con el que desea operar.
Vaya a "Entradas ".
Introduzca donde quiere fijar el stop loss .
Elija el riesgo en
FREE
El Mercado MetaTrader es la única tienda donde se puede descargar la versión demo de un robot comercial y ponerla a prueba, e incluso optimizarla según los datos históricos.
Lea la descripción y los comentarios de los compradores sobre el producto que le interese, descárguelo directamente al terminal y compruebe cómo testar el robot comercial antes de la compra. Sólo con nosotros podrá hacerse una idea sobre el programa, sin pagar por ello.
Está perdiendo oportunidades comerciales:
- Aplicaciones de trading gratuitas
- 8 000+ señales para copiar
- Noticias económicas para analizar los mercados financieros
Registro
Entrada
Si no tiene cuenta de usuario, regístrese
Para iniciar sesión y usar el sitio web MQL5.com es necesario permitir el uso de Сookies.
Por favor, active este ajuste en su navegador, de lo contrario, no podrá iniciar sesión.