Indicadores técnicos para MetaTrader 4 - 3

Gold Venamax : este es el mejor indicador técnico de acciones. El algoritmo del indicador analiza el movimiento del precio de un activo y refleja la volatilidad y las posibles zonas de entrada. Características del indicador:
Este es un súper indicador con Magia y dos bloques de flechas de tendencia para un comercio cómodo y rentable. El botón rojo para cambiar de bloque se muestra en el gráfico. La magia se establece en la configuración del indicador, por lo que puede instalar el indicador en

Indicador EnergyX EnergyX es una herramienta única que visualiza la "energía" del mercado en una ventana independiente. Le ayuda a ver rápidamente cuándo la energía está subiendo o bajando, lo que facilita la detección de posibles oportunidades de negociación. Las barras amarillas muestran cuándo aumenta la energía. Las barras rojas muestran cuándo disminuye la energía. Cómo utilizarlo : Cuando el precio se acerca a un nivel de resistencia : Si la energía es alta y está aumentando (amarillo), ha

Si te gusta este proyecto, deja una revisión de 5 estrellas. El precio medio ponderado es la relación del valor negociado con el volumen
total
cambió sobre un horizonte temporal particular. Es una medida del precio promedio
a
que un stock se comercializa sobre el horizonte comercial. VWAP a menudo se
utiliza como
referencia comercial de inversores que pretenden ser lo más pasivos posible en
su
ejecución. Con este indicador podrás dibujar el VWAP para: Día actual. Semana actual. Mes actual. C
FREE

Matrix Arrow Indicator MT4 es una tendencia única 10 en 1 que sigue un indicador 100% sin repintado de marcos temporales múltiples que se puede usar en todos los símbolos/instrumentos: divisas, materias primas, criptomonedas, índices, acciones. Matrix Arrow Indicator MT4 determinará la tendencia actual en sus primeras etapas, recopilando información y datos de hasta 10 indicadores estándar, que son: Índice de movimiento direccional promedio (ADX) Índice de canales de productos básicos (CCI) Ve

Super Signal – Skyblade Edition
Sistema profesional de señales de tendencia sin repintado / sin retraso con una tasa de éxito excepcional | Para MT4 / MT5 Características principales: Super Signal – Skyblade Edition es un sistema de señales inteligente diseñado específicamente para el trading de tendencias.
Utiliza un mecanismo de filtrado de múltiples capas para detectar únicamente movimientos direccionales fuertes respaldados por un impulso real. Este sistema no intenta predecir los máximos

Auto Optimized MFI es un indicador autoajustable que se adapta automáticamente a tu mercado y marco temporal mediante simulaciones de operaciones reales sobre datos históricos. A diferencia de los indicadores tradicionales con niveles fijos de MFI como 80/20, este indicador se ajusta al comportamiento real del precio y el volumen para identificar zonas de compra y venta más efectivas. Cómo funciona Analiza velas históricas dentro de un rango personalizable y simula entradas y salidas basadas en

Antes: $299 Ahora: $99 Oferta Demanda utiliza la acción previa del precio para identificar desequilibrios potenciales entre compradores y vendedores. La clave está en identificar las zonas con mejores probabilidades, no sólo las que no se han tocado. El indicador Blahtech Supply Demand ofrece una funcionalidad que antes no estaba disponible en ninguna plataforma de negociación. Este indicador 4 en 1 no sólo destaca las zonas de mayor probabilidad utilizando un motor de fuerza multicriterio, sino

The price is indicated only for the first 30 copies ( only 2 copies left ). El siguiente precio aumentará a 150 $. El precio final será de 250 $ . Sniper Delta Imbalance es una herramienta profesional para el análisis profundo de delta - la diferencia entre los volúmenes comprador y vendedor. Lleva el análisis del volumen al siguiente nivel, permitiendo a los operadores ver en tiempo real quién controla el precio -compradores o vendedores-

indicador de nivel de volatilidad es un oscilador de volatilidad para ver puntos de inversión de tendencia. tendencias de los precios ha reverese cuando la volatilidad inreased . este indicador muestra la tendencia de volatilidad en los puntos de reversion. mayormente el mismo nivel de volatilidad arriba y abajo son puntos de reversion. el color rojo muestra los puntos de volatilidad y probablemente la tendencia sera a la baja. el oscilador de color azul muestra el punto profundo del precio cuan

Cálculo avanzado realizado por la acción del precio puro para encontrar rupturas LH y HL.
Le dará un gran punto de inversión en el mercado.Las señales LH y HL también se pueden usar para las rupturas de traingle.
Una vez que ocurre la ruptura, indica una fuerte reversión. Buen filtro para promedios móviles. Sugiero usarlo con indicadores de tendencia.
Se puede utilizar como una confirmación adicional de soporte y resistencia, indicadores de oferta y demanda.
Se pueden encontrar más detalles e

Actualmente cambiado al gráfico de 4 horas - pero el uso de otros marcos de tiempo para la confirmación. :-) Yo cambio mi marco de tiempo principal basado en el movimiento del mercado en el momento. El Hurricane Forex Indicator es un indicador multi-marco de tiempo que incluye cosas tales como Notificaciones de Comercio, Calculadora de Comercio, Indicador de Momento, recompensa de riesgo y mucho más. Tenemos una sala de comercio libre para nuestros usuarios también. Por favor, echa un vistazo al

Este indicador es otra variante del famoso y potente indicador Fibonacci-SS https://www.mql5.com/en/market/product/10136 pero tiene un comportamiento diferente en la colocación de Orden Pendiente y Línea TP. Coloca automáticamente las líneas de retroceso de Fibonacci de las últimas barras visibles más altas y más bajas en el gráfico con: Una Orden Pendiente automática (Compra/Venta). Taking Profit 1, Taking Profit 2 es punto pivote y Taking Profit 3 para oportunidad de recompensa extendida. La m

Póngase en contacto conmigo después del pago para enviarle el archivo PDF del manual de usuario. Introducción El indicador de media móvil es el más conocido y uno de los más populares entre los operadores. Es muy sencillo trabajar con él, pero una pregunta básica siempre se ha convertido en un gran reto entre los traders: ¿Cuál es la configuración óptima de la media móvil para cada gráfico? La respuesta a esta pregunta es muy difícil, usted tiene que probar diferentes configuraciones del indica
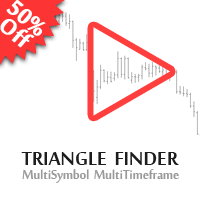
50% de descuento. Precio original: $60 El Buscador de Triángulos es un tablero multi-símbolo multi-marco de tiempo que monitorea y encuentra patrones de triángulos simétricos en 28 símbolos y 9 marcos de tiempo con una función de escaneo profundo para escanear todos los símbolos de vigilancia del mercado (¡hasta 1000 instrumentos!).
Descargar Demo aquí (Escanea sólo M1 y M5) Descripción de la configuración aquí Versión MT5 aquí
Características de Triangle Finder: Monitorización en tiempo real
El indicador Trend Line PRO es una estrategia comercial independiente. Muestra el cambio de tendencia, el punto de entrada a la transacción, así como calcula automáticamente tres niveles de Take Profit y la protección contra la pérdida de Stop Loss Trend Line PRO es perfecto para todos los símbolos de Meta Trader: monedas, metales, criptomonedas, acciones e índices. El indicador se utiliza en el comercio con cuentas reales, lo que confirma la fiabilidad de la estrategia. Los robots que ut
Delta Fusion Pro – Análisis Avanzado de Order Flow para Trading Intradía
Delta Fusion Pro es un indicador profesional para MetaTrader 4 que revela el flujo de órdenes agresivas, mostrando la intensidad y dirección de la presión institucional en tiempo real. A diferencia de los indicadores volumétricos tradicionales, analiza la delta entre volúmenes Ask y Bid para anticipar giros, confirmar tendencias e identificar zonas de interés profesional. Características Principales Sistema Inteligente de

Auto Optimized Bollinger Bands – Herramienta adaptativa de volatilidad para mercados reales Auto Optimized Bollinger Bands es un indicador avanzado para MT4 que mejora las bandas de Bollinger clásicas al seleccionar automáticamente los valores óptimos de período y desviación mediante simulación histórica de operaciones. En lugar de depender de configuraciones fijas, el indicador realiza una optimización en tiempo real basada en el comportamiento del precio, permitiendo que las bandas se ajusten

El "Indicador Gold Trader Pro" es una herramienta avanzada de análisis técnico para la plataforma MetaTrader 4, diseñada para ayudarle a tomar decisiones de negociación informadas sobre el oro. Utilizando una combinación de medias móviles, RSI, ADX, MACD y análisis de volumen, este indicador proporciona señales claras de trading a través de múltiples marcos temporales, incluyendo M5, M15, M30, H1, H4 y D1. Mis indicadores gratis. Sólo te pido que dejes tus comentarios para ayudarme a mejorarlos
FREE

Propósito principal: "Barras Pin" está diseñado para detectar automáticamente barras pin en gráficos de mercados financieros. Una barra pin es una vela con un cuerpo característico y una cola larga, que puede indicar una inversión o corrección de tendencia.
Cómo funciona: El indicador analiza cada vela en el gráfico, determinando el tamaño del cuerpo, la cola y la nariz de la vela. Cuando se detecta una barra pin correspondiente a parámetros predefinidos, el indicador la marca en el gráfico co
FREE
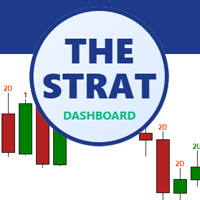
The Strat Dashboard – Escáner Multisímbolo de Patrones para la Estrategia Strat de Rob Smith
Transforma tu Trading con Análisis Strat Multisímbolo en Tiempo Real
The Strat Dashboard es un indicador potente y de nivel profesional diseñado específicamente para traders que usan la reconocida metodología “Strat” de Rob Smith. Monitorea símbolos ilimitados en varios marcos de tiempo simultáneamente, identifica configuraciones de alta probabilidad al instante y no te pierdas nunca otro patrón accion

Versión MT4: https://www.mql5.com/en/market/product/125434 Versión MT5: https://www.mql5.com/en/market/product/157662
ASISTENTE MT4: https://www.mql5.com/en/market/product/107986
RALLY BASE RALLY (RBR), DROP BASE RALLY (DBR), DROP BASE DROP (DBD), DROP BASE DROP (RBD), FAIR VALUE GAP (FVG) / DEBAJILLO, BASE OCULTA
Presentamos el indicador "Oferta-Demanda MT4": su herramienta definitiva para navegar por el dinámico mundo de los mercados financieros con precisión y confianza. Este innovador in
FREE

Royal Scalping Indicator es un indicador avanzado de adaptación de precios diseñado para generar señales de trading de alta calidad. Incorpora capacidades multi-marco de tiempo y multi-moneda que lo hacen aún más potente para tener configuraciones basadas en diferentes símbolos y marcos de tiempo. Este indicador es perfecto para operaciones scalping, así como para operaciones swing. Royal Scalping no es sólo un indicador, sino una estrategia de trading en sí misma. Características Algoritmo Dete

Presentamos Volume Orderflow Profile , una herramienta versátil diseñada para ayudar a los operadores a visualizar y comprender la dinámica de la presión de compra y venta dentro de un periodo de referencia específico. ¡Perfecto para aquellos que buscan obtener una visión más profunda del comportamiento del mercado basado en el volumen! Versión MT5 - https://www.mql5.com/en/market/product/122657 El indicador recopila datos sobre los precios máximos y mínimos, junto con los volúmenes de compra y
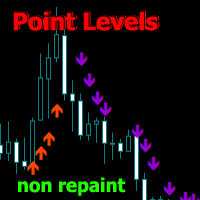
Point Directions : un indicador que muestra los niveles de puntos de soporte y resistencia cuando el precio se mueve. Las flechas muestran rebotes de precios en las direcciones indicadas.
Las flechas no se vuelven a dibujar, se forman en la vela actual. Funciona en todos los plazos e instrumentos comerciales. Hay varios tipos de alertas.
Tiene configuraciones avanzadas para personalizar las señales para cualquier gráfico. Se puede configurar para operar con la tendencia y las correcciones.
Para
SL Curruncy impulso https://www.mql5.com/en/market/product/82593 SL Sesión Fuerza 28 Par de flujo de este intradía asiático de Londres Nueva York Sesiones strength.SL Sesión Fuerza 28 indicador mejor para intradía scalper. mercado poderoso tiempo de movimiento se puede coger mejor símbolo. porque usted sabrá qué monedas son los mejores para el comercio en ese momento. Comprar divisas fuertes y vender divisas débiles (divisas divergentes). Plazos sugeridos para operar : M5 - M15 - M30 - Sin emba

Special offer : ALL TOOLS , just $35 each! New tools will be $30 for the first week or the first 3 purchases ! Trading Tools Channel on MQL5 : Join my MQL5 channel to update the latest news from me Presentamos el revolucionario RSI Kernel Optimized with Scanner, una herramienta de vanguardia que redefine el análisis tradicional de RSI al integrar el poderoso algoritmo de Estimación de Densidad de Núcleo (KDE). Este avanzado indicador no solo proporciona información en tiempo real s

Gartley Hunter Multi - Un indicador para buscar patrones armónicos simultáneamente en docenas de instrumentos de negociación y en todos los marcos temporales clásicos: (m1, m5, m15, m30, H1, H4, D1, Wk, Mn). Manual (Be sure to read before purchasing) | Version for MT5 Ventajas 1. Patrones: Gartley, Mariposa, Tiburón, Cangrejo. Bat, Alternate Bat, Deep Crab, Cypher
2. Búsqueda simultánea de patrones. 2. Búsqueda simultánea de patrones en docenas de instrumentos de negociación y en todos los marc

El indicador analiza el volumen desde cada punto y calcula los niveles de agotamiento del mercado para ese volumen. Consiste en tres líneas: Línea de agotamiento del volumen alcista Línea de agotamiento del volumen bajista Línea que indica la tendencia del mercado. Esta línea cambia de color para reflejar si el mercado es bajista o alcista. Puedes analizar el mercado desde cualquier punto de inicio que elijas. Una vez que se alcance una línea de agotamiento de volumen, identifica un nuevo punto
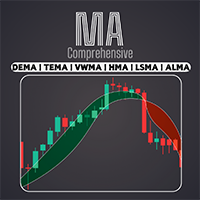
Acceda a una amplia gama de medias móviles, incluyendo EMA, SMA, WMA, y muchas más con nuestro indicador profesional Comprehensive Moving Average . Personalice su análisis técnico con la combinación perfecta de medias móviles para adaptarse a su estilo único de trading / Versión MT5
Características
Posibilidad de activar dos MAs con diferentes configuraciones. Posibilidad de personalizar la configuración del gráfico. Posibilidad de cambiar el color de las velas en función de las MAs cruzada
FREE
Esta VWAP es una VWAP simple, pero hemos incorporado notificaciones que informan cuando el precio alcanza o cruza la línea de la VWAP. Este indicador es un indicador de VWAP tradicional para MetaTrader 4 (MT4). Los parámetros predeterminados son los de la VWAP normal, pero tienes la capacidad de modificar el cálculo de la VWAP y, lo mejor: Cuando el precio toque o cruce la VWAP, lo sabrás a través de alertas, notificaciones en el móvil, correo electrónico o eventos sonoros. indicador de VWAPs an
FREE

Experimente el trading como nunca antes con nuestro incomparable indicador Fair Value Gap MT4 (FVG)
Aclamado como el mejor de su clase. Este indicador de mercado MQL5 va más allá de lo común.
Proporcionando a los comerciantes un nivel incomparable de precisión y conocimiento de la dinámica del mercado. Versión EA: WH Fair Value Gap EA MT4
Indicador basado en SMC: WH SMC Indicator MT4 Características:
Análisis de brecha de valor razonable de mejor calidad. Soporte para múltiples marcos de
FREE

El Fair Value Gap (FVG) es un intervalo de precios en el que se ofrece liquidez a un lado del mercado, normalmente confirmado por un vacío de liquidez en los gráficos de plazos inferiores en el mismo intervalo de precios. El precio puede "abrirse" para crear un vacío literal en la negociación, dando lugar a una brecha de precio real. Los Gaps de Valor Justo son más comúnmente utilizados por los traders de acción de precios para identificar ineficiencias o desequilibrios en el mercado, indicando
FREE

IX Power: Descubre perspectivas de mercado para índices, materias primas, criptomonedas y forex Descripción general
IX Power es una herramienta versátil diseñada para analizar la fortaleza de índices, materias primas, criptomonedas y símbolos de forex. Mientras que FX Power ofrece la máxima precisión para pares de divisas mediante el uso de datos de todos los pares disponibles, IX Power se centra exclusivamente en los datos del mercado del símbolo subyacente. Esto convierte a IX Power en una e

El indicador es un sistema de negociación para operaciones a corto plazo.
Scalper Assistant ayuda a determinar la dirección de la operación, y también muestra los puntos de entrada y salida.
El indicador traza dos líneas (posibles puntos para abrir posiciones).
En el momento de la ruptura de la línea superior hacia arriba (y cuando se cumplen todas las condiciones de negociación), aparece una flecha hacia arriba (una señal de compra), así como 2 objetivos.
En el momento de la ruptura de la líne

¡ACTUALMENTE 20% DE DESCUENTO !
¡La mejor solución para cualquier operador novato o experto!
Este Indicador es una herramienta de trading asequible porque hemos incorporado una serie de características propias junto con una nueva fórmula.
El Indicador Avanzado de Volumen Acumulado de Divisas está especializado para los principales 28 pares de divisas y funciona en todos los marcos temporales. Se trata de una nueva fórmula que en un solo gráfico extrae todo el volumen de divisas (C-Volume) de

Special offer : ALL TOOLS , just $35 each! New tools will be $30 for the first week or the first 3 purchases ! Trading Tools Channel on MQL5 : Join my MQL5 channel to update the latest news from me El indicador Volumetric Order Blocks Multi Timeframe es una herramienta poderosa diseñada para traders que buscan una comprensión más profunda del comportamiento del mercado al identificar áreas clave de precios donde los principales participantes del mercado acumulan órdenes. Estas área

Guía de Uso del Candle Probability Scalper Este indicador hace que el scalping sea facil y 100% intuitivo. Candle Probability Scalper te mostrará de un vistazo los datos de los porcentajes de fuerza de compradores y vendedores en TIEMPO REAL , y en la vela actual. Los porcentajes se actualizan en cada tick, con lo que segundo a segundo sabrás lo que están haciendo la mayoría de compradores y vendedores, sin ningún tipo de retrasos, esto te ayudará inmensamente a determinar o confirmar cual es la

BinaryIndicator es un indicador de alta precisión para el comercio de opciones binarias. Muestra excelentes resultados en scalping. Este indicador se basa en el análisis multifactorial de los indicadores de tendencia, así como osciladores de confirmación, que al final da una mayor precisión de las señales.
Ventajas del indicador Mayor precisión de las señales. Excelentes resultados al negociar opciones binarias con un tiempo de expiración corto de M30 a M1 . Funciona en cualquier marco temporal
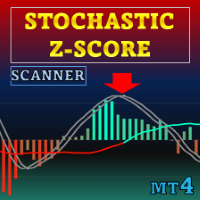
Oferta especial : TODAS LAS HERRAMIENTAS , ¡solo $35 cada una! Nuevas herramientas costarán $30 durante la primera semana o para las primeras 3 compras ! Canal Trading Tools en MQL5 : únete a mi canal de MQL5 para conocer mis últimas novedades Stochastic Z-Score es un oscilador de momento que normaliza el precio mediante un Z-Score, lo acota con lógica estocástica y lo suaviza con HMA, con ALMA como contexto a largo plazo. Los elementos opcionales incluyen histograma, bandas dinámi
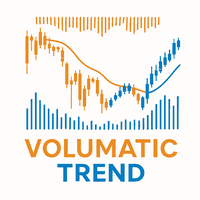
Volumatic Trend es un potente indicador de seguimiento de tendencias que combina el análisis direccional con el comportamiento del volumen en tiempo real. Al combinar una lógica de tendencia adaptable y superposiciones de volumen, ofrece a los operadores una instantánea detallada de la convicción del mercado y los posibles puntos de inflexión. Desde la detección instantánea de cambios de tendencia hasta la visualización de velas ponderadas por volumen, esta herramienta aporta un contexto más pro
FREE

Speed Trend Matrix Ultimate (Versión 5.10) El Speed Trend Matrix (STM) es un sistema de trading integral encapsulado en un solo indicador. A diferencia de los osciladores estándar que simplemente muestran condiciones de sobrecompra o sobreventa, el STM analiza la "velocidad" del movimiento del precio en relación con la volatilidad del mercado (ATR). No solo identifica la dirección de la tendencia, sino también la fuerza detrás del movimiento, filtrando los períodos "planos" de baja inercia donde

El indicador Área de Interés (AOI ) es una potente herramienta diseñada para ayudar a los operadores a identificar zonas clave del mercado en las que las reacciones de los precios son altamente probables. Este indicador destaca específicamente dos zonas críticas: Zona de interés del vendedor (Seller AOI) : Esta zona representa áreas donde es probable que los vendedores entren en el mercado, actuando a menudo como resistencia. Cuando el precio se acerca o toca esta zona, indica que podría produc
FREE

Support And Resistance Screener está en un indicador de nivel para MetaTrader que proporciona múltiples herramientas dentro de un indicador. Las herramientas disponibles son: 1. Cribador de estructura de mercado. 2. Zona de retroceso alcista. 3. Zona de retroceso bajista. 4. Puntos pivotes diarios 5. Puntos de pivote semanales 6. Puntos Pivotes mensuales 7. Fuerte soporte y resistencia basado en patrón armónico y volumen. 8. Zonas de nivel de banco. OFERTA POR TIEMPO LIMITADO: El indicador de so
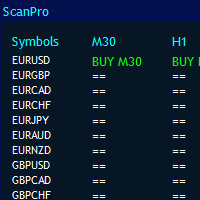
MT4 Universal Panel pro está diseñado para todos los indicadores y períodos de tiempo, incluidos los archivos ex4.
Puede escanear pares ilimitados según la potencia de su computadora y hasta 10 períodos de tiempo. El tamaño del panel se organizará automáticamente.
puede llamar a cualquier indicador por búferes.
Funciona para todos los indicadores predeterminados y personalizados. Simplemente puede usarlo para heikan ashi, rsi, parabólico, renko, fractales, resistencia de soporte, demanda de

Mi indicador de sesión de negociación intradía. SL Fuerza de la sesión 28 Par https://www.mql5.com/en/market/product/57585 Esta estrategia es utilizada incluso por los Bancos para obtener beneficios. Toman una moneda fuerte y la lanzan contra una moneda débil. Este indicador le permite analizar las tendencias ocultas y las correlaciones entre las 8 divisas más negociadas a través de un medidor de fuerza único que crea múltiples gráficos en una sola ventana basados en la acción del precio de cad

ICT, SMC, SMART MONEY CONCEPTS, SMART MONEY, Smart Money Concept, Support and Resistance, Trend Analysis, Price Action, Market Structure, Order Blocks, BOS/CHoCH, Breaker Blocks , Momentum Shift, Supply&Demand Zone/Order Blocks , Strong Imbalance, HH/LL/HL/LH, Fair Value Gap, FVG, Premium & Discount Zones, Fibonacci Retracement, OTE, Buy Side Liquidity, Sell Side Liquidity, BSL/SSL Taken, Equal Highs & Lows, MTF Dashboard, Multiple Time Frame, BigBar, HTF OB, HTF Market Structure,

¡Descubra el secreto para el comercio de Forex exitoso con nuestro indicador MT4 personalizado!
Strategy with RangeBars https://youtu.be/jBaDCAPTtHc
¿Alguna vez se ha preguntado cómo lograr el éxito en el mercado de Forex, obteniendo ganancias constantemente al tiempo que minimiza el riesgo? ¡Aquí está la respuesta que ha estado buscando! Permítanos presentar nuestro indicador MT4 patentado que revolucionará su enfoque para el comercio.
Versatilidad única
Nuestro indicador está especialmente d

El indicador Currency Index permite a los operadores visualizar cualquier índice de ocho divisas principales. Utiliza un cálculo especial que tiene en cuenta pares de divisas específicos y sus ponderaciones.
Las ponderaciones por defecto se basan en los resultados de la Encuesta Trienal de Bancos Centrales del BPI. Gracias a esta ventaja, el operador puede ver la verdadera fuerza y debilidad de cada divisa.
Nota: Si el indicador se utiliza en el Probador de Estrategias (versión demo), por fav
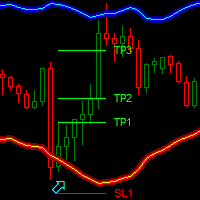
Dark Bands es un indicador para operaciones intradía. Este indicador se basa en la estrategia de tendencia de contador pero uso también volatilidad. Podemos entrar en buen precio con este indicador, con el fin de seguir las inversiones en el instrumento actual.
Ventajas principales
Líneas take profit/stop loss fácilmente visibles Líneas de bandas fiables con colores futuristas, y flechas direccionales intuitivas Estadísticas útiles, que indican la tasa de ganancias de las señales Paquete Plu
FREE

Special offer : ALL TOOLS , just $35 each! New tools will be $30 for the first week or the first 3 purchases ! Trading Tools Channel on MQL5 : Join my MQL5 channel to update the latest news from me Volumatic VIDYA (Variable Index Dynamic Average) es un indicador avanzado diseñado para rastrear tendencias y analizar la presión de compra-venta en cada fase de una tendencia. Utilizando el Promedio Dinámico de Índice Variable (Variable Index Dynamic Average) como técnica principal de s

Auto Optimized RSI: Adaptación Profesional al Mercado La mayoría de los traders fracasan porque utilizan herramientas estáticas en un mercado dinámico. Usar niveles fijos de RSI como 70/30 en todos los gráficos es un error matemático. Si busca una "flecha mágica" sin lógica detrás, este indicador no es para usted. Esta herramienta está diseñada para quienes entienden que la Optimización es la única clave para sobrevivir en el trading. Los indicadores tradicionales no tienen en cuenta el símbolo
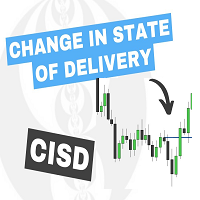
El indicador Cambio en el Estado de Entrega (CISD ) detecta y muestra el Cambio en el Estado de Entrega, un concepto relacionado con las estructuras de mercado.
Los usuarios pueden elegir entre dos métodos diferentes de detección de CISD. También se incluyen varias opciones de filtrado para descartar los CISD menos significativos .
USO Figura 2 Un Cambio en el Estado de Entrega (CISD) es un concepto estrechamente relacionado con las estructuras de mercado, donde el precio rompe un nivel

MT5 version | Indicador Owl Smart Levels | Estrategia Owl Smart Levels | FAQ El Indicador Fractals es uno de los elementos de la estrategia comercial del autor de Bill Williams. Se utiliza para buscar puntos de inversión de precios en el gráfico de precios y, en consecuencia, niveles de soporte y resistencia. El Indicador Full Fractals es un Fractals mejorado que está disponible en el conjunto de herramientas de casi todos los terminales comerciales. Su única diferencia es que para const
FREE
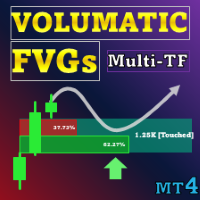
Oferta especial : ALL TOOLS , solo $35 cada uno. Nuevas herramientas costarán $30 durante la primera semana o para las primeras 3 compras ! Trading Tools Channel on MQL5 : Únete a mi canal de MQL5 para recibir mis últimas novedades Volumatic Fair Value Gaps (FVG) identifica y mantiene zonas significativas de desequilibrio de precio y descompone el volumen direccional dentro de cada hueco. El volumen se muestrea desde un marco temporal inferior (M1 por defecto, seleccionable por el
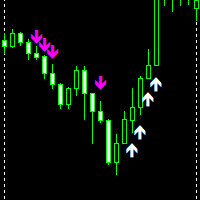
Up down Non-repaint es un indicador MT4 hecho para dar señales precisas sin desaparecer. La flecha magenta/rosa es su señal de venta. Flecha blanca es su señal de compra. El indicador funciona en todos los pares y marcos de tiempo de 1 minuto a marco de tiempo mensual. el indicador esta hecho para scalping no mantenga operaciones por mucho tiempo una vez que las flechas muestran la misma dirección puede agregar más entradas todo lo mejor.
FREE

Resumen del producto gratuito pero avanzado Turbo Trend es un indicador poderoso diseñado para ayudar a los traders a identificar y actuar sobre las tendencias del mercado. Utiliza una combinación de medias móviles avanzadas y análisis de volumen para proporcionar señales claras de la dirección de la tendencia. Turbo Trend simplifica la toma de decisiones al categorizar las condiciones del mercado en tres estados distintos: Tendencia alcista , Tendencia bajista y Tendencia neutral, usando línea
FREE

Indicador de detección de Order Blocks multitimeframe para MT4. Características - Panel de control totalmente personalizable, proporciona una interacción completa. - Oculta y muestra el panel de control donde quieras. - Detecta OB en múltiples marcos de tiempo. - Permite seleccionar la cantidad de OB para mostrar. - Interfaz de usuario de diferentes OBs. - Diferentes filtros de OBs (regulares, rejection y sin capitalizar). - Alerta de proximidad de OBs. - Líneas ADR High y Low. - Servicio de not
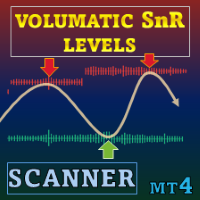
Oferta especial : ALL TOOLS , solo $35 cada uno. Nuevas herramientas costarán $30 durante la primera semana o para las primeras 3 compras . Trading Tools Channel on MQL5 : Únete a mi canal de MQL5 para recibir las últimas noticias Volumatic Support/Resistance Levels Scanner es un indicador de soporte y resistencia que añade contexto de volumen a la estructura de precios. Al mostrar cómo la actividad de trading se agrupa alrededor de los pivotes recientes, ayuda a los usuarios a ver

El indicador muestra el perfil de volumen horizontal en el área especificada (BOX) y el volumen máximo (POC).
Características del producto. 1. Puede usar ticks o solo precio. 2. Espaciado de cuadrícula adaptable (M1-MN). 3. Paso de búsqueda adaptable de alto volumen (mediana) según el tamaño de la caja. 4. Color camaleónico automático para líneas de cajas y botones. 5. Cajas múltiples, fáciles de crear y eliminar. 6. Área de volumen del 70% (habilitado en la configuración). 7. Hay una alerta po

Histograma de Oferta y Demanda Multitemporal
Descripción:
El Histograma de Oferta y Demanda Multitemporal es un indicador potente y limpio que muestra la fuerza de la oferta y demanda del mercado a través de múltiples marcos temporales, específicamente H4 y D1. Muestra histogramas que destacan cuándo los compradores o vendedores dominan, permitiendo a los traders identificar rápidamente las áreas clave de presión del mercado. Características principales: Histogramas H4 y D1: Visualización clar
FREE

El rango diario promedio muestra el rango de pips promedio de un par de divisas medido durante un cierto número de períodos. Los comerciantes pueden usar el ADR para visualizar la acción potencial del precio fuera del movimiento diario promedio. Cuando el ADR está por encima del promedio, significa que la volatilidad diaria es más alta de lo habitual, lo que implica que el par de divisas puede extenderse más allá de su norma.
Nuestro analizador ADR se compone de 5 características principales:

Cada comprador del indicador Scalping signals M1 recibe GRATIS un robot automático que opera siguiendo las señales del propio indicador. Scalping signals M1 — sistema completo de entradas por tendencia para M1 Scalping signals M1 convierte el gráfico en un mapa claro de acción:
el canal de tendencia muestra la dirección del mercado, y las flechas señalan posibles puntos de entrada.
Solo necesitas seguir la dirección del canal y las flechas. Incluso un principiante puede utilizarlo sin dificultad
Binary Trader Master es un indicador basado en flechas que predice el cierre de la vela. Hace su análisis dentro de una sola vela. Cuando la vela se abre, requiere unos momentos para hacer el análisis y predecir el cierre de la vela. Entonces genera una señal. El indicador también le permite aplicar límites de tiempo que puede usar para el análisis, lo que significa que en realidad puede decirle al indicador cuánto tiempo puede tener para el análisis dentro de la vela. El indicador monitorea pat

Este indicador es un predictor de dirección de tendencia simple pero altamente confiable, diseñado para traders que prefieren señales limpias y precisas en lugar de gráficos ruidosos. Características principales Flechas de predicción de tendencia – claras señales de Compra/Venta basadas en la acción del precio. Señales poco frecuentes pero muy precisas – normalmente 1 señal por día. Señales de salida integradas – las flechas Exit indican el mejor momento para cerrar. Sin repainting – las flechas

Oferta especial : ALL TOOLS , ¡solo $35 cada uno! Nuevas herramientas estarán a $30 durante la primera semana o para las primeras 3 compras ! Trading Tools Channel on MQL5 : Únete a mi canal de MQL5 para recibir mis últimas novedades Liquidation Reversal Signals es un indicador diseñado para marcar fases direccionales de liquidación y confirmar puntos de reversión combinando extremos de volumen por Z-score con cambios de estado de Supertrend. En lugar de imprimi
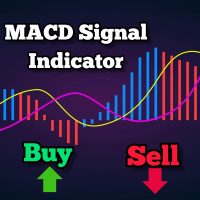
Este es un indicador de seguimiento de tendencias basado en MACD, proporcionando señales de compra cuando está por encima de los 200 MA y señales de venta cuando está por debajo. La señal se genera cuando el MACD cruza la línea cero. El indicador también muestra un nivel de soporte y resistencia que se puede usar como stop loss. Los parámetros ajustables incluyen el período de la MA, el EMA rápido del MACD, el EMA lento y el intervalo de soporte-resistencia. Se representa en los puntos más bajos
FREE
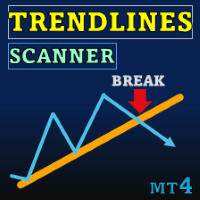
Special offer : ALL TOOLS , just $35 each! New tools will be $30 for the first week or the first 3 purchases ! Trading Tools Channel on MQL5 : Join my MQL5 channel to update the latest news from me Trendlines with Breaks Scanner es una herramienta de trading de última generación diseñada para ayudar a los traders a identificar tendencias críticas y detectar rupturas en tiempo real. Con líneas de tendencia generadas automáticamente basadas en puntos de pivote, este indicador permite

The official release price is $65 only for the first 10 copies, ( only 2 copies left ). Próximo precio: $125 Gold Scalper System es un sistema de trading multifuncional que combina una estrategia de ruptura de niveles clave de liquidez con confirmación y un módulo Smart DOM Pro incorporado para el análisis de la profundidad del mercado. El sistema identifica zonas de acumulación de órdenes limitadas, rastrea la actividad en los niveles de sop

Pivot Flow Pro - Indicador de estructura de tendencia que identifica la dirección del mercado utilizando pivotes de máximos y mínimos para formar una banda dinámica alcista/bajista.
Indicador de estructura de tendencia sin repintado que identifica la dirección del mercado utilizando pivotes de máximos y mínimos promediados para formar una banda dinámica alcista/bajista, con señales confirmadas estrictamente en velas cerradas. Cuando el precio cierra por encima o por debajo de los niveles de piv

Presentamos un indicador de Gann único en su clase para XAUUSD
IQ Gold Gann Levels es una herramienta de precisión sin repintado diseñada exclusivamente para el trading intradía en XAUUSD/Oro. Utiliza el método de la raíz cuadrada de W.D. Gann para trazar niveles de soporte y resistencia en tiempo real, ayudando a los operadores a detectar entradas de alta probabilidad con confianza y claridad. William Delbert Gann (W.D. Gann) fue un excepcional analista de mercado cuya técnica de trading se bas
El Mercado MetaTrader es la única tienda donde se puede descargar la versión demo de un robot comercial y ponerla a prueba, e incluso optimizarla según los datos históricos.
Lea la descripción y los comentarios de los compradores sobre el producto que le interese, descárguelo directamente al terminal y compruebe cómo testar el robot comercial antes de la compra. Sólo con nosotros podrá hacerse una idea sobre el programa, sin pagar por ello.
Está perdiendo oportunidades comerciales:
- Aplicaciones de trading gratuitas
- 8 000+ señales para copiar
- Noticias económicas para analizar los mercados financieros
Registro
Entrada
Si no tiene cuenta de usuario, regístrese
Para iniciar sesión y usar el sitio web MQL5.com es necesario permitir el uso de Сookies.
Por favor, active este ajuste en su navegador, de lo contrario, no podrá iniciar sesión.