KT RSI Power Zones MT5
- Indicators
-
KEENBASE SOFTWARE SOLUTIONS
 Keenbase Trading develops professional MetaTrader 4 and MetaTrader 5 indicators and Expert Advisors designed to help traders make more informed trading decisions.
 - Version: 1.0
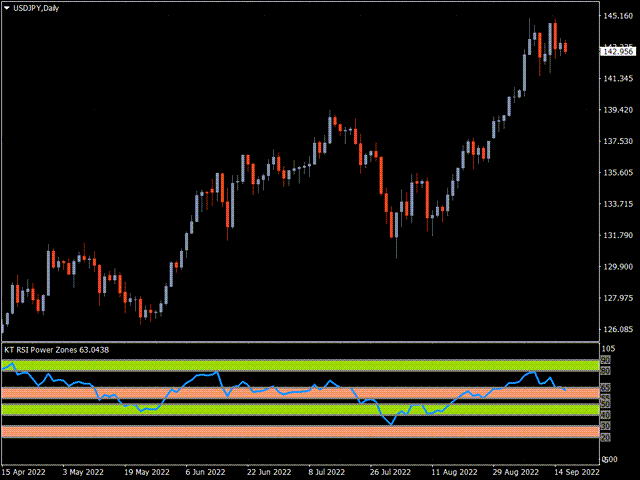
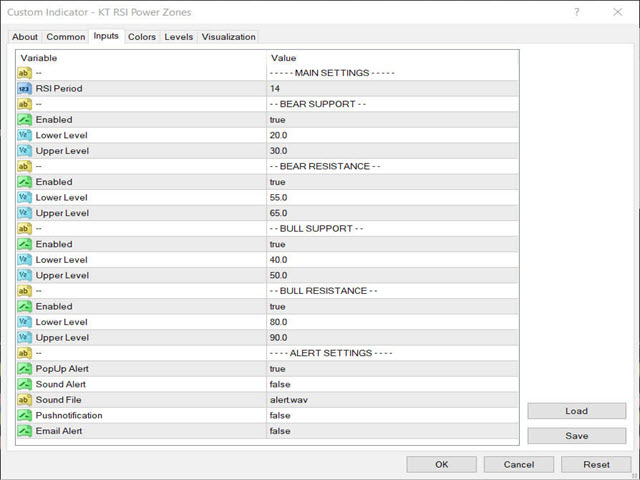
Bull Support
Bull Resistance
Bear Support
Bear Resistance
The bear resistance ranges from 55 to 65. The price is expected to reverse to the downside from this zone.
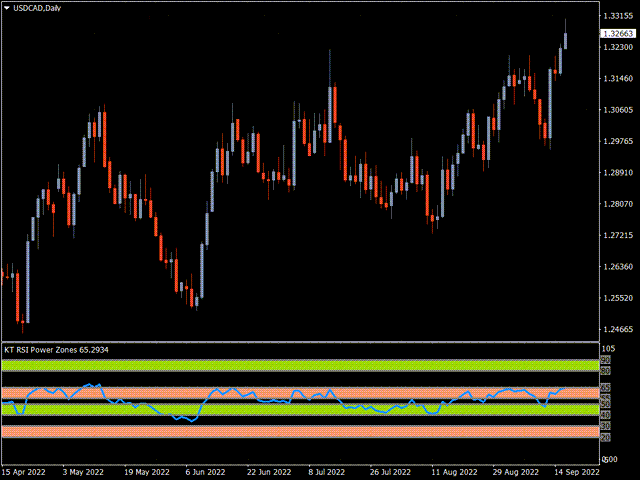
How to use the RSI Power Zones
The Relative Strength Index is a versatile oscillator that may identify overbought-oversold levels, positive and negative divergences, failure swings, and so on.
In general, RSI overbought situations indicate that a reversal is imminent, but overbought can also indicate strength and vice versa.
The RSI Power Zones should be utilized with other indicators such as support and resistance to generate more robust and validated trade signals.
Understanding the Relative Strength Index (RSI)
The relative strength index (RSI) is a momentum oscillator in technical analysis. The RSI calculates whether an investment is overvalued or undervalued by measuring the speed and magnitude of recent price moves.
The RSI can do more than identify equities that are overbought or oversold. It can also identify securities on the verge of a trend reversal or price correction.
It can advise you on when to buy and sell. An RSI reading of 70 or higher has historically indicated an overbought position. A value of 30 or less implies an oversold market.