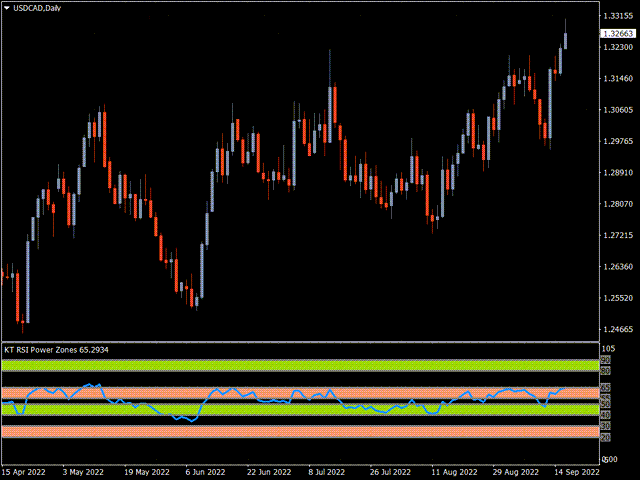
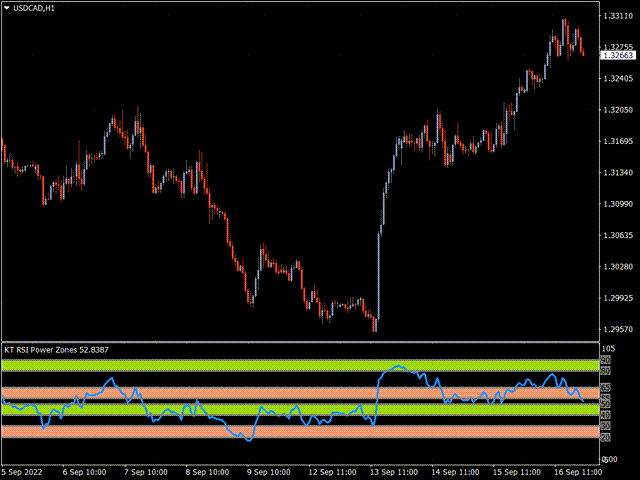
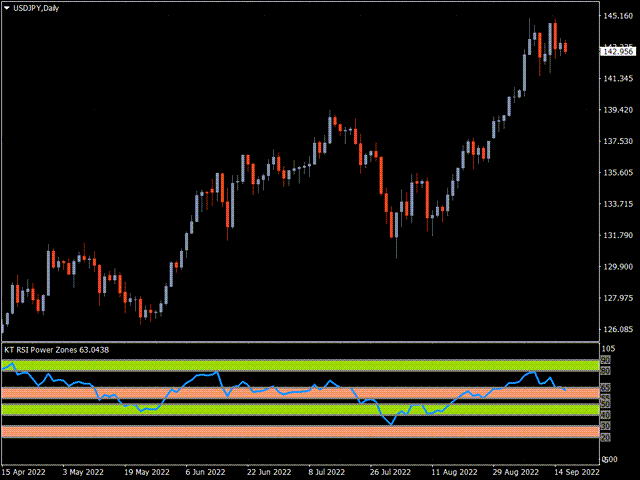
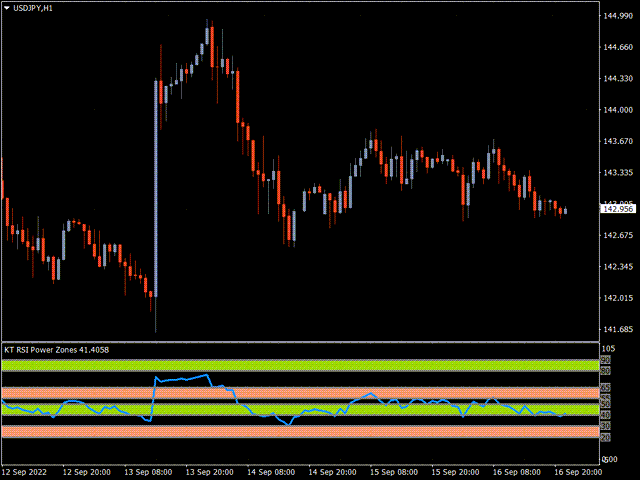
KT RSI Power Zones MT5
- Indikatoren
-
KEENBASE SOFTWARE SOLUTIONS
 Keenbase Trading entwickelt professionelle MetaTrader 4- und MetaTrader 5-Indikatoren sowie Expert Advisors, die Trader dabei unterstützen, fundiertere Handelsentscheidungen zu treffen.
 - Version: 1.0
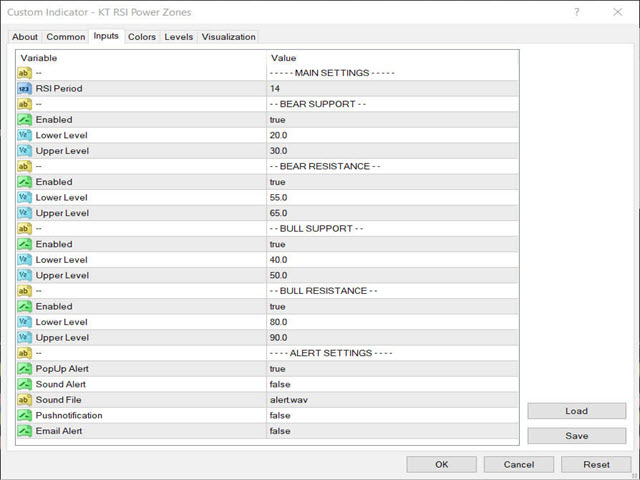
Bullen-Unterstützung
Bullen-Widerstand
Bären-Unterstützung
Bären-Widerstand
Der Bären-Widerstand liegt im Bereich von 55 bis 65. In dieser Zone wird eine Abwärtsumkehr des Preises erwartet.
Wie man die RSI Power Zones verwendet
Der Relative Strength Index (RSI) ist ein vielseitiger Oszillator, der überkaufte oder überverkaufte Zustände, positive und negative Divergenzen, Fehlsignale und mehr identifizieren kann.
Im Allgemeinen deuten überkaufte RSI-Werte auf eine bevorstehende Umkehr hin – sie können aber auch Stärke anzeigen, und umgekehrt.
Die RSI Power Zones sollten mit anderen Indikatoren wie Unterstützung und Widerstand kombiniert werden, um robustere und bestätigte Handelssignale zu erzeugen.
Den Relative Strength Index (RSI) verstehen
Der Relative Strength Index (RSI) ist ein Momentum-Oszillator in der technischen Analyse. Er bewertet, ob ein Wertpapier über- oder unterbewertet ist, indem er die Geschwindigkeit und das Ausmaß aktueller Kursbewegungen misst.
RSI kann mehr als nur überkaufte oder überverkaufte Märkte identifizieren. Er kann auch potenzielle Trendumkehrpunkte oder Korrekturen anzeigen.
Er hilft beim Finden von Kauf- und Verkaufssignalen. Ein RSI-Wert von 70 oder höher gilt traditionell als überkauft, während ein Wert von 30 oder darunter auf einen überverkauften Markt hindeutet.