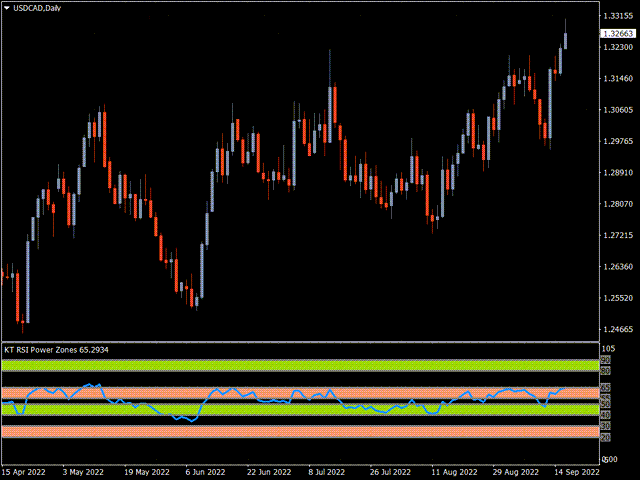
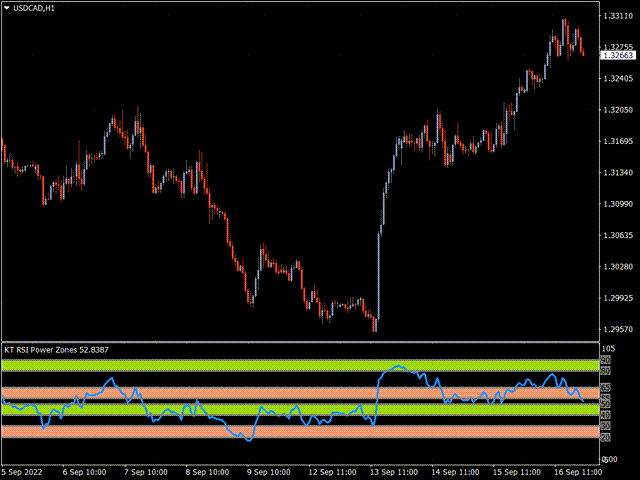
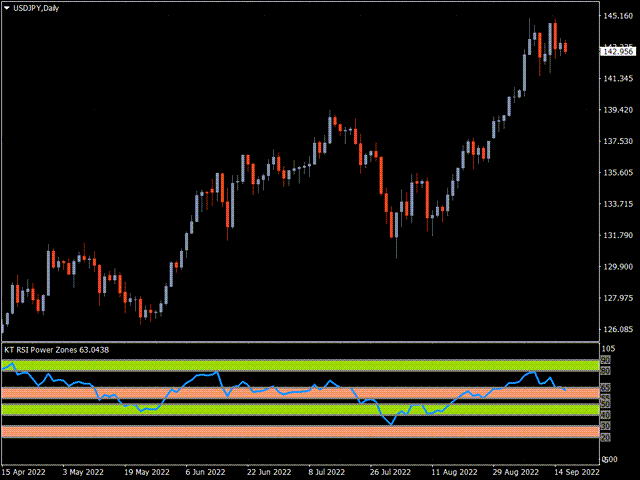
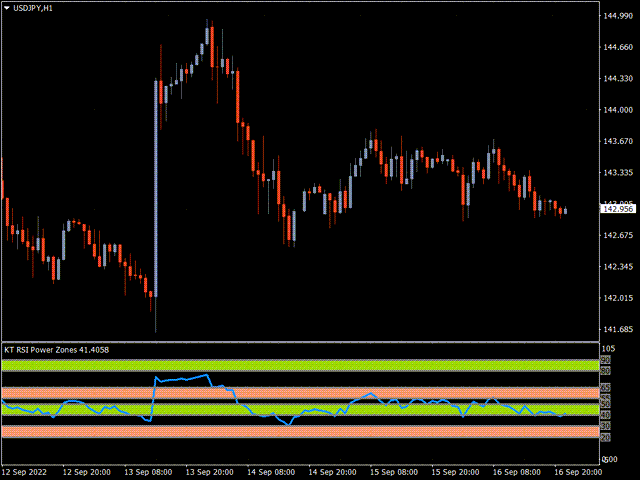
KT RSI Power Zones MT5
- インディケータ
- バージョン: 1.0

KT RSI Power Zones は RSI の動きを 4 つの異なるパワーゾーンに分けて表示し、RSI を用いて潜在的なサポートおよびレジスタンスゾーンを特定するためのツールです。
ブルサポート
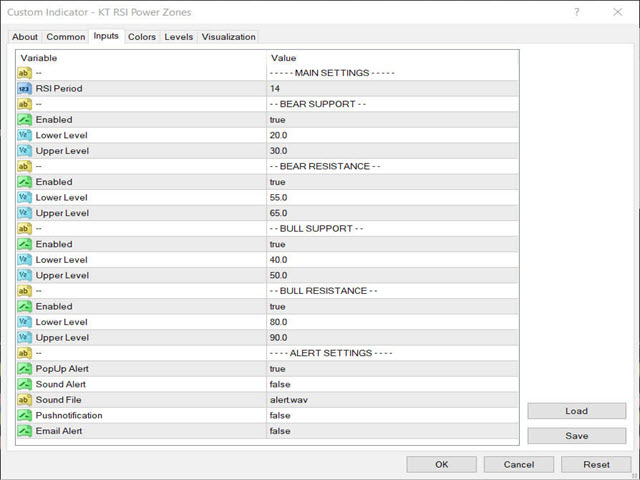
ブルサポートは 40~50 の範囲にあります。このゾーンから価格が上昇へ反転することが期待されます。
ブルレジスタンス
ブルレジスタンスは 80~90 の範囲にあります。このゾーンから価格が下落へ反転することが期待されます。
ベアサポート
ベアサポートは 20~30 の範囲にあります。このゾーンから価格が上昇へ反転することが期待されます。
ベアレジスタンス
ベアレジスタンスは 55~65 の範囲にあります。このゾーンから価格が下落へ反転することが期待されます。
RSI パワーゾーンの使い方
相対力指数(RSI)は、買われすぎ・売られすぎの水準、ポジティブ・ネガティブなダイバージェンス、フェイルスイングなどを識別できる多用途のオシレーターです。
一般的に、RSI が買われすぎの水準にある場合は価格の反転が近いとされますが、それは強いトレンドの証ともなりえます。その逆もまた然りです。
RSI パワーゾーンは、サポートやレジスタンスなど他の指標と組み合わせて使用することで、より信頼性の高いトレードシグナルを生み出せます。
相対力指数(RSI)の理解
相対力指数(RSI)は、テクニカル分析におけるモメンタム系のオシレーターです。最近の価格変動のスピードと大きさを測定し、資産が過大評価されているか過小評価されているかを判断します。
RSI は、買われすぎ・売られすぎの判断だけでなく、トレンド反転や価格修正の兆候も見つけ出すことができます。
売買のタイミングの判断にも役立ちます。RSI の値が 70 以上なら買われすぎ、30 以下なら売られすぎと判断されるのが一般的です。