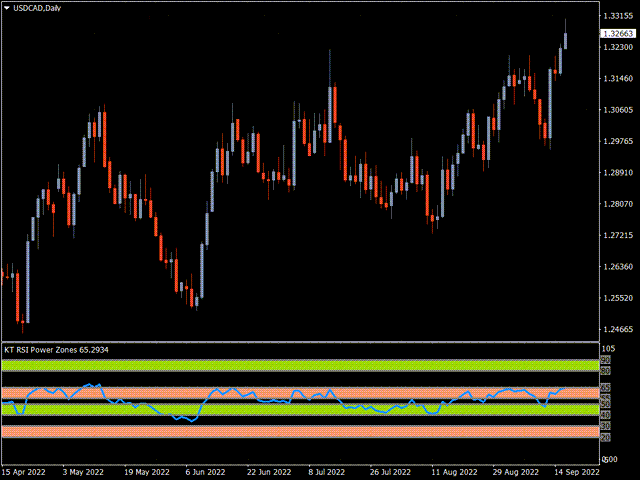
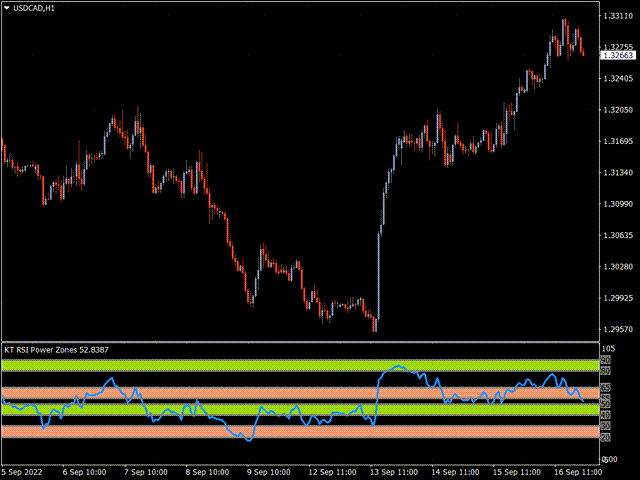
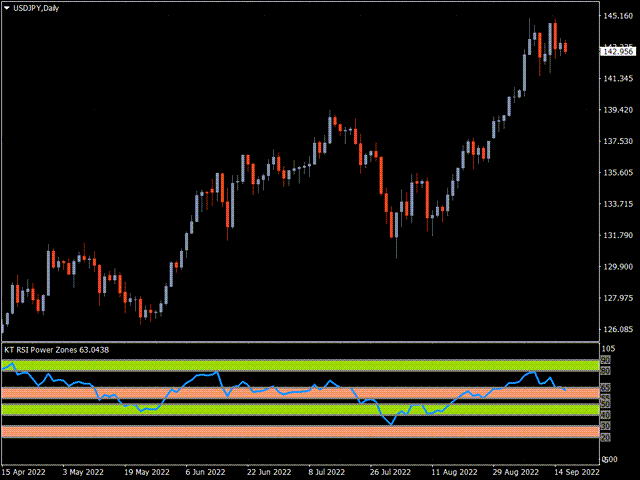
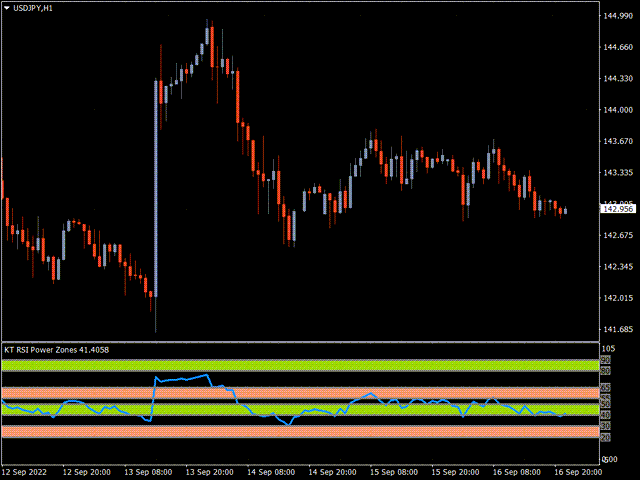
KT RSI Power Zones MT5
- Indicateurs
-
KEENBASE SOFTWARE SOLUTIONS
 Keenbase Trading développe des indicateurs professionnels et des Expert Advisors pour MetaTrader 4 et MetaTrader 5 afin d'aider les traders à prendre des décisions de trading plus éclairées.
 - Version: 1.0
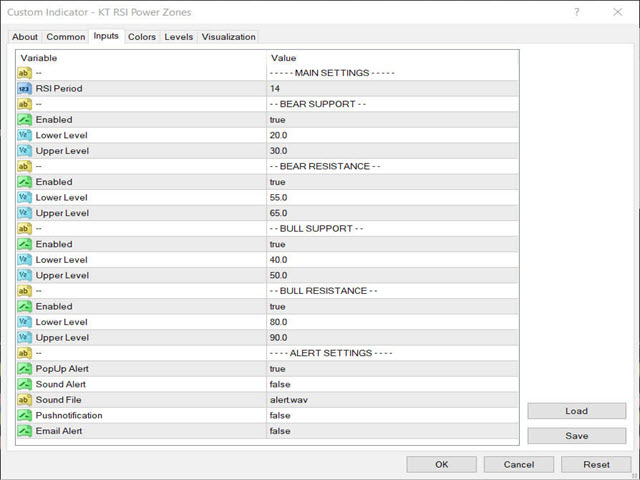
Support haussier
Résistance haussière
Support baissier
Résistance baissière
La résistance baissière se situe entre 55 et 65. Le prix devrait se retourner à la baisse depuis cette zone.
Comment utiliser les zones de puissance RSI
L’indice de force relative (RSI) est un oscillateur polyvalent permettant d’identifier les zones de surachat-survente, les divergences positives ou négatives, les retournements et bien plus.
En général, une situation de surachat indique un retournement imminent, mais peut aussi signaler une poursuite de tendance — et inversement.
Les zones de puissance RSI doivent être utilisées avec d’autres indicateurs comme le support et la résistance pour générer des signaux de trading plus solides et confirmés.
Comprendre l’indice de force relative (RSI)
Le RSI est un oscillateur de momentum utilisé en analyse technique. Il évalue si un actif est surévalué ou sous-évalué en mesurant la vitesse et l’ampleur des mouvements de prix récents.
Le RSI ne se limite pas à signaler les conditions de surachat ou de survente. Il peut aussi identifier des retournements de tendance imminents ou des corrections de prix.
Il peut vous aider à déterminer les bons moments pour acheter ou vendre. Un RSI supérieur ou égal à 70 est généralement considéré comme suracheté. Une valeur inférieure ou égale à 30 indique un marché survendu.