Flosoft Supply Demand MT4
- Indicators
-
Jan Flodin
 Hello, my name is Jan and I have been developing automated trading tools for the last 9 years. I am originally from Sweden but have lived in the Czech Republic since 2003.
PRODUCTS - Version: 1.3
- Updated: 14 May 2026
- Activations: 10
Please if possible consider buying the MT5 version which at the moment offers more functionaIity. I also recommend you to read the product's blog (manual) from start to end so that it is clear from the beginning what the indicator offers.
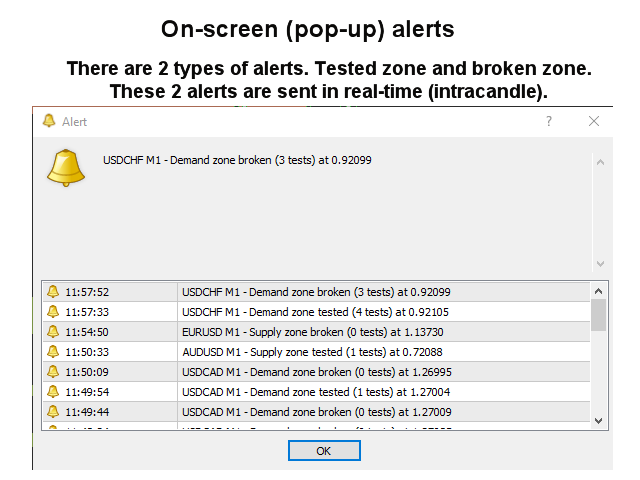
This supply and demand zone indicator draws the zones on the chart and sends alerts when the price has reached or broken a zone. It is also possible to use it to be alerted about regular double tops/bottoms instead of zones. It is possible to use RSI, volume and divergence filters to filter out only the strongest setups. Combined with your own rules and techniques, this indicator will allow you to create (or enhance) your own powerful system.
Features
- The following divergences are supported: MACD, OsMA, RSI, CCI, Stochastics and Awesome.
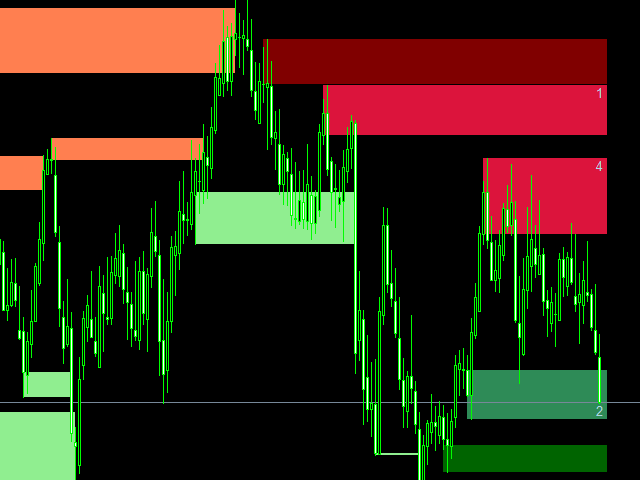
- The zones have 3 colors (adjustable by input). Dark color for untested zone, medium for tested zone and light for broken zone.
- The price of the zone outer border as well as the amount of zone test are written at each zone.
- The indicator can write the signals to global variables which can be used by an Expert Advisor for auto trading.
Input parameters
Please find the description and explanation of the input parameters here.
fine product. i've just contacted the author with request to add on/off button - otherwise the chart is too crowded for me and i'm waiting for the author's response.