Flosoft Supply Demand MT4
- インディケータ
- バージョン: 1.3
- アップデート済み: 14 5月 2026
- アクティベーション: 10

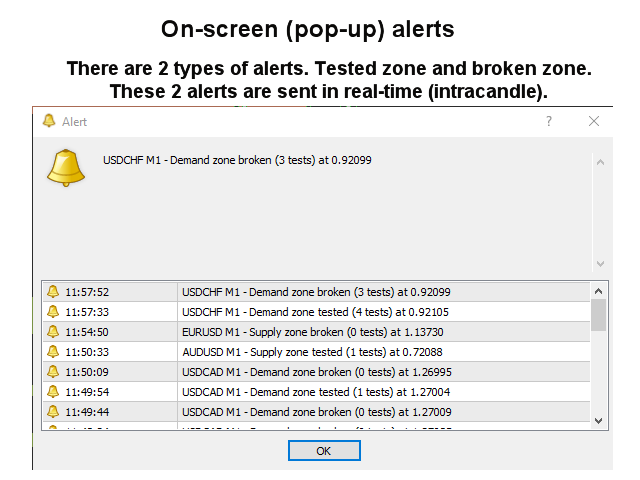
この需給ゾーンインジケーターはチャート上にゾーンを描画し、価格がゾーンに到達またはゾーンを超えたときにアラートを送信します。ゾーンの代わりに、通常のダブルトップ/ボトムについてアラートを受け取るために使用することもできます。 RSI、ADX、ボリューム、および発散フィルターを使用して、最も強力なセットアップのみをフィルターで除外することができます。独自のルールとテクニックを組み合わせることで、このインジケーターを使用して、独自の強力なシステムを作成(または強化)できます。この指標は、需要と供給にすでに精通している経験豊富なトレーダー向けであり、取引を終了または開始することを決定する際にどのように使用できるかを示しています。
特徴
- 次の分岐がサポートされています。 MACD、OsMA、RSI、CCI、確率論的および素晴らしい。
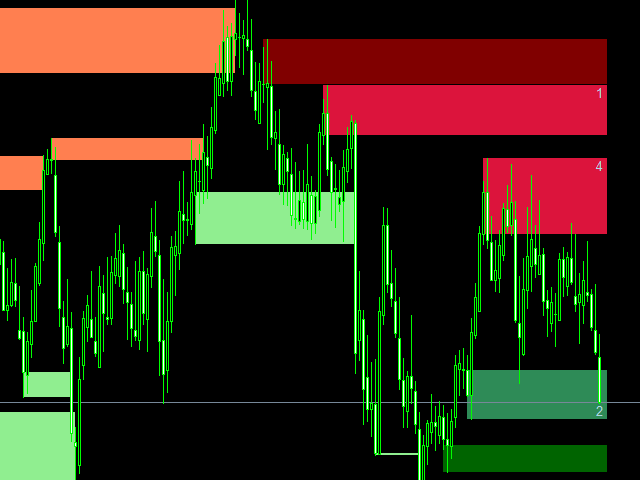
- ゾーンには3色があります(入力で調整可能)。テストされていないゾーンの場合は暗い色、テストされたゾーンの場合は中程度、壊れたゾーンの場合は明るい色。
- ゾーンの外側の境界線の価格とゾーンテストの量は、各ゾーンで書き込まれます。
- インディケータは、エキスパートアドバイザーが自動取引に使用できるグローバル変数にシグナルを書き込むことができます。
入力パラメータ
ここで入力パラメータの説明と説明を見つけてください。
fine product. i've just contacted the author with request to add on/off button - otherwise the chart is too crowded for me and i'm waiting for the author's response.