Flosoft Supply Demand MT4
- 지표
-
Jan Flodin
 Hello, my name is Jan and I have been developing automated trading tools for the last 9 years. I am originally from Sweden but have lived in the Czech Republic since 2003.
PRODUCTS - 버전: 1.3
- 업데이트됨: 14 5월 2026
- 활성화: 10
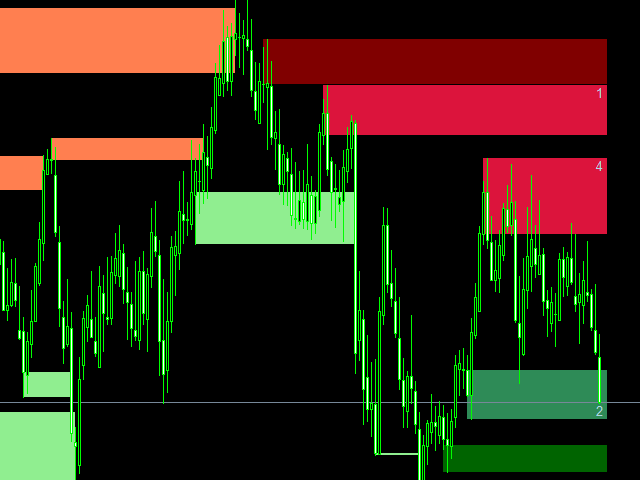
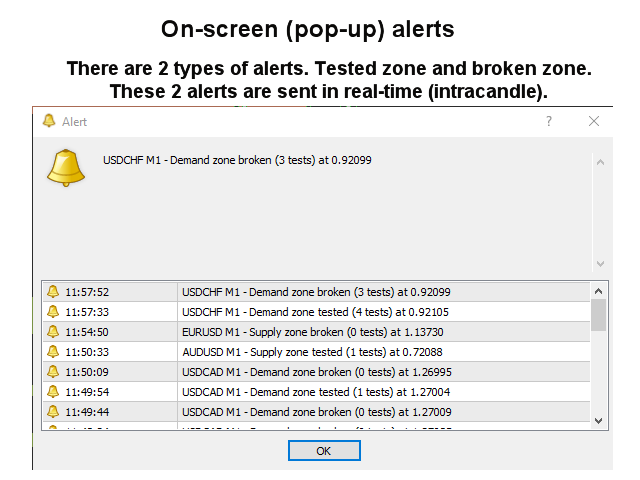
이 공급 및 수요 영역 표시기는 차트에 영역을 그리고 가격이 영역에 도달하거나 영역을 깨면 경고를 보냅니다. 구역 대신 일반 이중 상단/하단에 대해 경고하는 데 사용할 수도 있습니다. RSI, ADX, 볼륨 및 발산 필터를 사용하여 가장 강력한 설정만 필터링할 수 있습니다. 고유한 규칙 및 기술과 결합하여 이 표시기를 사용하면 자신만의 강력한 시스템을 생성(또는 강화)할 수 있습니다. 이 지표는 이미 공급 수요에 대해 잘 알고 있고 거래를 마감하거나 개설하기로 결정할 때 이를 어떻게 사용할 수 있는지에 대해 이미 잘 알고 있는 경험 많은 거래자를 위한 것입니다.
특징
- 다음 분기가 지원됩니다. MACD, OsMA, RSI, CCI, Stochastics 및 Awesome.
- 구역에는 3가지 색상이 있습니다(입력으로 조정 가능). 테스트되지 않은 영역의 경우 어두운 색상, 테스트된 영역의 경우 중간 색상, 깨진 영역의 경우 밝은 색상.
- 구역 외경의 가격과 구역 테스트 금액이 구역별로 표기되어 있습니다.
- 표시기는 자동 거래를 위해 Expert Advisor가 사용할 수 있는 글로벌 변수에 신호를 쓸 수 있습니다.
입력 매개변수
여기 에서 입력 매개변수에 대한 설명과 설명을 찾으십시오.
fine product. i've just contacted the author with request to add on/off button - otherwise the chart is too crowded for me and i'm waiting for the author's response.