Flosoft Supply Demand MT4
- Göstergeler
- Sürüm: 1.3
- Güncellendi: 14 Mayıs 2026
- Etkinleştirmeler: 10

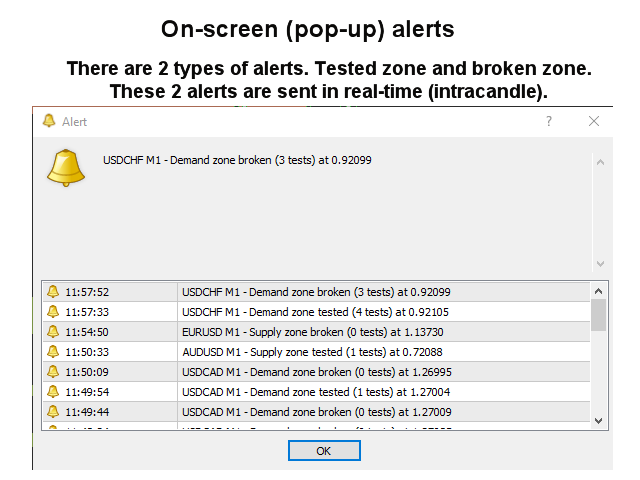
Bu arz ve talep bölgesi göstergesi, grafikteki bölgeleri çizer ve fiyat bir bölgeye ulaştığında veya bir bölgeyi kırdığında uyarılar gönderir. Bölgeler yerine normal çift tepeler/dipler hakkında uyarı almak için de kullanmak mümkündür. Yalnızca en güçlü kurulumları filtrelemek için RSI, hacim ve sapma filtrelerini kullanmak mümkündür. Kendi kurallarınız ve tekniklerinizle birlikte bu gösterge, kendi güçlü sisteminizi oluşturmanıza (veya geliştirmenize) izin verecektir. Bu gösterge, Arz Talebine ve bunun bir işlemi kapatmaya veya açmaya karar verirken nasıl kullanılabileceğine zaten aşina olan daha deneyimli tüccarlar içindir.
Özellikler
- Aşağıdaki farklılıklar desteklenir: MACD, OsMA, RSI, CCI, Stokastik ve Müthiş.
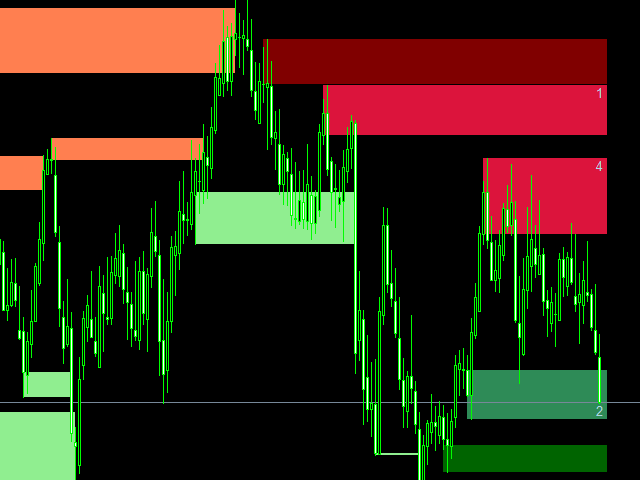
- Bölgelerin 3 rengi vardır (girişle ayarlanabilir). Test edilmemiş bölge için koyu renk, test edilmiş bölge için orta ve kırık bölge için açık renk.
- Bölge dış sınırının fiyatı ve bölge test miktarı her bölgeye yazılır.
- Gösterge, bir Uzman Danışman tarafından otomatik ticaret için kullanılabilecek küresel değişkenlere sinyalleri yazabilir.
Giriş parametreleri
Lütfen giriş parametrelerinin açıklamasını ve açıklamasını burada bulabilirsiniz .
fine product. i've just contacted the author with request to add on/off button - otherwise the chart is too crowded for me and i'm waiting for the author's response.