Active Pivot Levels
- Indicators
-
Robert Gerald Wood
 Professional software developer of 25+ years, now building tools for myself and sharing them to the wider community.
For more information on my products, visit https://www.bunnywood.co.uk - Version: 1.30
- Updated: 4 November 2021
- Activations: 10
Pivot levels are a well established technical level that's recognised in every market.
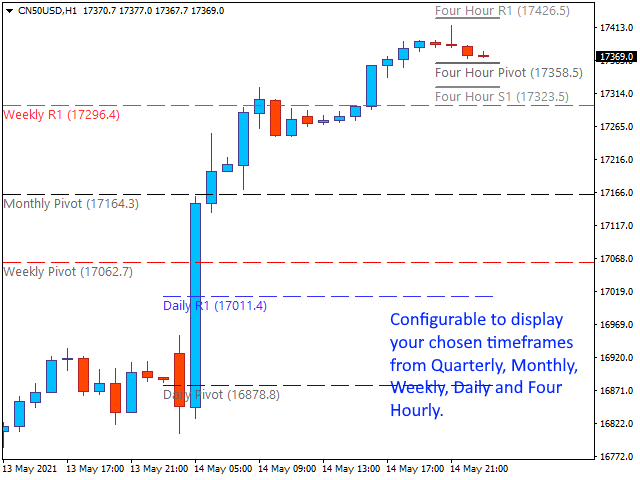
This indicator will draw the current Quarterly, Monthly, Weekly, Daily and four-hourly pivots on the chart, for any symbol. You can also show the Suppport and Resistance levels for each period and choose which to display from levels 1 to 4.
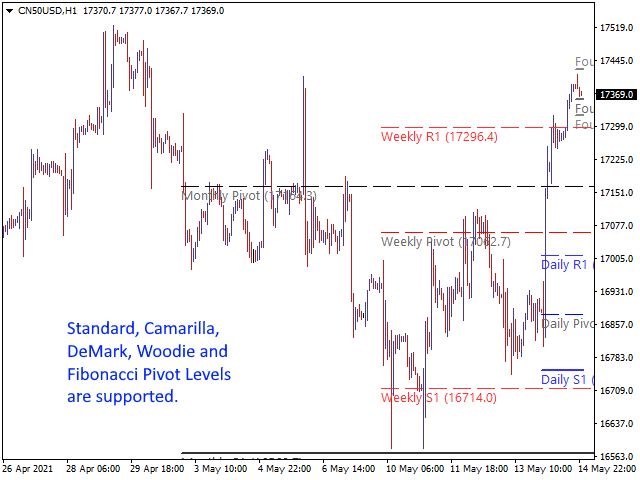
Choose the type of Pivot from:
- Standard
- Camarilla
- DeMark
- Woodie
- Fibonacci
Please note, DeMark pivots have a single Support and Resistance level as per the original specification.
The indicator wall change the way the lines are drawn if the line has been touched by price. This can be very helpful and the strength of the lines support or resistance diminishes considerably once touched.
You can choose to show the Predicted pivot level, for each of the time periods. This will use the same calculation as the normal pivots, but will work on the currently incomplete timeframes. As such it is best used towards the end of that period, when price has already covered the majority of its range.
Settings
https://www.mql5.com/en/blogs/post/746511
This is a very configurable Indicator, so you can get it working as you prefer.
Another great indicator form this author. Runs perfectly, does not slow down MT4 like other pivot indicators. Fully customizable for all styles of trading whether you only need 1 pivot line or if you need many pivot and SR lines. Pivot line changes style once touched by price, great feature. New toggle button keeps your charts clean when you don't need to see the lines. Author is very responsive and helpful.